Races in Alton, Illinois (IL) Detailed Stats
Ancestries, Foreign-born residents, place of birth
Settings
X


Recent posts about races in Alton, Illinois on our local forum with over 2,400,000 registered users:
 | Madison County, Illinois; a vastly underrated place in the Midwest? (4 replies) |
| Belleville vs Edwardsville vs O'Fallon (14 replies) |
| Why does Illinois vote Democrat? (122 replies) |
| Who actually lives in Alton? (47 replies) |
| how do you assess Champaign Urbana as a college town? (35 replies) |
| Alton, Granite City, and other communities (32 replies) |
Latest news about races in Alton, IL collected exclusively by city-data.com from local newspapers, TV, and radio stations
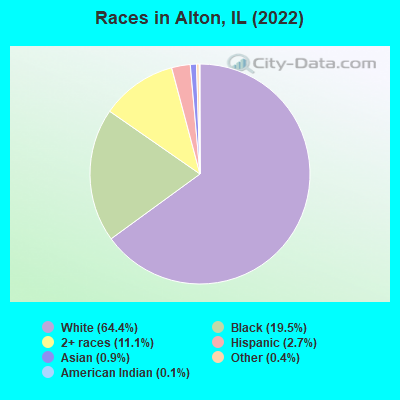
According to 2022 data, the most numerous races in Alton, IL are White alone (16,406 residents), Hispanic (676 residents), and Black alone (4,979 residents). 97.4% of Alton residents speak English at home. 2.0% of Alton, IL residents are foreign-born , which is 610.7% less than the foreign-born rate of 14.0% across the entire state of Illinois.
Race distribution in Alton
2000
2022

- 21,82571.6%White alone
- 7,50424.6%Black alone
- 4541.5%Hispanic
- 4671.5%Two or more races
- 1120.4%Asian alone
- 790.3%Other race alone
- 530.2%American Indian alone
- 20.01%Native Hawaiian and Other
Pacific Islander alone

-
- 16,40664.4%White alone
- 4,97919.5%Black alone
- 2,83211.1%Two or more races
- 6762.7%Hispanic
- 2230.9%Asian alone
- 1100.4%Other race alone
- 270.1%American Indian alone
2000
2022
-
- 8,424,14067.8%White alone
- 1,856,15214.9%Black alone
- 1,530,26212.3%Hispanic
- 419,9163.4%Asian alone
- 153,9961.2%Two or more races
- 13,4790.1%Other race alone
- 18,2320.1%American Indian alone
- 3,1160.03%Native Hawaiian and Other
Pacific Islander alone

-
- 7,356,30158.5%White alone
- 2,299,72618.3%Hispanic
- 1,660,42313.2%Black alone
- 747,2965.9%Asian alone
- 458,5993.6%Two or more races
- 45,3860.4%Other race alone
- 10,4050.08%American Indian alone
- 3,8960.03%Native Hawaiian and Other
Pacific Islander alone

Income and house value in Alton
- Median household income in 2022
- $48,794White non-Hispanic householders
- $43,562Black householders
- $50,934Asian householders
- $53,718Two or more races householders
- Median 2022 house value
- $103,621White Non-Hispanic householders
- $87,374Black or African American householders
- $150,016American Indian or Alaska Native householders
- $117,341Asian householders
- $103,260Some other race householders
- $71,668Two or more races householders
- $116,438Hispanic or Latino householders
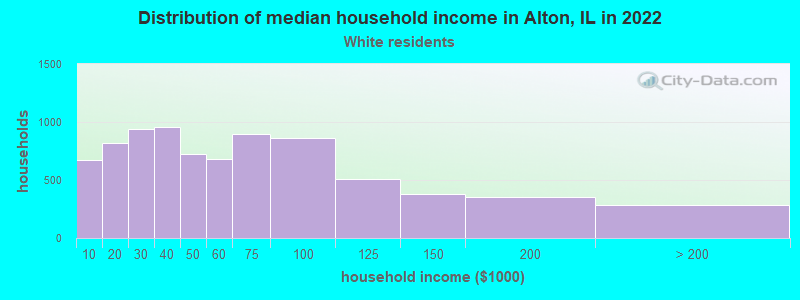
Household income for White non-Hispanic householders
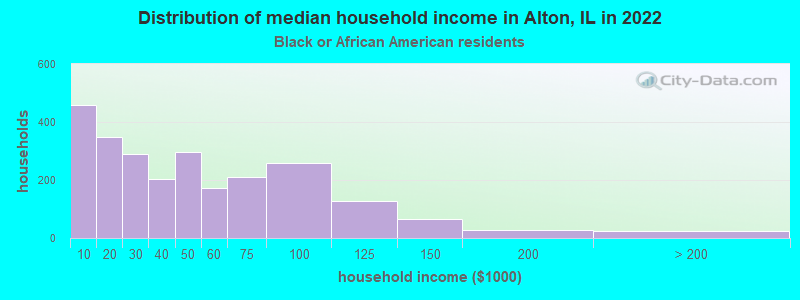
Household income for Black householders
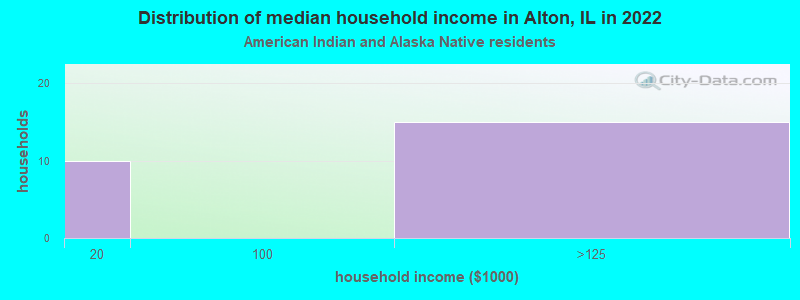
Household income for American Indian and Alaska Native householders
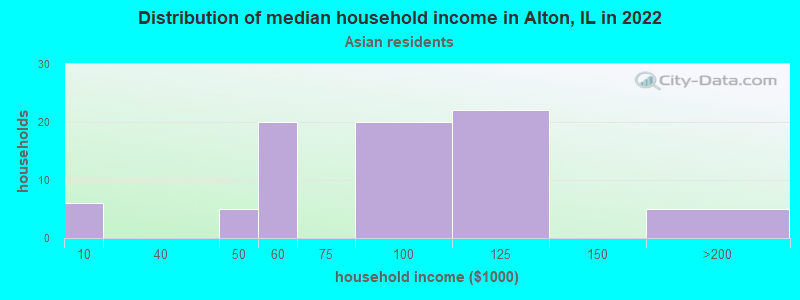
Household income for Asian householders
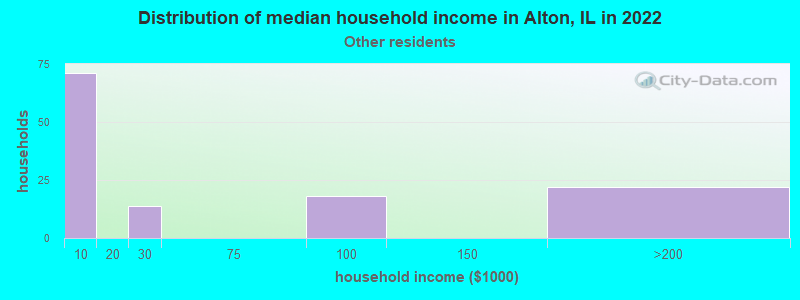
Household income for Some other race householders
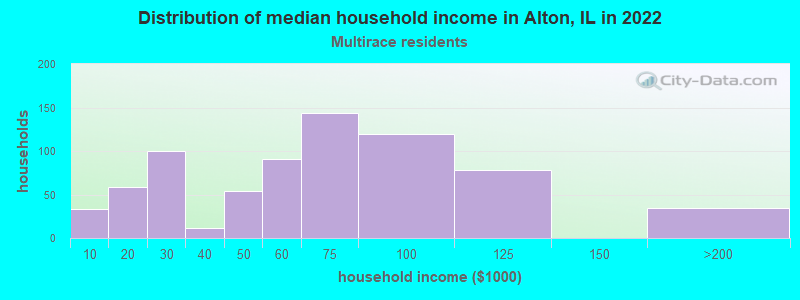
Household income for Two or more races householders
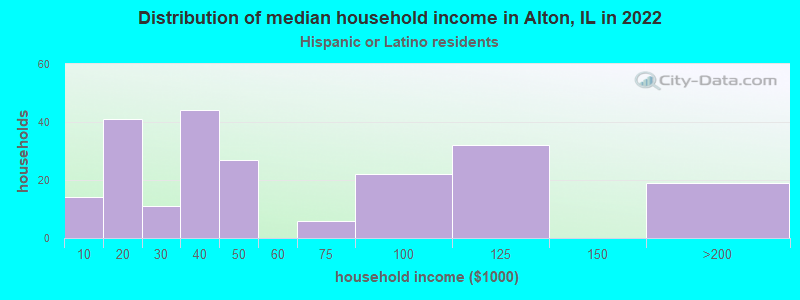
Household income for Hispanic or Latino race householders
Median age by race in Alton
- 42.2Median age for White residents
- 40.0Males
- 43.4Females
- 31.8Median age for Black or African American residents
- 31.2Males
- 35.0Females
- 51.2Median age for American Indian / Alaska Native residents
- 54.1Males
- 26.4Females
- 31.4Median age for Asian residents
- 17.5Males
- 70.8Females
- -593,236,714.4Median age for Native Hawaiian / Pacific Islander residents
- -666,666,666.0Males
- -666,666,666.0Females
- 56.9Median age for Other race residents
- 53.9Males
- 52.5Females
- 21.6Median age for Two or more races residents
- 18.4Males
- 24.3Females
- 42.3Median age for White alone residents
- 40.3Males
- 43.4Females
- 32.9Median age for Hispanic or Latino residents
- 38.4Males
- 32.7Females
Owner/renter occupied households by race in Alton
- House owners and renters - White residents
- 4,92662.0%Owner occupied
- 3,01538.0%Renter occupied
- House owners and renters - Black or African American residents
- 59032.8%Owner occupied
- 1,20867.2%Renter occupied
- House owners and renters - American Indian / Alaska Native residents
- 22100.0%Owner occupied
- House owners and renters - Asian residents
- 4341.5%Owner occupied
- 6158.5%Renter occupied
- House owners and renters - Other race residents
- 3328.6%Owner occupied
- 8371.4%Renter occupied
- House owners and renters - Two or more races residents
- 34337.5%Owner occupied
- 57262.5%Renter occupied
- House owners and renters - White alone residents
- 4,94862.7%Owner occupied
- 2,94337.3%Renter occupied
- House owners and renters - Hispanic or Latino residents
- 8143.8%Owner occupied
- 10456.2%Renter occupied
Language usage in Alton
- English speakers - Total
- 97.4% of residents of Alton speak English at home.
- 0.9% of residents speak Spanish at home
- 8136.8%Speak English very well
- 13963.2%Speak English less than very well
- 2.1% of residents speak other language at home
- 33467.1%Speak English very well
- 16432.9%Speak English less than very well
- English speakers - Born in the United States
- 98.7% of residents of Alton speak English at home.
- 1.1% of residents speak Spanish at home
- 1014.3%Speak English very well
- 6085.7%Speak English less than very well
- 0.7% of residents speak other language at home
- 40100.0%Speak English very well
All residents speak only English at home
- English speakers - Foreign-born
- 13.3% of residents of Alton speak English at home.
- 13.7% of residents speak Spanish at home
- 811.8%Speak English very well
- 6088.2%Speak English less than very well
- 87.1% of residents speak other language at home
- 28265.3%Speak English very well
- 15034.7%Speak English less than very well
White (Caucasian) - Speak only English
| Native: | 99.1% (15,751) |
| Foreign-born: | 21.2% (34) |
White (Caucasian) - Speak another language
| Native: | 0.8% (132) |
| Foreign-born: | 78.7% (127) |
Black or African American - Speak another language
| Native: | 1.2% (65) |
| Foreign-born: | 95.1% (56) |
Asian - Speak only English
| Native: | 26.6% (10) |
| Foreign-born: | 11.5% (19) |
Asian - Speak another language
| Native: | 85.9% (32) |
| Foreign-born: | 100.0% (162) |
Other race - Speak another language
| Native: | 11.4% (16) |
| Foreign-born: | 99.9% (69) |
Two or more races - Speak only English
| Native: | 100.0% (2,593) |
| Foreign-born: | 72.0% (40) |
White alone - Speak only English
| Native: | 99.0% (15,453) |
| Foreign-born: | 18.5% (44) |
White alone - Speak another language
| Native: | 1.0% (152) |
| Foreign-born: | 92.8% (219) |
Hispanic or Latino - Speak another language
| Native: | 8.8% (53) |
| Foreign-born: | 100.0% (78) |
Foreign-born residents in Alton
502 residents are foreign born
| This city: | 2.0% |
| Illinois: | 14.1% |


Marital status for residents in Alton
Marital status - White (Caucasian) population 15 years and over
- Males
- 36.8%Never married
- 43.2%Now married
- 1.4%Separated
- 3.0%Widowed
- 15.6%Divorced
- Females
- 28.8%Never married
- 34.9%Now married
- 3.3%Separated
- 13.5%Widowed
- 19.4%Divorced
Women who gave birth in the past 12 months
| Now married: | 40.0% (77) |
| Unmarried: | 60.0% (115) |
Women who did not give birth in the past 12 months
| Now married: | 37.1% (1,346) |
| Unmarried: | 62.9% (2,278) |
Marital status - Black or African American population 15 years and over
- Males
- 55.0%Never married
- 23.2%Now married
- 1.4%Separated
- 2.6%Widowed
- 17.8%Divorced
- Females
- 46.8%Never married
- 17.0%Now married
- 3.0%Separated
- 9.0%Widowed
- 24.1%Divorced
Women who gave birth in the past 12 months
| Now married: | 0.0% (0) |
| Unmarried: | 100.0% (19) |
Women who did not give birth in the past 12 months
| Now married: | 19.8% (245) |
| Unmarried: | 80.2% (993) |
Marital status - American Indian / Alaska Native population 15 years and over
- Males
- 100.0%Never married
- 0.0%Now married
- 0.0%Separated
- 0.0%Widowed
- 0.0%Divorced
- Females
- 63.6%Never married
- 36.4%Now married
- 0.0%Separated
- 0.0%Widowed
- 0.0%Divorced
Women who did not give birth in the past 12 months
| Now married: | 0.0% (0) |
| Unmarried: | 100.0% (23) |
Marital status - Asian population 15 years and over
- Males
- 61.0%Never married
- 39.0%Now married
- 0.0%Separated
- 0.0%Widowed
- 0.0%Divorced
- Females
- 9.3%Never married
- 90.7%Now married
- 0.0%Separated
- 0.0%Widowed
- 0.0%Divorced
Women who did not give birth in the past 12 months
| Now married: | 83.9% (26) |
| Unmarried: | 16.1% (5) |
Marital status - Other race population 15 years and over
- Males
- 50.4%Never married
- 22.6%Now married
- 11.3%Separated
- 0.0%Widowed
- 15.7%Divorced
- Females
- 9.6%Never married
- 53.8%Now married
- 0.0%Separated
- 34.6%Widowed
- 1.9%Divorced
Women who did not give birth in the past 12 months
| Now married: | 60.0% (10) |
| Unmarried: | 40.0% (7) |
Marital status - Two or more races population 15 years and over
- Males
- 63.5%Never married
- 12.3%Now married
- 4.8%Separated
- 0.0%Widowed
- 19.3%Divorced
- Females
- 40.1%Never married
- 39.4%Now married
- 0.0%Separated
- 3.1%Widowed
- 17.4%Divorced
Women who gave birth in the past 12 months
| Now married: | 47.4% (18) |
| Unmarried: | 52.6% (20) |
Women who did not give birth in the past 12 months
| Now married: | 29.3% (180) |
| Unmarried: | 70.7% (434) |
Marital status - White alone, not Hispanic / Latino population 15 years and over
- Males
- 36.7%Never married
- 43.5%Now married
- 1.4%Separated
- 2.5%Widowed
- 15.8%Divorced
- Females
- 28.6%Never married
- 34.8%Now married
- 3.4%Separated
- 13.5%Widowed
- 19.7%Divorced
Women who gave birth in the past 12 months
| Now married: | 40.0% (78) |
| Unmarried: | 60.0% (117) |
Women who did not give birth in the past 12 months
| Now married: | 37.4% (1,338) |
| Unmarried: | 62.6% (2,235) |
Marital status - Hispanic or Latino population 15 years and over
- Males
- 48.4%Never married
- 21.0%Now married
- 0.0%Separated
- 15.5%Widowed
- 15.1%Divorced
- Females
- 28.7%Never married
- 48.7%Now married
- 0.0%Separated
- 12.6%Widowed
- 10.0%Divorced
Women who did not give birth in the past 12 months
| Now married: | 38.5% (61) |
| Unmarried: | 61.5% (97) |
Ancestries in Alton

- 1,83714.6%German
- 8516.7%American
- 8056.4%Irish
- 7786.2%English
- 2952.3%Polish
- 2752.2%Italian
- 1811.4%European
- 1060.8%Scotch-Irish
- 860.7%African
- 770.6%French
- 690.5%Scottish
- 670.5%Eastern European
- 450.4%Croatian
- 430.3%Norwegian
- 390.3%Swedish
- 340.3%Syrian
- 340.3%Welsh
- 330.3%Dutch West Indian
- 320.3%Macedonian
- 310.2%Nigerian
- 280.2%Ethiopian
- 210.2%French Canadian
- 200.2%Ukrainian
- 170.1%Slovak
- 160.1%Northern European
- 140.1%British
- 100.08%Swiss
- 90.07%Greek
- 80.06%Belizean
- 70.06%Cape Verdean
- 70.06%Yugoslavian
- 60.05%Egyptian
- 40.03%Czechoslovakian
- 30.02%Hungarian
- 30.02%Celtic
- 20.02%Finnish

Geographical mobility in Alton

- Same house 1 year ago
- 14,85789.7%White (Caucasian)
- 4,05581.4%Black or African American
- 5176.5%American Indian / Alaska Native
- 19581.2%Asian
- 21897.9%Other race
- 2,70192.1%Two or more races
- 14,70590.0%White alone, not Hispanic / Latino
- 54880.3%Hispanic or Latino

-
- Moved within same county
- 9065.5%White / Caucasian
- 87917.6%Black or African American
- 1623.7%American Indian / Alaska Native
- 20.8%Asian
- 52.2%Other race
- 1675.7%Two or more races
- 8675.3%White alone, not Hispanic / Latino
- 8212.0%Hispanic or Latino

-
- Moved within same state
- 2761.7%White / Caucasian
- 1893.8%Black or African American
- 5121.1%Asian
- 2661.6%White alone, not Hispanic / Latino
- 81.1%Hispanic or Latino

-
- Moved from different state
- 4702.8%White / Caucasian
- 380.8%Black or African American
- 752.6%Two or more races
- 4692.9%White alone, not Hispanic / Latino
- 243.6%Hispanic or Latino

-
- Moved from abroad
- 60.0%White
- 60.0%White alone, not Hispanic / Latino

Children Nativity (place of birth) in Alton
Place of birth for residents in Alton
![Place of birth for the foreign-born population - Regions]()
- 195Asia
- 114Americas
- 98Europe
- 98South Central Asia
- 97South Eastern Asia
- 94Africa
- 94Latin America
- 59Eastern Africa
- 48Central America
- 43Eastern Europe
- 35Western Africa
- 33South America
- 29Western Europe
- 26Northern Europe
- 20Northern America
- 13Caribbean

![Place of birth for the foreign-born population - Countries]()
- 83India
- 67Vietnam
- 48Mexico
- 35Ethiopia
- 35Nigeria
- 34North Macedonia (Macedonia)
- 29Germany
- 28Philippines
- 24Zimbabwe
- 23Ireland
- 20Canada
- 18Peru
- 13Bahamas
- 12Argentina
- 9Bosnia and Herzegovina
- 8Kazakhstan
- 7Pakistan
- 3Ecuador
- 2Thailand
