Races in Arnold, Maryland (MD) Detailed Stats
Data:
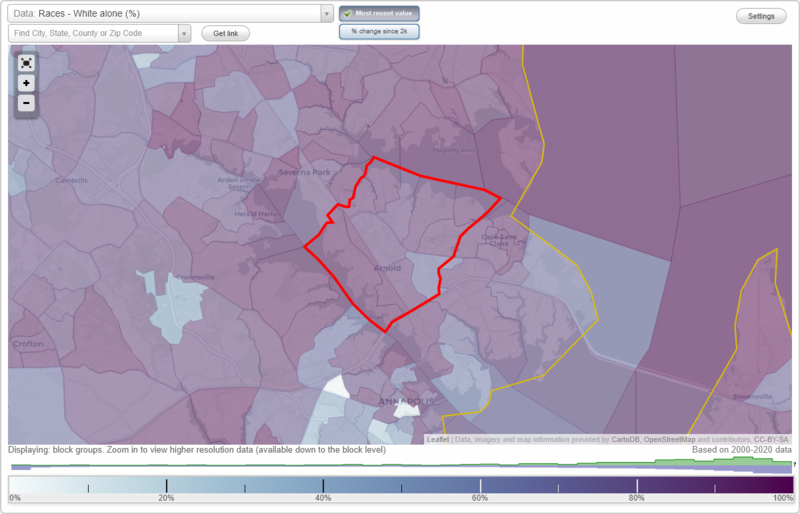
Races - White alone (%)
Races - White alone (% change since 2000)
Races - Black alone (%)
Races - Black alone (% change since 2000)
Races - American Indian alone (%)
Races - American Indian alone (% change since 2000)
Races - Asian alone (%)
Races - Asian alone (% change since 2000)
Races - Hispanic (%)
Races - Hispanic (% change since 2000)
Races - Native Hawaiian and Other Pacific Islander alone (%)
Races - Native Hawaiian and Other Pacific Islander alone (% change since 2000)
Races - Two or more races(%)
Races - Two or more races(% change since 2000)
Races - Other race alone (%)
Races - Other race alone (% change since 2000)
Racial diversity
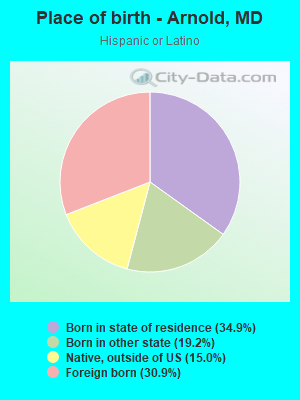
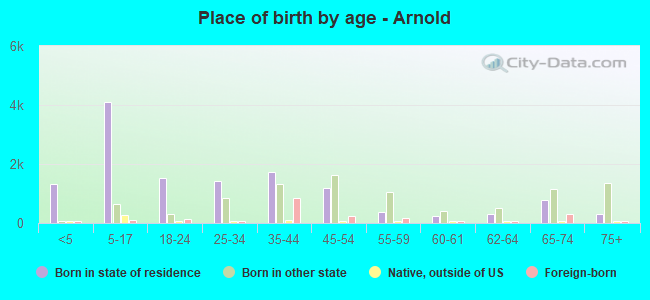
Place of birth - Born in state of residence (%)
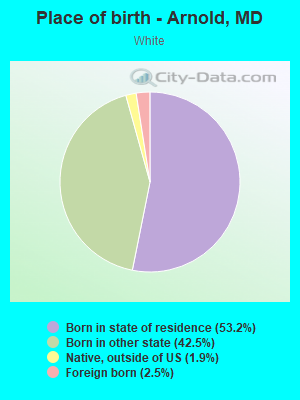
Place of birth - Born in state of residence (%) - White
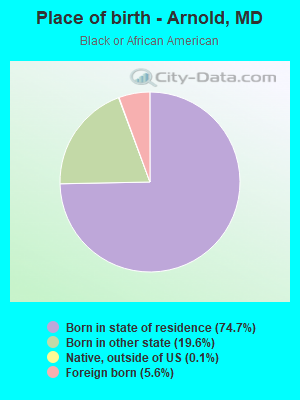
Place of birth - Born in state of residence (%) - Black or African American
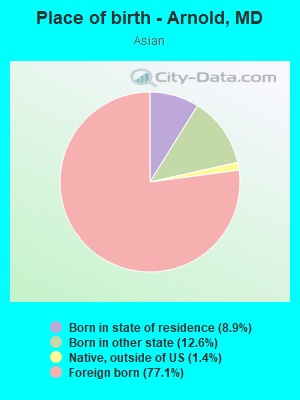
Place of birth - Born in state of residence (%) - Asian
Place of birth - Born in state of residence (%) - Hispanic or Latino
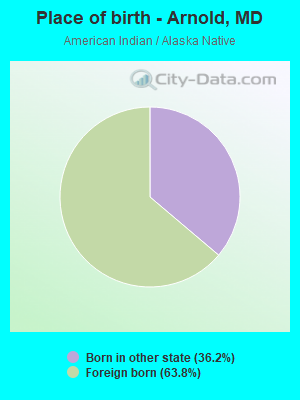
Place of birth - Born in state of residence (%) - American Indian and Alaska Native
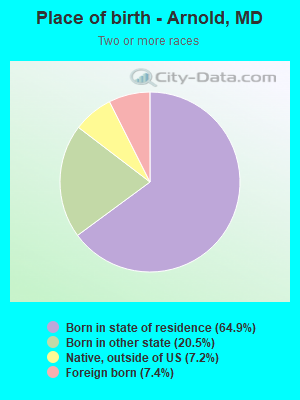
Place of birth - Born in state of residence (%) - Multirace
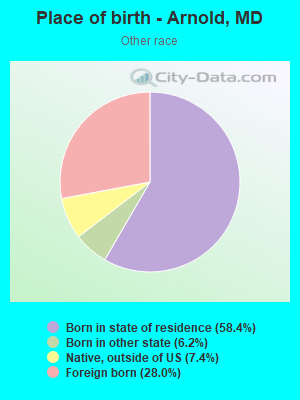
Place of birth - Born in state of residence (%) - Other Race
Place of birth - Born in other state (%)
Place of birth - Born in other state (%) - White
Place of birth - Born in other state (%) - Black or African American
Place of birth - Born in other state (%) - Asian
Place of birth - Born in other state (%) - Hispanic or Latino
Place of birth - Born in other state (%) - American Indian and Alaska Native
Place of birth - Born in other state (%) - Multirace
Place of birth - Born in other state (%) - Other Race
Place of birth - Native, outside of US (%)
Place of birth - Native, outside of US (%) - White
Place of birth - Native, outside of US (%) - Black or African American
Place of birth - Native, outside of US (%) - Asian
Place of birth - Native, outside of US (%) - Hispanic or Latino
Place of birth - Native, outside of US (%) - American Indian and Alaska Native
Place of birth - Native, outside of US (%) - Multirace
Place of birth - Native, outside of US (%) - Other Race
Place of birth - Foreign born (%)
Place of birth - Foreign born (%) - White
Place of birth - Foreign born (%) - Black or African American
Place of birth - Foreign born (%) - Asian
Place of birth - Foreign born (%) - Hispanic or Latino
Place of birth - Foreign born (%) - American Indian and Alaska Native
Place of birth - Foreign born (%) - Multirace
Place of birth - Foreign born (%) - Other Race
Residents speaking English at home (%)
Residents speaking English at home - Born in the United States (%)
Residents speaking English at home - Native, born elsewhere (%)
Residents speaking English at home - Foreign born (%)
Residents speaking Spanish at home (%)
Residents speaking Spanish at home - Born in the United States (%)
Residents speaking Spanish at home - Native, born elsewhere (%)
Residents speaking Spanish at home - Foreign born (%)
Residents speaking other language at home (%)
Residents speaking other language at home - Born in the United States (%)
Residents speaking other language at home - Native, born elsewhere (%)
Residents speaking other language at home - Foreign born (%)
Marital status - Never married (%)
Marital status - Now married (%)
Marital status - Separated (%)
Marital status - Widowed (%)
Marital status - Divorced (%)
Ancestries Reported - Arab (%)
Ancestries Reported - Czech (%)
Ancestries Reported - Danish (%)
Ancestries Reported - Dutch (%)
Ancestries Reported - English (%)
Ancestries Reported - French (%)
Ancestries Reported - French Canadian (%)
Ancestries Reported - German (%)
Ancestries Reported - Greek (%)
Ancestries Reported - Hungarian (%)
Ancestries Reported - Irish (%)
Ancestries Reported - Italian (%)
Ancestries Reported - Lithuanian (%)
Ancestries Reported - Norwegian (%)
Ancestries Reported - Polish (%)
Ancestries Reported - Portuguese (%)
Ancestries Reported - Russian (%)
Ancestries Reported - Scotch-Irish (%)
Ancestries Reported - Scottish (%)
Ancestries Reported - Slovak (%)
Ancestries Reported - Subsaharan African (%)
Ancestries Reported - Swedish (%)
Ancestries Reported - Swiss (%)
Ancestries Reported - Ukrainian (%)
Ancestries Reported - United States (%)
Ancestries Reported - Welsh (%)
Ancestries Reported - West Indian (%)
Ancestries Reported - Other (%)
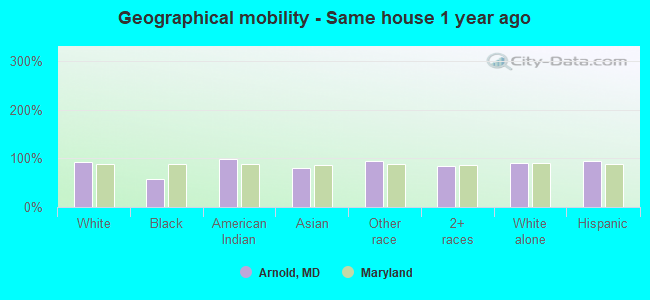
Geographical mobility - Same house 1 year ago (%)
Geographical mobility - Same house 1 year ago (%) - White
Geographical mobility - Same house 1 year ago (%) - Black or African American
Geographical mobility - Same house 1 year ago (%) - Asian
Geographical mobility - Same house 1 year ago (%) - Hispanic or Latino
Geographical mobility - Same house 1 year ago (%) - American Indian and Alaska Native
Geographical mobility - Same house 1 year ago (%) - Multirace
Geographical mobility - Same house 1 year ago (%) - Other Race
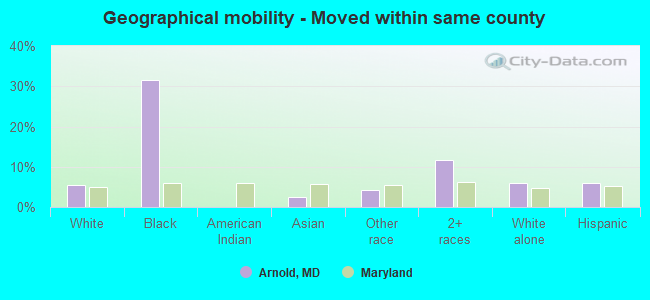
Geographical mobility - Moved within same county (%)
Geographical mobility - Moved within same county (%) - White
Geographical mobility - Moved within same county (%) - Black or African American
Geographical mobility - Moved within same county (%) - Asian
Geographical mobility - Moved within same county (%) - Hispanic or Latino
Geographical mobility - Moved within same county (%) - American Indian and Alaska Native
Geographical mobility - Moved within same county (%) - Multirace
Geographical mobility - Moved within same county (%) - Other Race
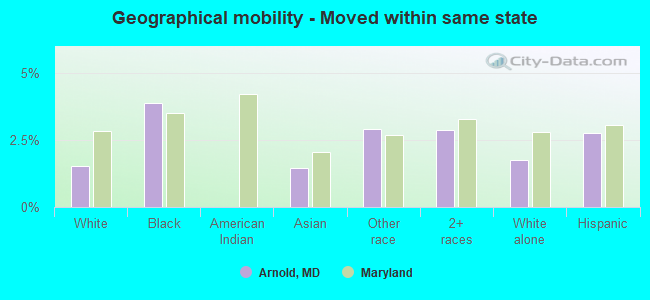
Geographical mobility - Moved from different county within same state (%)
Geographical mobility - Moved from different county within same state (%) - White
Geographical mobility - Moved from different county within same state (%) - Black or African American
Geographical mobility - Moved from different county within same state (%) - Asian
Geographical mobility - Moved from different county within same state (%) - Hispanic or Latino
Geographical mobility - Moved from different county within same state (%) - American Indian and Alaska Native
Geographical mobility - Moved from different county within same state (%) - Multirace
Geographical mobility - Moved from different county within same state (%) - Other Race
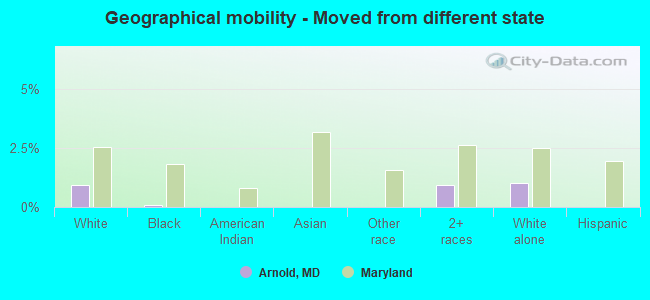
Geographical mobility - Moved from different state (%)
Geographical mobility - Moved from different state (%) - White
Geographical mobility - Moved from different state (%) - Black or African American
Geographical mobility - Moved from different state (%) - Asian
Geographical mobility - Moved from different state (%) - Hispanic or Latino
Geographical mobility - Moved from different state (%) - American Indian and Alaska Native
Geographical mobility - Moved from different state (%) - Multirace
Geographical mobility - Moved from different state (%) - Other Race
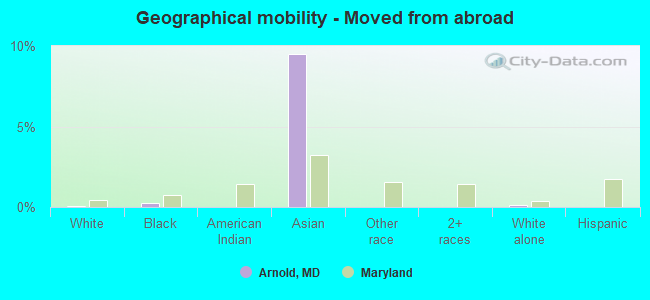
Geographical mobility - Moved from abroad (%)
Geographical mobility - Moved from abroad (%) - White
Geographical mobility - Moved from abroad (%) - Black or African American
Geographical mobility - Moved from abroad (%) - Asian
Geographical mobility - Moved from abroad (%) - Hispanic or Latino
Geographical mobility - Moved from abroad (%) - American Indian and Alaska Native
Geographical mobility - Moved from abroad (%) - Multirace
Geographical mobility - Moved from abroad (%) - Other Race
Place of birth for the foreign-born population - Ireland (%)
Place of birth for the foreign-born population - Denmark (%)
Place of birth for the foreign-born population - Norway (%)
Place of birth for the foreign-born population - Sweden (%)
Place of birth for the foreign-born population - United Kingdom (%)
Place of birth for the foreign-born population - England (%)
Place of birth for the foreign-born population - Scotland (%)
Place of birth for the foreign-born population - Other Northern Europe (%)
Place of birth for the foreign-born population - Austria (%)
Place of birth for the foreign-born population - Belgium (%)
Place of birth for the foreign-born population - France (%)
Place of birth for the foreign-born population - Germany (%)
Place of birth for the foreign-born population - Netherlands (%)
Place of birth for the foreign-born population - Switzerland (%)
Place of birth for the foreign-born population - Other Western Europe (%)
Place of birth for the foreign-born population - Greece (%)
Place of birth for the foreign-born population - Italy (%)
Place of birth for the foreign-born population - Portugal (%)
Place of birth for the foreign-born population - Spain (%)
Place of birth for the foreign-born population - Other Southern Europe (%)
Place of birth for the foreign-born population - Albania (%)
Place of birth for the foreign-born population - Belarus (%)
Place of birth for the foreign-born population - Bosnia and Herzegovina (%)
Place of birth for the foreign-born population - Bulgaria (%)
Place of birth for the foreign-born population - Croatia (%)
Place of birth for the foreign-born population - Czechoslovakia (%)
Place of birth for the foreign-born population - Hungary (%)
Place of birth for the foreign-born population - Latvia (%)
Place of birth for the foreign-born population - Lithuania (%)
Place of birth for the foreign-born population - North Macedonia (Macedonia) (%)
Place of birth for the foreign-born population - Moldova (%)
Place of birth for the foreign-born population - Poland (%)
Place of birth for the foreign-born population - Romania (%)
Place of birth for the foreign-born population - Russia (%)
Place of birth for the foreign-born population - Serbia (%)
Place of birth for the foreign-born population - Ukraine (%)
Place of birth for the foreign-born population - Other Eastern Europe (%)
Place of birth for the foreign-born population - China (%)
Place of birth for the foreign-born population - Hong Kong (%)
Place of birth for the foreign-born population - Taiwan (%)
Place of birth for the foreign-born population - Japan (%)
Place of birth for the foreign-born population - Korea (%)
Place of birth for the foreign-born population - Other Eastern Asia (%)
Place of birth for the foreign-born population - Afghanistan (%)
Place of birth for the foreign-born population - Bangladesh (%)
Place of birth for the foreign-born population - India (%)
Place of birth for the foreign-born population - Iran (%)
Place of birth for the foreign-born population - Kazakhstan (%)
Place of birth for the foreign-born population - Nepal (%)
Place of birth for the foreign-born population - Pakistan (%)
Place of birth for the foreign-born population - Sri Lanka (%)
Place of birth for the foreign-born population - Uzbekistan (%)
Place of birth for the foreign-born population - Other South Central Asia (%)
Place of birth for the foreign-born population - Burma (%)
Place of birth for the foreign-born population - Cambodia (%)
Place of birth for the foreign-born population - Indonesia (%)
Place of birth for the foreign-born population - Laos (%)
Place of birth for the foreign-born population - Malaysia (%)
Place of birth for the foreign-born population - Philippines (%)
Place of birth for the foreign-born population - Singapore (%)
Place of birth for the foreign-born population - Thailand (%)
Place of birth for the foreign-born population - Vietnam (%)
Place of birth for the foreign-born population - Other South Eastern Asia (%)
Place of birth for the foreign-born population - Armenia (%)
Place of birth for the foreign-born population - Iraq (%)
Place of birth for the foreign-born population - Israel (%)
Place of birth for the foreign-born population - Jordan (%)
Place of birth for the foreign-born population - Kuwait (%)
Place of birth for the foreign-born population - Lebanon (%)
Place of birth for the foreign-born population - Saudi Arabia (%)
Place of birth for the foreign-born population - Syria (%)
Place of birth for the foreign-born population - Turkey (%)
Place of birth for the foreign-born population - Yemen (%)
Place of birth for the foreign-born population - Other Western Asia (%)
Place of birth for the foreign-born population - Eritrea (%)
Place of birth for the foreign-born population - Ethiopia (%)
Place of birth for the foreign-born population - Kenya (%)
Place of birth for the foreign-born population - Somalia (%)
Place of birth for the foreign-born population - Uganda (%)
Place of birth for the foreign-born population - Zimbabwe (%)
Place of birth for the foreign-born population - Other Eastern Africa (%)
Place of birth for the foreign-born population - Cameroon (%)
Place of birth for the foreign-born population - Congo (%)
Place of birth for the foreign-born population - Democratic Republic of Congo (Zaire) (%)
Place of birth for the foreign-born population - Other Middle Africa (%)
Place of birth for the foreign-born population - Egypt (%)
Place of birth for the foreign-born population - Morocco (%)
Place of birth for the foreign-born population - Sudan (%)
Place of birth for the foreign-born population - Other Northern Africa (%)
Place of birth for the foreign-born population - South Africa (%)
Place of birth for the foreign-born population - Other Southern Africa (%)
Place of birth for the foreign-born population - Cabo Verde (%)
Place of birth for the foreign-born population - Ghana (%)
Place of birth for the foreign-born population - Liberia (%)
Place of birth for the foreign-born population - Nigeria (%)
Place of birth for the foreign-born population - Senegal (%)
Place of birth for the foreign-born population - Sierra Leone (%)
Place of birth for the foreign-born population - Other Western Africa (%)
Place of birth for the foreign-born population - Australia (%)
Place of birth for the foreign-born population - New Zealand (%)
Place of birth for the foreign-born population - Fiji (%)
Place of birth for the foreign-born population - Micronesia (%)
Place of birth for the foreign-born population - Bahamas (%)
Place of birth for the foreign-born population - Barbados (%)
Place of birth for the foreign-born population - Cuba (%)
Place of birth for the foreign-born population - Dominica (%)
Place of birth for the foreign-born population - Dominican Republic (%)
Place of birth for the foreign-born population - Grenada (%)
Place of birth for the foreign-born population - Haiti (%)
Place of birth for the foreign-born population - Jamaica (%)
Place of birth for the foreign-born population - St. Vincent and the Grenadines (%)
Place of birth for the foreign-born population - Trinidad and Tobago (%)
Place of birth for the foreign-born population - West Indies (%)
Place of birth for the foreign-born population - Other Caribbean (%)
Place of birth for the foreign-born population - Belize (%)
Place of birth for the foreign-born population - Costa Rica (%)
Place of birth for the foreign-born population - El Salvador (%)
Place of birth for the foreign-born population - Guatemala (%)
Place of birth for the foreign-born population - Honduras (%)
Place of birth for the foreign-born population - Mexico (%)
Place of birth for the foreign-born population - Nicaragua (%)
Place of birth for the foreign-born population - Panama (%)
Place of birth for the foreign-born population - Other Central America (%)
Place of birth for the foreign-born population - Argentina (%)
Place of birth for the foreign-born population - Bolivia (%)
Place of birth for the foreign-born population - Brazil (%)
Place of birth for the foreign-born population - Chile (%)
Place of birth for the foreign-born population - Colombia (%)
Place of birth for the foreign-born population - Ecuador (%)
Place of birth for the foreign-born population - Guyana (%)
Place of birth for the foreign-born population - Peru (%)
Place of birth for the foreign-born population - Uruguay (%)
Place of birth for the foreign-born population - Venezuela (%)
Place of birth for the foreign-born population - Other South America (%)
Place of birth for the foreign-born population - Canada (%)
Place of birth for the foreign-born population - Other Northern America (%)
Place of birth for the foreign-born population - Other (%)
Latest news about races in Arnold, MD collected exclusively by city-data.com from local newspapers, TV, and radio stations
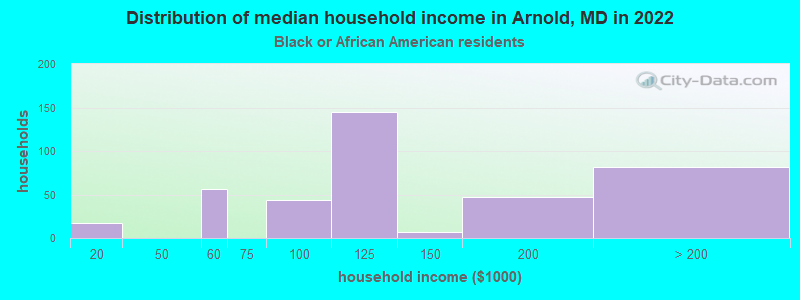
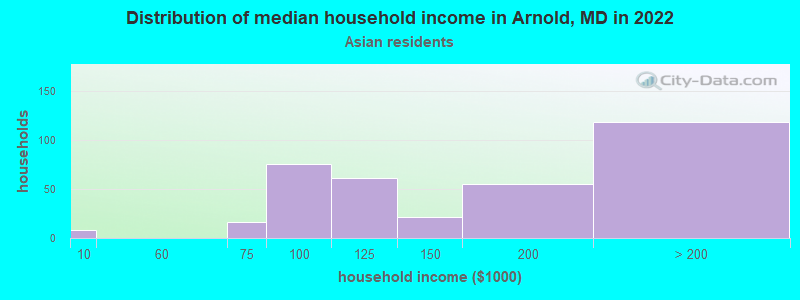
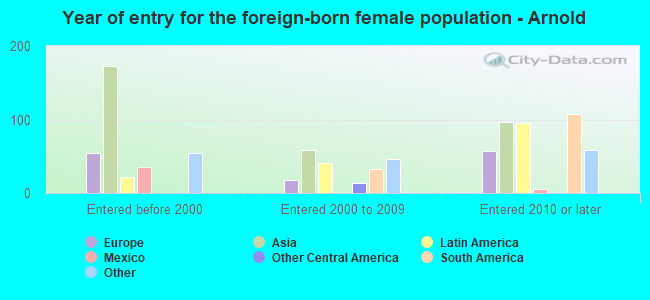
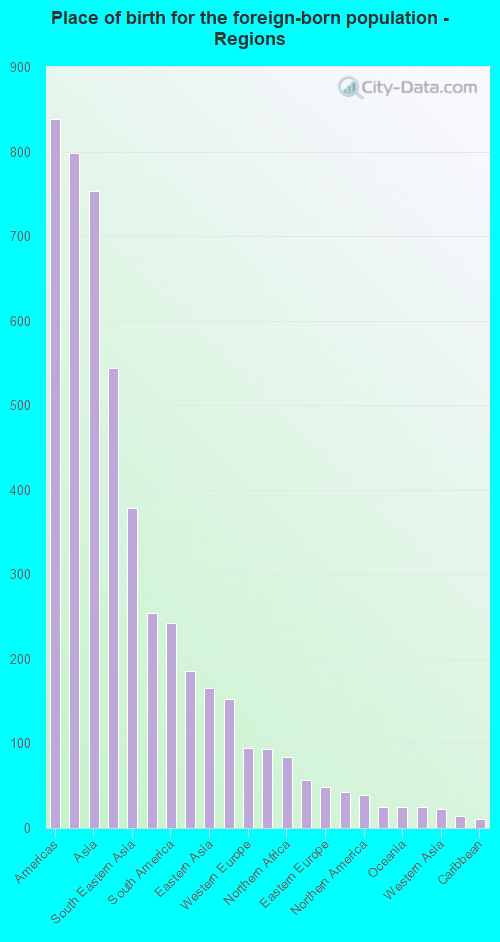
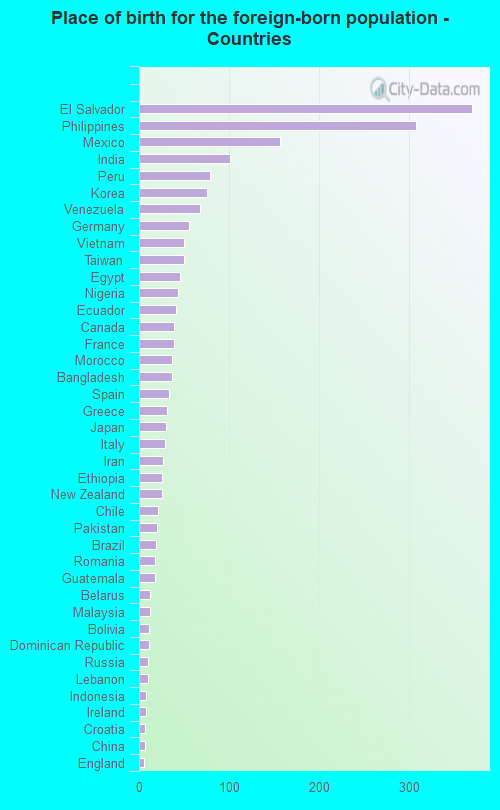
According to 2022 data, the most numerous races in Arnold, MD are White alone (18,229 residents), Black alone (1,394 residents), and Hispanic (2,599 residents). 88.6% of Arnold residents speak English at home. 8.1% of Arnold, MD residents are foreign-born (3.0% born in Latin America, 2.8% born in Asia, 1.0% born in Europe), which is 97.8% less than the foreign-born rate of 16.0% across the entire state of Maryland.
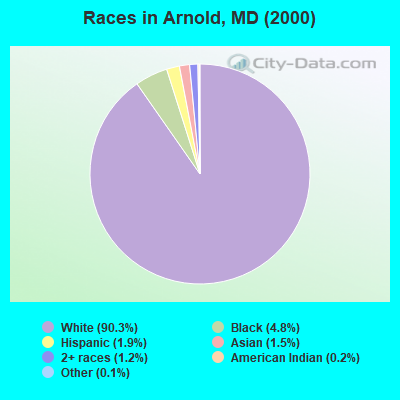
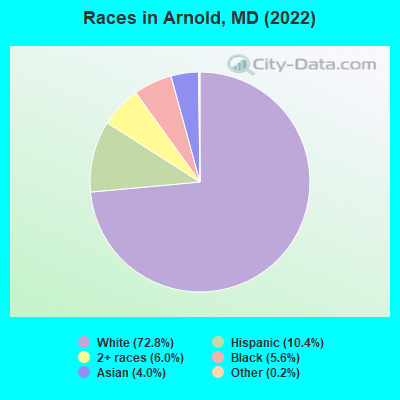
Race distribution in Arnold
2000 2022
3,286,547 62.1% White alone 1,464,735 27.7% Black alone 227,916 4.3% Hispanic 209,738 4.0% Asian alone 82,946 1.6% Two or more races 13,312 0.3% American Indian alone 9,379 0.2% Other race alone 1,913 0.04% Native Hawaiian and Other
2,906,492 47.1% White alone 1,800,914 29.2% Black alone 705,842 11.4% Hispanic 401,818 6.5% Asian alone 291,317 4.7% Two or more races 46,930 0.8% Other race alone 8,930 0.1% American Indian alone 2,417 0.04% Native Hawaiian and Other
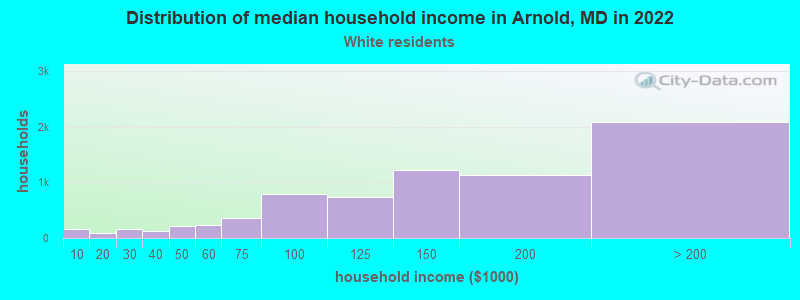
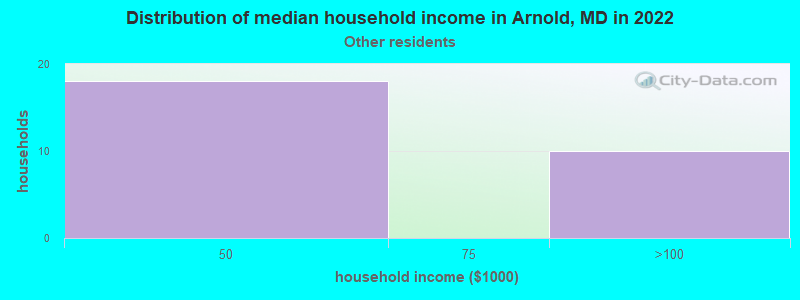
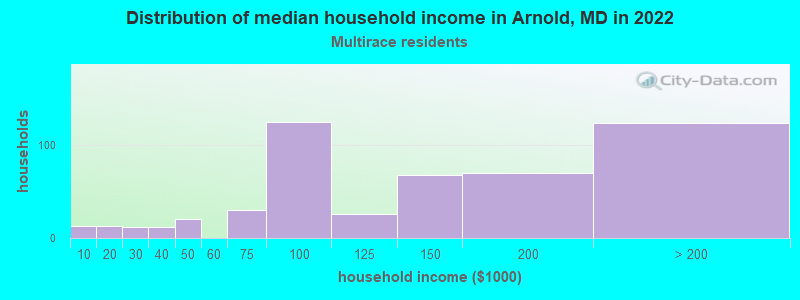
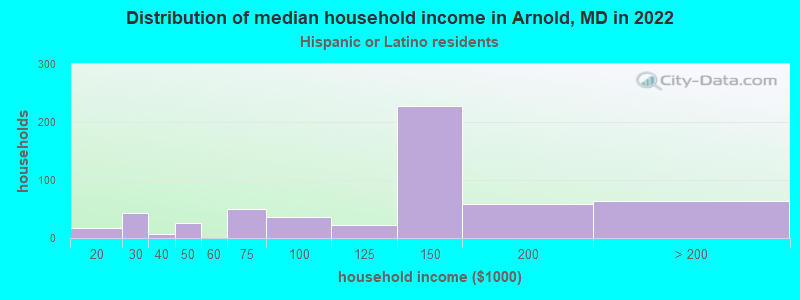
Income and house value in Arnold Median household income in 2022 $144,614 White non-Hispanic householders$99,157 Black householders$158,919 Asian householders$129,763 Two or more races householders$126,745 Hispanic or Latino race householdersMedian 2022 house value $554,435 White Non-Hispanic householders$377,386 Black or African American householders$410,526 American Indian or Alaska Native householders $501,290 Asian householders$634,450 Some other race householders$370,220 Two or more races householders$493,826 Hispanic or Latino householders
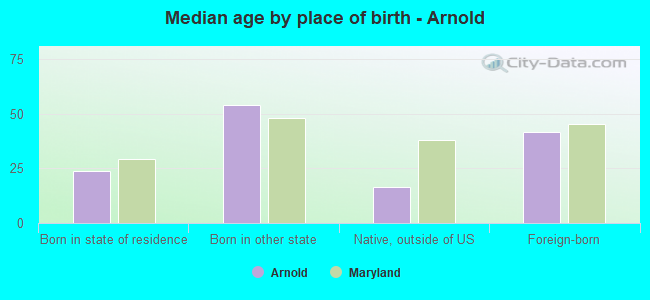
Median age by race in Arnold
40.8 Median age for White residents39.9 41.3 33.6 Median age for Black or African American residents33.3 33.9 68.3 Median age for American Indian / Alaska Native residents-674,418,604.0 -1,072,276,158.6 52.8 Median age for Asian residents57.0 49.6 -534,101,824.6 Median age for Native Hawaiian / Pacific Islander residents-720,061,021.4 -760,942,760.2 19.1 Median age for Other race residents16.8 20.3 19.5 Median age for Two or more races residents20.4 18.0 41.6 Median age for White alone residents40.8 42.0 36.6 Median age for Hispanic or Latino residents37.0 26.2
Owner/renter occupied households by race in Arnold
House owners and renters - White residents 6,488 88.5% Owner occupied846 11.5% Renter occupiedHouse owners and renters - Black or African American residents 220 56.4% Owner occupied170 43.6% Renter occupiedHouse owners and renters - American Indian / Alaska Native residents 8 100.0% Renter occupiedHouse owners and renters - Asian residents 344 87.3% Owner occupied50 12.7% Renter occupiedHouse owners and renters - Other race residents 30 87.1% Owner occupied4 12.9% Renter occupiedHouse owners and renters - Two or more races residents 376 68.8% Owner occupied170 31.2% Renter occupiedHouse owners and renters - White alone residents 6,262 88.6% Owner occupied806 11.4% Renter occupiedHouse owners and renters - Hispanic or Latino residents 457 77.9% Owner occupied130 22.1% Renter occupied
Language usage in Arnold
English speakers - Total 88.6% of residents of Arnold speak English at home.
5.3% of residents speak Spanish at home 1,019 81.7% Speak English very well229 18.3% Speak English less than very well5.8% of residents speak other language at home 1,115 80.7% Speak English very well267 19.3% Speak English less than very well
English speakers - Born in the United States 97.3% of residents of Arnold speak English at home.
0.8% of residents speak Spanish at home 60 85.7% Speak English very well10 14.3% Speak English less than very well2.1% of residents speak other language at home 163 86.7% Speak English very well25 13.3% Speak English less than very well
English speakers - Native, born elsewhere 64.9% of residents of Arnold speak English at home.
21.4% of residents speak Spanish at home 115 85.8% Speak English very well19 14.2% Speak English less than very well11.7% of residents speak other language at home 73 100.0% Speak English very well
English speakers - Foreign-born 13.2% of residents of Arnold speak English at home.
33.8% of residents speak Spanish at home 470 70.9% Speak English very well193 29.1% Speak English less than very well49.8% of residents speak other language at home 765 78.1% Speak English very well214 21.9% Speak English less than very well
White (Caucasian) - Speak only English Native:
98.5% (17,593)Foreign-born:
16.4% (77)
White (Caucasian) - Speak another language Native:
1.8% (316)Foreign-born:
76.3% (360)
Black or African American - Speak only English Native:
89.8% (1,093)Foreign-born:
33.0% (25)
Black or African American - Speak another language Native:
11.4% (139)Foreign-born:
68.1% (52)
American Indian / Alaska Native - Speak another language Native:
100.0% (15)Foreign-born:
100.0% (35)
Asian - Speak only English Native:
83.6% (169)Foreign-born:
13.2% (103)
Asian - Speak another language Native:
12.7% (26)Foreign-born:
86.7% (678)
Other race - Speak only English Native:
47.6% (82)Foreign-born:
17.0% (13)
Other race - Speak another language Native:
51.2% (88)Foreign-born:
69.9% (52)
Two or more races - Speak only English Native:
81.4% (1,752)Foreign-born:
26.4% (54)
Two or more races - Speak another language Native:
17.9% (384)Foreign-born:
73.7% (150)
White alone - Speak only English Native:
98.7% (17,024)Foreign-born:
27.4% (61)
White alone - Speak another language Native:
1.4% (234)Foreign-born:
72.6% (161)
Hispanic or Latino - Speak only English Native:
77.5% (1,301)Foreign-born:
5.5% (44)
Hispanic or Latino - Speak another language Native:
23.5% (394)Foreign-born:
95.9% (777)
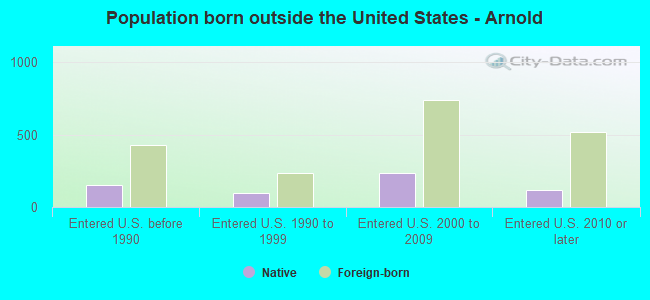
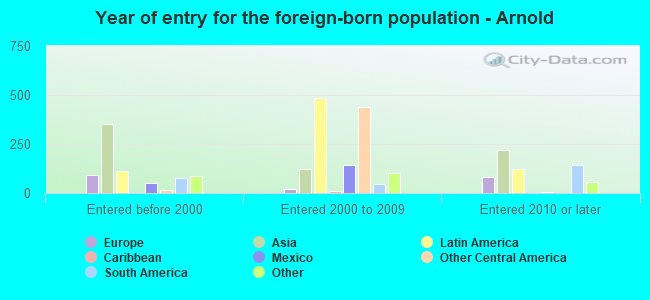
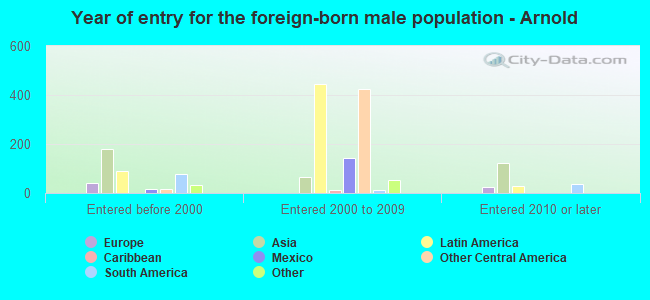
Foreign-born residents in Arnold 2,026 residents are foreign born (3.0% Latin America , 2.8% Asia , 1.0% Europe ).
This city:
8.1%Maryland:
15.7%
Marital status for residents in Arnold Marital status - White (Caucasian) population 15 years and over
Males 26.0% Never married63.7% Now married2.9% Separated1.4% Widowed6.1% DivorcedFemales 22.3% Never married60.2% Now married1.5% Separated4.9% Widowed11.1% DivorcedWomen who gave birth in the past 12 months Now married:
100.0% (137)Unmarried:
0.0% (0)
Women who did not give birth in the past 12 months Now married:
57.1% (2,447)Unmarried:
42.9% (1,842)
Marital status - Black or African American population 15 years and over
Males 43.2% Never married49.1% Now married5.1% Separated2.6% Widowed0.0% DivorcedFemales 50.2% Never married30.4% Now married1.3% Separated9.1% Widowed8.9% DivorcedWomen who did not give birth in the past 12 months Now married:
29.0% (75)Unmarried:
71.0% (184)
Marital status - American Indian / Alaska Native population 15 years and over
Males 35.3% Never married64.7% Now married0.0% Separated0.0% Widowed0.0% DivorcedFemales 40.0% Never married60.0% Now married0.0% Separated0.0% Widowed0.0% DivorcedWomen who did not give birth in the past 12 months Now married:
0.0% (0)Unmarried:
100.0% (9)
Marital status - Asian population 15 years and over
Males 12.2% Never married79.2% Now married0.0% Separated0.0% Widowed8.6% DivorcedFemales 18.6% Never married71.2% Now married0.0% Separated1.6% Widowed8.6% DivorcedWomen who did not give birth in the past 12 months Now married:
66.8% (143)Unmarried:
33.2% (71)
Marital status - Other race population 15 years and over
Males 48.4% Never married51.6% Now married0.0% Separated0.0% Widowed0.0% DivorcedFemales 66.2% Never married33.8% Now married0.0% Separated0.0% Widowed0.0% DivorcedWomen who did not give birth in the past 12 months Now married:
33.8% (26)Unmarried:
66.2% (51)
Marital status - Two or more races population 15 years and over
Males 51.2% Never married41.1% Now married0.0% Separated4.5% Widowed3.2% DivorcedFemales 41.5% Never married39.7% Now married4.4% Separated3.0% Widowed11.4% DivorcedWomen who gave birth in the past 12 months Now married:
100.0% (26)Unmarried:
0.0% (0)
Women who did not give birth in the past 12 months Now married:
43.0% (318)Unmarried:
57.0% (421)
Marital status - White alone, not Hispanic / Latino population 15 years and over
Males 27.4% Never married61.4% Now married3.2% Separated1.5% Widowed6.5% DivorcedFemales 21.6% Never married61.0% Now married1.6% Separated4.8% Widowed11.0% DivorcedWomen who gave birth in the past 12 months Now married:
100.0% (141)Unmarried:
0.0% (0)
Women who did not give birth in the past 12 months Now married:
57.1% (2,258)Unmarried:
42.9% (1,696)
Marital status - Hispanic or Latino population 15 years and over
Males 17.0% Never married80.3% Now married0.0% Separated2.7% Widowed0.0% DivorcedFemales 30.9% Never married51.2% Now married1.5% Separated5.4% Widowed11.0% DivorcedWomen who gave birth in the past 12 months Now married:
100.0% (13)Unmarried:
0.0% (0)
Women who did not give birth in the past 12 months Now married:
57.1% (417)Unmarried:
42.9% (313)
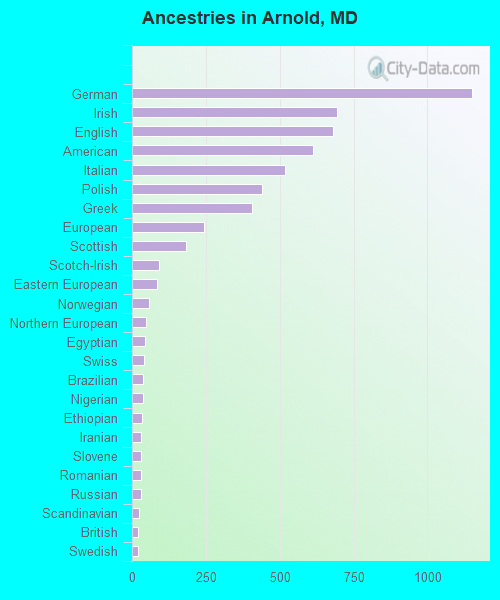
Ancestries in Arnold
1,151 13.4% German694 8.1% Irish682 7.9% English613 7.1% American519 6.0% Italian439 5.1% Polish405 4.7% Greek245 2.9% European182 2.1% Scottish91 1.1% Scotch-Irish84 1.0% Eastern European59 0.7% Norwegian49 0.6% Northern European44 0.5% Egyptian41 0.5% Swiss36 0.4% Brazilian36 0.4% Nigerian33 0.4% Ethiopian31 0.4% Iranian31 0.4% Slovene29 0.3% Romanian29 0.3% Russian25 0.3% Scandinavian22 0.3% British22 0.3% Swedish21 0.2% Portuguese21 0.2% Canadian18 0.2% French18 0.2% Czech18 0.2% Hungarian17 0.2% Moroccan16 0.2% Dutch14 0.2% Syrian13 0.2% Cypriot13 0.2% Palestinian13 0.2% Welsh12 0.1% Lebanese10 0.1% Lithuanian9 0.1% Turkish9 0.1% South African8 0.09% French Canadian8 0.09% Ukrainian7 0.08% Slovak5 0.06% Croatian5 0.06% Danish
Geographical mobility in Arnold Same house 1 year ago 17,674 92.0% White (Caucasian)811 57.9% Black or African American46 98.9% American Indian / Alaska Native810 79.6% Asian256 94.3% Other race2,234 83.6% Two or more races16,563 91.3% White alone, not Hispanic / Latino2,438 94.1% Hispanic or LatinoMoved within same county 1,068 5.6% White / Caucasian441 31.4% Black or African American26 2.6% Asian12 4.3% Other race310 11.6% Two or more races1,066 5.9% White alone, not Hispanic / Latino153 5.9% Hispanic or LatinoMoved within same state 296 1.5% White / Caucasian54 3.9% Black or African American15 1.4% Asian8 2.9% Other race77 2.9% Two or more races321 1.8% White alone, not Hispanic / Latino71 2.7% Hispanic or LatinoMoved from different state 178 0.9% White / Caucasian1 0.1% Black or African American25 1.0% Two or more races181 1.0% White alone, not Hispanic / LatinoMoved from abroad 16 0.1% White3 0.2% Black or African American97 9.5% Asian17 0.1% White alone, not Hispanic / Latino
Children Nativity (place of birth) in Arnold
Children under 6 years - Living with two parents Both parents native 1,271 100.0% NativeBoth parents foreign-born 51 100.0% NativeOne native, one foreign-born parent 133 100.0% NativeChildren under 6 years - Living with one parent Native parent 217 100.0% NativeForeign-born parent 19 100.0% NativeChildren 6 to 17 years - Living with two parents Both parents native 2,989 99.4% Native17 0.6% Foreign-bornBoth parents foreign-born 229 77.6% Native66 22.4% Foreign-bornOne native, one foreign-born parent 324 100.0% NativeChildren 6 to 17 years - Living with one parent Native parent 1,040 98.8% Native13 1.2% Foreign-bornForeign-born parent 20 79.1% Native5 20.9% Foreign-born
Grandparents responsible for own grandchildren in Arnold
Grandparents (30 to 59 years) White / Caucasian 26 100.0% Not responsible for grandchildrenBlack or African American 9 100.0% Responsible for grandchildrenWhite alone, not Hispanic / Latino 27 100.0% Not responsible for grandchildrenGrandparents (60 years and over) White / Caucasian 29 14.3% Responsible for grandchildren173 85.7% Not responsible for grandchildrenBlack or African American 8 23.3% Responsible for grandchildren26 76.7% Not responsible for grandchildrenWhite alone, not Hispanic / Latino 30 16.5% Responsible for grandchildren151 83.5% Not responsible for grandchildren