Races in Boerne, Texas (TX) Detailed Stats
Data:
Races - White alone (%)
Races - White alone (% change since 2000)
Races - Black alone (%)
Races - Black alone (% change since 2000)
Races - American Indian alone (%)
Races - American Indian alone (% change since 2000)
Races - Asian alone (%)
Races - Asian alone (% change since 2000)
Races - Hispanic (%)
Races - Hispanic (% change since 2000)
Races - Native Hawaiian and Other Pacific Islander alone (%)
Races - Native Hawaiian and Other Pacific Islander alone (% change since 2000)
Races - Two or more races(%)
Races - Two or more races(% change since 2000)
Races - Other race alone (%)
Races - Other race alone (% change since 2000)
Racial diversity
Place of birth - Born in state of residence (%)
Place of birth - Born in state of residence (%) - White
Place of birth - Born in state of residence (%) - Black or African American
Place of birth - Born in state of residence (%) - Asian
Place of birth - Born in state of residence (%) - Hispanic or Latino
Place of birth - Born in state of residence (%) - American Indian and Alaska Native
Place of birth - Born in state of residence (%) - Multirace
Place of birth - Born in state of residence (%) - Other Race
Place of birth - Born in other state (%)
Place of birth - Born in other state (%) - White
Place of birth - Born in other state (%) - Black or African American
Place of birth - Born in other state (%) - Asian
Place of birth - Born in other state (%) - Hispanic or Latino
Place of birth - Born in other state (%) - American Indian and Alaska Native
Place of birth - Born in other state (%) - Multirace
Place of birth - Born in other state (%) - Other Race
Place of birth - Native, outside of US (%)
Place of birth - Native, outside of US (%) - White
Place of birth - Native, outside of US (%) - Black or African American
Place of birth - Native, outside of US (%) - Asian
Place of birth - Native, outside of US (%) - Hispanic or Latino
Place of birth - Native, outside of US (%) - American Indian and Alaska Native
Place of birth - Native, outside of US (%) - Multirace
Place of birth - Native, outside of US (%) - Other Race
Place of birth - Foreign born (%)
Place of birth - Foreign born (%) - White
Place of birth - Foreign born (%) - Black or African American
Place of birth - Foreign born (%) - Asian
Place of birth - Foreign born (%) - Hispanic or Latino
Place of birth - Foreign born (%) - American Indian and Alaska Native
Place of birth - Foreign born (%) - Multirace
Place of birth - Foreign born (%) - Other Race
Residents speaking English at home (%)
Residents speaking English at home - Born in the United States (%)
Residents speaking English at home - Native, born elsewhere (%)
Residents speaking English at home - Foreign born (%)
Residents speaking Spanish at home (%)
Residents speaking Spanish at home - Born in the United States (%)
Residents speaking Spanish at home - Native, born elsewhere (%)
Residents speaking Spanish at home - Foreign born (%)
Residents speaking other language at home (%)
Residents speaking other language at home - Born in the United States (%)
Residents speaking other language at home - Native, born elsewhere (%)
Residents speaking other language at home - Foreign born (%)
Marital status - Never married (%)
Marital status - Now married (%)
Marital status - Separated (%)
Marital status - Widowed (%)
Marital status - Divorced (%)
Ancestries Reported - Arab (%)
Ancestries Reported - Czech (%)
Ancestries Reported - Danish (%)
Ancestries Reported - Dutch (%)
Ancestries Reported - English (%)
Ancestries Reported - French (%)
Ancestries Reported - French Canadian (%)
Ancestries Reported - German (%)
Ancestries Reported - Greek (%)
Ancestries Reported - Hungarian (%)
Ancestries Reported - Irish (%)
Ancestries Reported - Italian (%)
Ancestries Reported - Lithuanian (%)
Ancestries Reported - Norwegian (%)
Ancestries Reported - Polish (%)
Ancestries Reported - Portuguese (%)
Ancestries Reported - Russian (%)
Ancestries Reported - Scotch-Irish (%)
Ancestries Reported - Scottish (%)
Ancestries Reported - Slovak (%)
Ancestries Reported - Subsaharan African (%)
Ancestries Reported - Swedish (%)
Ancestries Reported - Swiss (%)
Ancestries Reported - Ukrainian (%)
Ancestries Reported - United States (%)
Ancestries Reported - Welsh (%)
Ancestries Reported - West Indian (%)
Ancestries Reported - Other (%)
Geographical mobility - Same house 1 year ago (%)
Geographical mobility - Same house 1 year ago (%) - White
Geographical mobility - Same house 1 year ago (%) - Black or African American
Geographical mobility - Same house 1 year ago (%) - Asian
Geographical mobility - Same house 1 year ago (%) - Hispanic or Latino
Geographical mobility - Same house 1 year ago (%) - American Indian and Alaska Native
Geographical mobility - Same house 1 year ago (%) - Multirace
Geographical mobility - Same house 1 year ago (%) - Other Race
Geographical mobility - Moved within same county (%)
Geographical mobility - Moved within same county (%) - White
Geographical mobility - Moved within same county (%) - Black or African American
Geographical mobility - Moved within same county (%) - Asian
Geographical mobility - Moved within same county (%) - Hispanic or Latino
Geographical mobility - Moved within same county (%) - American Indian and Alaska Native
Geographical mobility - Moved within same county (%) - Multirace
Geographical mobility - Moved within same county (%) - Other Race
Geographical mobility - Moved from different county within same state (%)
Geographical mobility - Moved from different county within same state (%) - White
Geographical mobility - Moved from different county within same state (%) - Black or African American
Geographical mobility - Moved from different county within same state (%) - Asian
Geographical mobility - Moved from different county within same state (%) - Hispanic or Latino
Geographical mobility - Moved from different county within same state (%) - American Indian and Alaska Native
Geographical mobility - Moved from different county within same state (%) - Multirace
Geographical mobility - Moved from different county within same state (%) - Other Race
Geographical mobility - Moved from different state (%)
Geographical mobility - Moved from different state (%) - White
Geographical mobility - Moved from different state (%) - Black or African American
Geographical mobility - Moved from different state (%) - Asian
Geographical mobility - Moved from different state (%) - Hispanic or Latino
Geographical mobility - Moved from different state (%) - American Indian and Alaska Native
Geographical mobility - Moved from different state (%) - Multirace
Geographical mobility - Moved from different state (%) - Other Race
Geographical mobility - Moved from abroad (%)
Geographical mobility - Moved from abroad (%) - White
Geographical mobility - Moved from abroad (%) - Black or African American
Geographical mobility - Moved from abroad (%) - Asian
Geographical mobility - Moved from abroad (%) - Hispanic or Latino
Geographical mobility - Moved from abroad (%) - American Indian and Alaska Native
Geographical mobility - Moved from abroad (%) - Multirace
Geographical mobility - Moved from abroad (%) - Other Race
Place of birth for the foreign-born population - Ireland (%)
Place of birth for the foreign-born population - Denmark (%)
Place of birth for the foreign-born population - Norway (%)
Place of birth for the foreign-born population - Sweden (%)
Place of birth for the foreign-born population - United Kingdom (%)
Place of birth for the foreign-born population - England (%)
Place of birth for the foreign-born population - Scotland (%)
Place of birth for the foreign-born population - Other Northern Europe (%)
Place of birth for the foreign-born population - Austria (%)
Place of birth for the foreign-born population - Belgium (%)
Place of birth for the foreign-born population - France (%)
Place of birth for the foreign-born population - Germany (%)
Place of birth for the foreign-born population - Netherlands (%)
Place of birth for the foreign-born population - Switzerland (%)
Place of birth for the foreign-born population - Other Western Europe (%)
Place of birth for the foreign-born population - Greece (%)
Place of birth for the foreign-born population - Italy (%)
Place of birth for the foreign-born population - Portugal (%)
Place of birth for the foreign-born population - Spain (%)
Place of birth for the foreign-born population - Other Southern Europe (%)
Place of birth for the foreign-born population - Albania (%)
Place of birth for the foreign-born population - Belarus (%)
Place of birth for the foreign-born population - Bosnia and Herzegovina (%)
Place of birth for the foreign-born population - Bulgaria (%)
Place of birth for the foreign-born population - Croatia (%)
Place of birth for the foreign-born population - Czechoslovakia (%)
Place of birth for the foreign-born population - Hungary (%)
Place of birth for the foreign-born population - Latvia (%)
Place of birth for the foreign-born population - Lithuania (%)
Place of birth for the foreign-born population - North Macedonia (Macedonia) (%)
Place of birth for the foreign-born population - Moldova (%)
Place of birth for the foreign-born population - Poland (%)
Place of birth for the foreign-born population - Romania (%)
Place of birth for the foreign-born population - Russia (%)
Place of birth for the foreign-born population - Serbia (%)
Place of birth for the foreign-born population - Ukraine (%)
Place of birth for the foreign-born population - Other Eastern Europe (%)
Place of birth for the foreign-born population - China (%)
Place of birth for the foreign-born population - Hong Kong (%)
Place of birth for the foreign-born population - Taiwan (%)
Place of birth for the foreign-born population - Japan (%)
Place of birth for the foreign-born population - Korea (%)
Place of birth for the foreign-born population - Other Eastern Asia (%)
Place of birth for the foreign-born population - Afghanistan (%)
Place of birth for the foreign-born population - Bangladesh (%)
Place of birth for the foreign-born population - India (%)
Place of birth for the foreign-born population - Iran (%)
Place of birth for the foreign-born population - Kazakhstan (%)
Place of birth for the foreign-born population - Nepal (%)
Place of birth for the foreign-born population - Pakistan (%)
Place of birth for the foreign-born population - Sri Lanka (%)
Place of birth for the foreign-born population - Uzbekistan (%)
Place of birth for the foreign-born population - Other South Central Asia (%)
Place of birth for the foreign-born population - Burma (%)
Place of birth for the foreign-born population - Cambodia (%)
Place of birth for the foreign-born population - Indonesia (%)
Place of birth for the foreign-born population - Laos (%)
Place of birth for the foreign-born population - Malaysia (%)
Place of birth for the foreign-born population - Philippines (%)
Place of birth for the foreign-born population - Singapore (%)
Place of birth for the foreign-born population - Thailand (%)
Place of birth for the foreign-born population - Vietnam (%)
Place of birth for the foreign-born population - Other South Eastern Asia (%)
Place of birth for the foreign-born population - Armenia (%)
Place of birth for the foreign-born population - Iraq (%)
Place of birth for the foreign-born population - Israel (%)
Place of birth for the foreign-born population - Jordan (%)
Place of birth for the foreign-born population - Kuwait (%)
Place of birth for the foreign-born population - Lebanon (%)
Place of birth for the foreign-born population - Saudi Arabia (%)
Place of birth for the foreign-born population - Syria (%)
Place of birth for the foreign-born population - Turkey (%)
Place of birth for the foreign-born population - Yemen (%)
Place of birth for the foreign-born population - Other Western Asia (%)
Place of birth for the foreign-born population - Eritrea (%)
Place of birth for the foreign-born population - Ethiopia (%)
Place of birth for the foreign-born population - Kenya (%)
Place of birth for the foreign-born population - Somalia (%)
Place of birth for the foreign-born population - Uganda (%)
Place of birth for the foreign-born population - Zimbabwe (%)
Place of birth for the foreign-born population - Other Eastern Africa (%)
Place of birth for the foreign-born population - Cameroon (%)
Place of birth for the foreign-born population - Congo (%)
Place of birth for the foreign-born population - Democratic Republic of Congo (Zaire) (%)
Place of birth for the foreign-born population - Other Middle Africa (%)
Place of birth for the foreign-born population - Egypt (%)
Place of birth for the foreign-born population - Morocco (%)
Place of birth for the foreign-born population - Sudan (%)
Place of birth for the foreign-born population - Other Northern Africa (%)
Place of birth for the foreign-born population - South Africa (%)
Place of birth for the foreign-born population - Other Southern Africa (%)
Place of birth for the foreign-born population - Cabo Verde (%)
Place of birth for the foreign-born population - Ghana (%)
Place of birth for the foreign-born population - Liberia (%)
Place of birth for the foreign-born population - Nigeria (%)
Place of birth for the foreign-born population - Senegal (%)
Place of birth for the foreign-born population - Sierra Leone (%)
Place of birth for the foreign-born population - Other Western Africa (%)
Place of birth for the foreign-born population - Australia (%)
Place of birth for the foreign-born population - New Zealand (%)
Place of birth for the foreign-born population - Fiji (%)
Place of birth for the foreign-born population - Micronesia (%)
Place of birth for the foreign-born population - Bahamas (%)
Place of birth for the foreign-born population - Barbados (%)
Place of birth for the foreign-born population - Cuba (%)
Place of birth for the foreign-born population - Dominica (%)
Place of birth for the foreign-born population - Dominican Republic (%)
Place of birth for the foreign-born population - Grenada (%)
Place of birth for the foreign-born population - Haiti (%)
Place of birth for the foreign-born population - Jamaica (%)
Place of birth for the foreign-born population - St. Vincent and the Grenadines (%)
Place of birth for the foreign-born population - Trinidad and Tobago (%)
Place of birth for the foreign-born population - West Indies (%)
Place of birth for the foreign-born population - Other Caribbean (%)
Place of birth for the foreign-born population - Belize (%)
Place of birth for the foreign-born population - Costa Rica (%)
Place of birth for the foreign-born population - El Salvador (%)
Place of birth for the foreign-born population - Guatemala (%)
Place of birth for the foreign-born population - Honduras (%)
Place of birth for the foreign-born population - Mexico (%)
Place of birth for the foreign-born population - Nicaragua (%)
Place of birth for the foreign-born population - Panama (%)
Place of birth for the foreign-born population - Other Central America (%)
Place of birth for the foreign-born population - Argentina (%)
Place of birth for the foreign-born population - Bolivia (%)
Place of birth for the foreign-born population - Brazil (%)
Place of birth for the foreign-born population - Chile (%)
Place of birth for the foreign-born population - Colombia (%)
Place of birth for the foreign-born population - Ecuador (%)
Place of birth for the foreign-born population - Guyana (%)
Place of birth for the foreign-born population - Peru (%)
Place of birth for the foreign-born population - Uruguay (%)
Place of birth for the foreign-born population - Venezuela (%)
Place of birth for the foreign-born population - Other South America (%)
Place of birth for the foreign-born population - Canada (%)
Place of birth for the foreign-born population - Other Northern America (%)
Place of birth for the foreign-born population - Other (%)
Latest news about races in Boerne, TX collected exclusively by city-data.com from local newspapers, TV, and radio stations
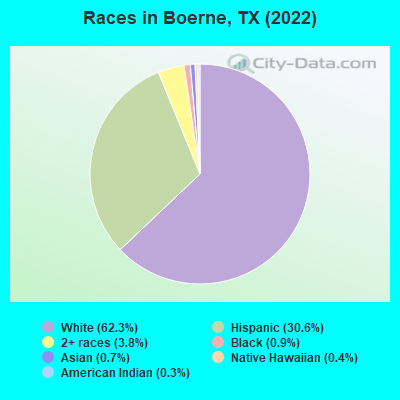
According to 2022 data, the most numerous races in Boerne, TX are Hispanic (5,797 residents), White alone (11,827 residents), and Black alone (165 residents). 83.9% of Boerne residents speak English at home. 7.3% of Boerne, TX residents are foreign-born (5.4% born in Latin America, 1.0% born in Asia), which is 134.2% less than the foreign-born rate of 17.0% across the entire state of Texas.
Race distribution in Boerne
2000 2022
10,933,313 52.4% White alone 6,669,666 32.0% Hispanic 2,364,255 11.3% Black alone 554,445 2.7% Asian alone 230,567 1.1% Two or more races 68,859 0.3% American Indian alone 19,958 0.10% Other race alone 10,757 0.05% Native Hawaiian and Other
12,070,642 40.2% Hispanic 11,683,430 38.9% White alone 3,508,706 11.7% Black alone 1,608,173 5.4% Asian alone 956,560 3.2% Two or more races 125,763 0.4% Other race alone 47,023 0.2% American Indian alone 29,275 0.10% Native Hawaiian and Other
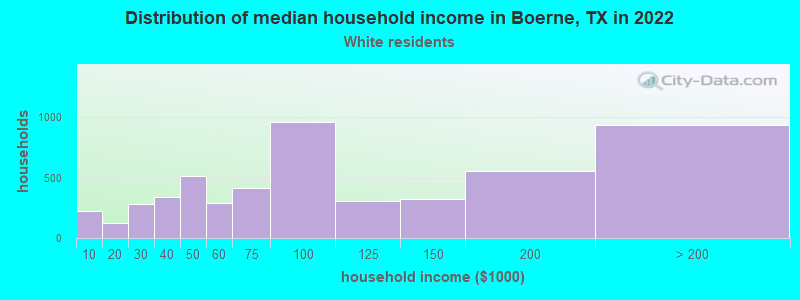
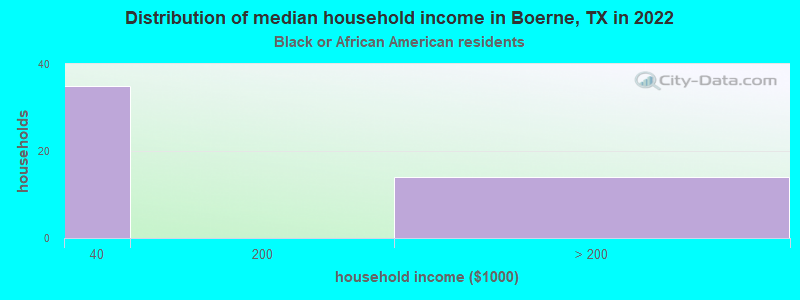
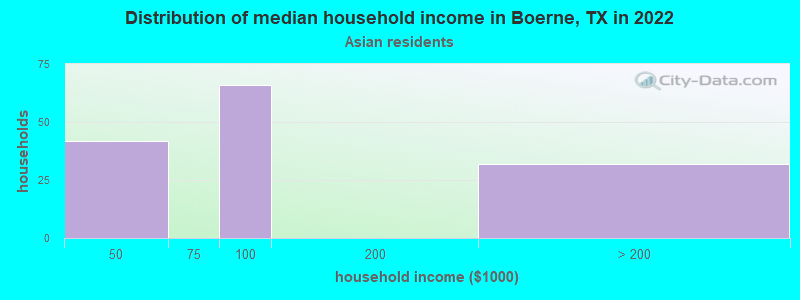
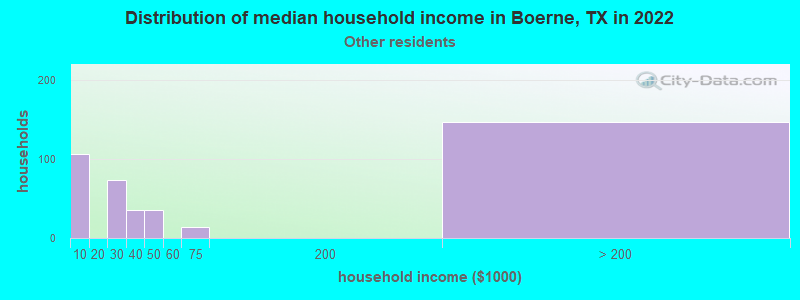
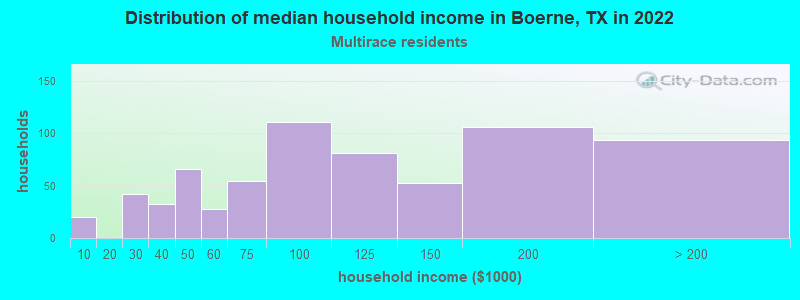
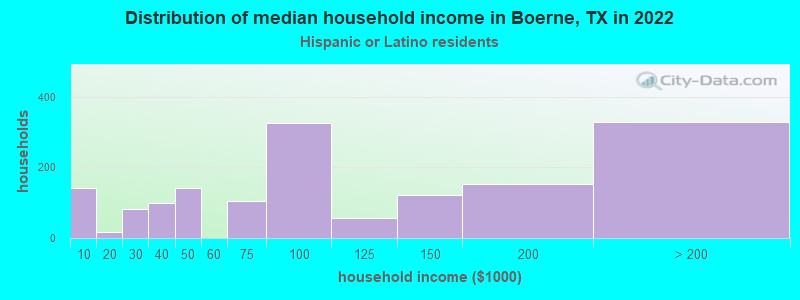
Income and house value in Boerne Median household income in 2022 $79,486 White non-Hispanic householders$91,399 Asian householders$97,319 Two or more races householders$91,233 Hispanic or Latino race householdersMedian 2022 house value $487,307 White Non-Hispanic householders$388,700 Black or African American householders$767,171 Native Hawaiian and other Pacific Islander householders$265,952 Some other race householders$245,494 Two or more races householders$330,190 Hispanic or Latino householders
Median age by race in Boerne
42.4 Median age for White residents41.2 43.5 43.1 Median age for Black or African American residents33.2 51.9 13.2 Median age for American Indian / Alaska Native residents-682,445,758.7 12.6 51.3 Median age for Asian residents-683,426,442.5 51.0 -581,560,283.1 Median age for Native Hawaiian / Pacific Islander residents-612,729,233.5 -577,777,777.2 37.2 Median age for Other race residents37.4 29.6 18.1 Median age for Two or more races residents18.1 30.5 42.3 Median age for White alone residents40.6 43.1 34.2 Median age for Hispanic or Latino residents28.4 37.0
Owner/renter occupied households by race in Boerne
House owners and renters - White residents 3,313 63.3% Owner occupied1,922 36.7% Renter occupiedHouse owners and renters - Black or African American residents 13 24.6% Owner occupied39 75.4% Renter occupiedHouse owners and renters - American Indian / Alaska Native residents 15 100.0% Owner occupiedHouse owners and renters - Asian residents 32 24.1% Owner occupied102 75.9% Renter occupiedHouse owners and renters - Other race residents 36 9.2% Owner occupied352 90.8% Renter occupiedHouse owners and renters - Two or more races residents 507 72.6% Owner occupied192 27.4% Renter occupiedHouse owners and renters - White alone residents 3,137 60.9% Owner occupied2,018 39.1% Renter occupiedHouse owners and renters - Hispanic or Latino residents 883 57.3% Owner occupied659 42.7% Renter occupied
Language usage in Boerne
English speakers - Total 83.9% of residents of Boerne speak English at home.
14.0% of residents speak Spanish at home 1,395 55.8% Speak English very well1,104 44.2% Speak English less than very well2.0% of residents speak other language at home 289 81.4% Speak English very well66 18.6% Speak English less than very well
English speakers - Born in the United States 93.0% of residents of Boerne speak English at home.
5.8% of residents speak Spanish at home 286 73.1% Speak English very well105 26.9% Speak English less than very well1.0% of residents speak other language at home 64 100.0% Speak English very well
English speakers - Native, born elsewhere 52.9% of residents of Boerne speak English at home.
37.3% of residents speak Spanish at home 155 84.7% Speak English very well28 15.3% Speak English less than very well9.8% of residents speak other language at home 48 100.0% Speak English very well
English speakers - Foreign-born 10.9% of residents of Boerne speak English at home.
72.2% of residents speak Spanish at home 174 17.5% Speak English very well820 82.5% Speak English less than very well16.5% of residents speak other language at home 184 81.1% Speak English very well43 18.9% Speak English less than very well
White (Caucasian) - Speak only English Native:
100.0% (11,532)Foreign-born:
22.8% (83)
White (Caucasian) - Speak another language Native:
4.5% (518)Foreign-born:
77.0% (281)
Black or African American - Speak only English Native:
100.0% (169)Foreign-born:
54.4% (19)
American Indian / Alaska Native - Speak another language Native:
18.5% (16)Foreign-born:
98.9% (2)
Asian - Speak another language Native:
98.9% (1)Foreign-born:
99.6% (139)
Other race - Speak only English Native:
75.8% (727)Foreign-born:
8.3% (25)
Other race - Speak another language Native:
26.9% (258)Foreign-born:
91.9% (282)
Two or more races - Speak only English Native:
76.4% (2,308)Foreign-born:
2.2% (5)
Two or more races - Speak another language Native:
19.4% (586)Foreign-born:
98.0% (220)
White alone - Speak only English Native:
97.8% (10,851)Foreign-born:
55.9% (99)
White alone - Speak another language Native:
2.2% (244)Foreign-born:
44.2% (78)
Hispanic or Latino - Speak only English Native:
72.1% (3,098)Foreign-born:
2.3% (23)
Hispanic or Latino - Speak another language Native:
28.8% (1,236)Foreign-born:
97.4% (987)
Foreign-born residents in Boerne 1,377 residents are foreign born (5.4% Latin America , 1.0% Asia ).
This city:
7.3%Texas:
17.1%
Marital status for residents in Boerne Marital status - White (Caucasian) population 15 years and over
Males 23.7% Never married63.4% Now married0.3% Separated2.8% Widowed9.8% DivorcedFemales 23.9% Never married50.7% Now married1.8% Separated10.7% Widowed12.9% DivorcedWomen who gave birth in the past 12 months Now married:
79.1% (171)Unmarried:
20.9% (45)
Women who did not give birth in the past 12 months Now married:
49.0% (1,368)Unmarried:
51.0% (1,424)
Marital status - Black or African American population 15 years and over
Males 44.7% Never married12.8% Now married3.2% Separated0.0% Widowed39.4% DivorcedFemales 47.0% Never married25.3% Now married0.0% Separated27.7% Widowed0.0% DivorcedWomen who did not give birth in the past 12 months Now married:
65.6% (21)Unmarried:
34.4% (11)
Marital status - American Indian / Alaska Native population 15 years and over
Males 0.0% Never married95.2% Now married0.0% Separated0.0% Widowed4.8% DivorcedFemales 0.0% Never married100.0% Now married0.0% Separated0.0% Widowed0.0% DivorcedMarital status - Asian population 15 years and over
Males 10.0% Never married90.0% Now married0.0% Separated0.0% Widowed0.0% DivorcedFemales 48.8% Never married51.2% Now married0.0% Separated0.0% Widowed0.0% DivorcedWomen who did not give birth in the past 12 months Now married:
32.2% (30)Unmarried:
67.8% (63)
Marital status - Other race population 15 years and over
Males 45.5% Never married15.0% Now married0.0% Separated0.0% Widowed39.4% DivorcedFemales 54.0% Never married40.4% Now married0.0% Separated5.5% Widowed0.0% DivorcedWomen who gave birth in the past 12 months Now married:
0.0% (0)Unmarried:
100.0% (73)
Women who did not give birth in the past 12 months Now married:
52.2% (128)Unmarried:
47.8% (117)
Marital status - Two or more races population 15 years and over
Males 49.4% Never married35.6% Now married0.0% Separated3.8% Widowed11.2% DivorcedFemales 10.3% Never married67.0% Now married0.0% Separated1.6% Widowed21.1% DivorcedWomen who gave birth in the past 12 months Now married:
61.5% (65)Unmarried:
38.5% (41)
Women who did not give birth in the past 12 months Now married:
71.8% (241)Unmarried:
28.2% (95)
Marital status - White alone, not Hispanic / Latino population 15 years and over
Males 19.8% Never married66.5% Now married0.4% Separated2.4% Widowed10.9% DivorcedFemales 23.6% Never married49.3% Now married0.6% Separated11.6% Widowed14.9% DivorcedWomen who gave birth in the past 12 months Now married:
74.8% (165)Unmarried:
25.2% (56)
Women who did not give birth in the past 12 months Now married:
46.1% (1,210)Unmarried:
53.9% (1,417)
Marital status - Hispanic or Latino population 15 years and over
Males 41.6% Never married40.3% Now married0.0% Separated2.9% Widowed15.2% DivorcedFemales 25.8% Never married60.1% Now married4.9% Separated5.4% Widowed3.7% DivorcedWomen who gave birth in the past 12 months Now married:
61.9% (89)Unmarried:
38.1% (55)
Women who did not give birth in the past 12 months Now married:
63.0% (744)Unmarried:
37.0% (438)
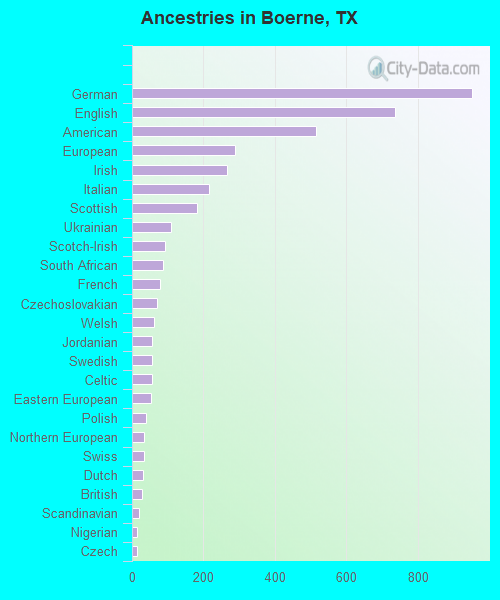
Ancestries in Boerne
952 11.9% German736 9.2% English515 6.5% American289 3.6% European267 3.3% Irish217 2.7% Italian181 2.3% Scottish108 1.4% Ukrainian93 1.2% Scotch-Irish87 1.1% South African78 1.0% French71 0.9% Czechoslovakian61 0.8% Welsh56 0.7% Jordanian56 0.7% Swedish55 0.7% Celtic53 0.7% Eastern European38 0.5% Polish35 0.4% Northern European33 0.4% Swiss32 0.4% Dutch27 0.3% British21 0.3% Scandinavian15 0.2% Nigerian14 0.2% Czech14 0.2% Greek11 0.1% Danish7 0.09% Egyptian2 0.03% African2 0.03% West Indian
Geographical mobility in Boerne Same house 1 year ago 10,122 84.2% White (Caucasian)124 60.5% Black or African American15 16.0% American Indian / Alaska Native65 45.5% Asian84 98.2% Native Hawaiian / Pacific Islander1,022 78.9% Other race2,131 58.6% Two or more races9,912 84.9% White alone, not Hispanic / Latino4,106 72.3% Hispanic or LatinoMoved within same county 483 4.0% White / Caucasian24 11.8% Black or African American1 1.3% American Indian / Alaska Native32 22.8% Asian1,159 31.9% Two or more races566 4.8% White alone, not Hispanic / Latino662 11.6% Hispanic or LatinoMoved within same state 904 7.5% White / Caucasian55 27.1% Black or African American44 30.6% Asian269 20.7% Other race271 7.4% Two or more races786 6.7% White alone, not Hispanic / Latino625 11.0% Hispanic or LatinoMoved from different state 356 3.0% White / Caucasian84 89.7% American Indian / Alaska Native23 0.6% Two or more races368 3.1% White alone, not Hispanic / LatinoMoved from abroad 214 1.8% White77 0.7% White alone, not Hispanic / Latino301 5.3% Hispanic or Latino
Children Nativity (place of birth) in Boerne
Children under 6 years - Living with two parents Both parents native 818 100.0% NativeOne native, one foreign-born parent 62 100.0% NativeChildren under 6 years - Living with one parent Native parent 331 100.0% NativeForeign-born parent 98 100.0% NativeChildren 6 to 17 years - Living with two parents Both parents native 1,989 100.0% NativeBoth parents foreign-born 41 56.2% Native32 43.8% Foreign-bornOne native, one foreign-born parent 202 58.9% Native141 41.1% Foreign-bornChildren 6 to 17 years - Living with one parent Native parent 764 98.2% Native14 1.8% Foreign-bornForeign-born parent 12 100.0% Native
Grandparents responsible for own grandchildren in Boerne
Grandparents (30 to 59 years) White / Caucasian 17 53.9% Responsible for grandchildren15 46.1% Not responsible for grandchildrenTwo or more races 24 100.0% Not responsible for grandchildrenWhite alone, not Hispanic / Latino 22 49.4% Responsible for grandchildren23 50.6% Not responsible for grandchildrenGrandparents (60 years and over) White / Caucasian 63 41.9% Responsible for grandchildren88 58.1% Not responsible for grandchildrenWhite alone, not Hispanic / Latino 39 24.7% Responsible for grandchildren120 75.3% Not responsible for grandchildren