Races in Bull Run, Virginia (VA) Detailed Stats
Data:
Races - White alone (%)
Races - White alone (% change since 2000)
Races - Black alone (%)
Races - Black alone (% change since 2000)
Races - American Indian alone (%)
Races - American Indian alone (% change since 2000)
Races - Asian alone (%)
Races - Asian alone (% change since 2000)
Races - Hispanic (%)
Races - Hispanic (% change since 2000)
Races - Native Hawaiian and Other Pacific Islander alone (%)
Races - Native Hawaiian and Other Pacific Islander alone (% change since 2000)
Races - Two or more races(%)
Races - Two or more races(% change since 2000)
Races - Other race alone (%)
Races - Other race alone (% change since 2000)
Racial diversity
Place of birth - Born in state of residence (%)
Place of birth - Born in state of residence (%) - White
Place of birth - Born in state of residence (%) - Black or African American
Place of birth - Born in state of residence (%) - Asian
Place of birth - Born in state of residence (%) - Hispanic or Latino
Place of birth - Born in state of residence (%) - American Indian and Alaska Native
Place of birth - Born in state of residence (%) - Multirace
Place of birth - Born in state of residence (%) - Other Race
Place of birth - Born in other state (%)
Place of birth - Born in other state (%) - White
Place of birth - Born in other state (%) - Black or African American
Place of birth - Born in other state (%) - Asian
Place of birth - Born in other state (%) - Hispanic or Latino
Place of birth - Born in other state (%) - American Indian and Alaska Native
Place of birth - Born in other state (%) - Multirace
Place of birth - Born in other state (%) - Other Race
Place of birth - Native, outside of US (%)
Place of birth - Native, outside of US (%) - White
Place of birth - Native, outside of US (%) - Black or African American
Place of birth - Native, outside of US (%) - Asian
Place of birth - Native, outside of US (%) - Hispanic or Latino
Place of birth - Native, outside of US (%) - American Indian and Alaska Native
Place of birth - Native, outside of US (%) - Multirace
Place of birth - Native, outside of US (%) - Other Race
Place of birth - Foreign born (%)
Place of birth - Foreign born (%) - White
Place of birth - Foreign born (%) - Black or African American
Place of birth - Foreign born (%) - Asian
Place of birth - Foreign born (%) - Hispanic or Latino
Place of birth - Foreign born (%) - American Indian and Alaska Native
Place of birth - Foreign born (%) - Multirace
Place of birth - Foreign born (%) - Other Race
Residents speaking English at home (%)
Residents speaking English at home - Born in the United States (%)
Residents speaking English at home - Native, born elsewhere (%)
Residents speaking English at home - Foreign born (%)
Residents speaking Spanish at home (%)
Residents speaking Spanish at home - Born in the United States (%)
Residents speaking Spanish at home - Native, born elsewhere (%)
Residents speaking Spanish at home - Foreign born (%)
Residents speaking other language at home (%)
Residents speaking other language at home - Born in the United States (%)
Residents speaking other language at home - Native, born elsewhere (%)
Residents speaking other language at home - Foreign born (%)
Marital status - Never married (%)
Marital status - Now married (%)
Marital status - Separated (%)
Marital status - Widowed (%)
Marital status - Divorced (%)
Ancestries Reported - Arab (%)
Ancestries Reported - Czech (%)
Ancestries Reported - Danish (%)
Ancestries Reported - Dutch (%)
Ancestries Reported - English (%)
Ancestries Reported - French (%)
Ancestries Reported - French Canadian (%)
Ancestries Reported - German (%)
Ancestries Reported - Greek (%)
Ancestries Reported - Hungarian (%)
Ancestries Reported - Irish (%)
Ancestries Reported - Italian (%)
Ancestries Reported - Lithuanian (%)
Ancestries Reported - Norwegian (%)
Ancestries Reported - Polish (%)
Ancestries Reported - Portuguese (%)
Ancestries Reported - Russian (%)
Ancestries Reported - Scotch-Irish (%)
Ancestries Reported - Scottish (%)
Ancestries Reported - Slovak (%)
Ancestries Reported - Subsaharan African (%)
Ancestries Reported - Swedish (%)
Ancestries Reported - Swiss (%)
Ancestries Reported - Ukrainian (%)
Ancestries Reported - United States (%)
Ancestries Reported - Welsh (%)
Ancestries Reported - West Indian (%)
Ancestries Reported - Other (%)
Geographical mobility - Same house 1 year ago (%)
Geographical mobility - Same house 1 year ago (%) - White
Geographical mobility - Same house 1 year ago (%) - Black or African American
Geographical mobility - Same house 1 year ago (%) - Asian
Geographical mobility - Same house 1 year ago (%) - Hispanic or Latino
Geographical mobility - Same house 1 year ago (%) - American Indian and Alaska Native
Geographical mobility - Same house 1 year ago (%) - Multirace
Geographical mobility - Same house 1 year ago (%) - Other Race
Geographical mobility - Moved within same county (%)
Geographical mobility - Moved within same county (%) - White
Geographical mobility - Moved within same county (%) - Black or African American
Geographical mobility - Moved within same county (%) - Asian
Geographical mobility - Moved within same county (%) - Hispanic or Latino
Geographical mobility - Moved within same county (%) - American Indian and Alaska Native
Geographical mobility - Moved within same county (%) - Multirace
Geographical mobility - Moved within same county (%) - Other Race
Geographical mobility - Moved from different county within same state (%)
Geographical mobility - Moved from different county within same state (%) - White
Geographical mobility - Moved from different county within same state (%) - Black or African American
Geographical mobility - Moved from different county within same state (%) - Asian
Geographical mobility - Moved from different county within same state (%) - Hispanic or Latino
Geographical mobility - Moved from different county within same state (%) - American Indian and Alaska Native
Geographical mobility - Moved from different county within same state (%) - Multirace
Geographical mobility - Moved from different county within same state (%) - Other Race
Geographical mobility - Moved from different state (%)
Geographical mobility - Moved from different state (%) - White
Geographical mobility - Moved from different state (%) - Black or African American
Geographical mobility - Moved from different state (%) - Asian
Geographical mobility - Moved from different state (%) - Hispanic or Latino
Geographical mobility - Moved from different state (%) - American Indian and Alaska Native
Geographical mobility - Moved from different state (%) - Multirace
Geographical mobility - Moved from different state (%) - Other Race
Geographical mobility - Moved from abroad (%)
Geographical mobility - Moved from abroad (%) - White
Geographical mobility - Moved from abroad (%) - Black or African American
Geographical mobility - Moved from abroad (%) - Asian
Geographical mobility - Moved from abroad (%) - Hispanic or Latino
Geographical mobility - Moved from abroad (%) - American Indian and Alaska Native
Geographical mobility - Moved from abroad (%) - Multirace
Geographical mobility - Moved from abroad (%) - Other Race
Place of birth for the foreign-born population - Ireland (%)
Place of birth for the foreign-born population - Denmark (%)
Place of birth for the foreign-born population - Norway (%)
Place of birth for the foreign-born population - Sweden (%)
Place of birth for the foreign-born population - United Kingdom (%)
Place of birth for the foreign-born population - England (%)
Place of birth for the foreign-born population - Scotland (%)
Place of birth for the foreign-born population - Other Northern Europe (%)
Place of birth for the foreign-born population - Austria (%)
Place of birth for the foreign-born population - Belgium (%)
Place of birth for the foreign-born population - France (%)
Place of birth for the foreign-born population - Germany (%)
Place of birth for the foreign-born population - Netherlands (%)
Place of birth for the foreign-born population - Switzerland (%)
Place of birth for the foreign-born population - Other Western Europe (%)
Place of birth for the foreign-born population - Greece (%)
Place of birth for the foreign-born population - Italy (%)
Place of birth for the foreign-born population - Portugal (%)
Place of birth for the foreign-born population - Spain (%)
Place of birth for the foreign-born population - Other Southern Europe (%)
Place of birth for the foreign-born population - Albania (%)
Place of birth for the foreign-born population - Belarus (%)
Place of birth for the foreign-born population - Bosnia and Herzegovina (%)
Place of birth for the foreign-born population - Bulgaria (%)
Place of birth for the foreign-born population - Croatia (%)
Place of birth for the foreign-born population - Czechoslovakia (%)
Place of birth for the foreign-born population - Hungary (%)
Place of birth for the foreign-born population - Latvia (%)
Place of birth for the foreign-born population - Lithuania (%)
Place of birth for the foreign-born population - North Macedonia (Macedonia) (%)
Place of birth for the foreign-born population - Moldova (%)
Place of birth for the foreign-born population - Poland (%)
Place of birth for the foreign-born population - Romania (%)
Place of birth for the foreign-born population - Russia (%)
Place of birth for the foreign-born population - Serbia (%)
Place of birth for the foreign-born population - Ukraine (%)
Place of birth for the foreign-born population - Other Eastern Europe (%)
Place of birth for the foreign-born population - China (%)
Place of birth for the foreign-born population - Hong Kong (%)
Place of birth for the foreign-born population - Taiwan (%)
Place of birth for the foreign-born population - Japan (%)
Place of birth for the foreign-born population - Korea (%)
Place of birth for the foreign-born population - Other Eastern Asia (%)
Place of birth for the foreign-born population - Afghanistan (%)
Place of birth for the foreign-born population - Bangladesh (%)
Place of birth for the foreign-born population - India (%)
Place of birth for the foreign-born population - Iran (%)
Place of birth for the foreign-born population - Kazakhstan (%)
Place of birth for the foreign-born population - Nepal (%)
Place of birth for the foreign-born population - Pakistan (%)
Place of birth for the foreign-born population - Sri Lanka (%)
Place of birth for the foreign-born population - Uzbekistan (%)
Place of birth for the foreign-born population - Other South Central Asia (%)
Place of birth for the foreign-born population - Burma (%)
Place of birth for the foreign-born population - Cambodia (%)
Place of birth for the foreign-born population - Indonesia (%)
Place of birth for the foreign-born population - Laos (%)
Place of birth for the foreign-born population - Malaysia (%)
Place of birth for the foreign-born population - Philippines (%)
Place of birth for the foreign-born population - Singapore (%)
Place of birth for the foreign-born population - Thailand (%)
Place of birth for the foreign-born population - Vietnam (%)
Place of birth for the foreign-born population - Other South Eastern Asia (%)
Place of birth for the foreign-born population - Armenia (%)
Place of birth for the foreign-born population - Iraq (%)
Place of birth for the foreign-born population - Israel (%)
Place of birth for the foreign-born population - Jordan (%)
Place of birth for the foreign-born population - Kuwait (%)
Place of birth for the foreign-born population - Lebanon (%)
Place of birth for the foreign-born population - Saudi Arabia (%)
Place of birth for the foreign-born population - Syria (%)
Place of birth for the foreign-born population - Turkey (%)
Place of birth for the foreign-born population - Yemen (%)
Place of birth for the foreign-born population - Other Western Asia (%)
Place of birth for the foreign-born population - Eritrea (%)
Place of birth for the foreign-born population - Ethiopia (%)
Place of birth for the foreign-born population - Kenya (%)
Place of birth for the foreign-born population - Somalia (%)
Place of birth for the foreign-born population - Uganda (%)
Place of birth for the foreign-born population - Zimbabwe (%)
Place of birth for the foreign-born population - Other Eastern Africa (%)
Place of birth for the foreign-born population - Cameroon (%)
Place of birth for the foreign-born population - Congo (%)
Place of birth for the foreign-born population - Democratic Republic of Congo (Zaire) (%)
Place of birth for the foreign-born population - Other Middle Africa (%)
Place of birth for the foreign-born population - Egypt (%)
Place of birth for the foreign-born population - Morocco (%)
Place of birth for the foreign-born population - Sudan (%)
Place of birth for the foreign-born population - Other Northern Africa (%)
Place of birth for the foreign-born population - South Africa (%)
Place of birth for the foreign-born population - Other Southern Africa (%)
Place of birth for the foreign-born population - Cabo Verde (%)
Place of birth for the foreign-born population - Ghana (%)
Place of birth for the foreign-born population - Liberia (%)
Place of birth for the foreign-born population - Nigeria (%)
Place of birth for the foreign-born population - Senegal (%)
Place of birth for the foreign-born population - Sierra Leone (%)
Place of birth for the foreign-born population - Other Western Africa (%)
Place of birth for the foreign-born population - Australia (%)
Place of birth for the foreign-born population - New Zealand (%)
Place of birth for the foreign-born population - Fiji (%)
Place of birth for the foreign-born population - Micronesia (%)
Place of birth for the foreign-born population - Bahamas (%)
Place of birth for the foreign-born population - Barbados (%)
Place of birth for the foreign-born population - Cuba (%)
Place of birth for the foreign-born population - Dominica (%)
Place of birth for the foreign-born population - Dominican Republic (%)
Place of birth for the foreign-born population - Grenada (%)
Place of birth for the foreign-born population - Haiti (%)
Place of birth for the foreign-born population - Jamaica (%)
Place of birth for the foreign-born population - St. Vincent and the Grenadines (%)
Place of birth for the foreign-born population - Trinidad and Tobago (%)
Place of birth for the foreign-born population - West Indies (%)
Place of birth for the foreign-born population - Other Caribbean (%)
Place of birth for the foreign-born population - Belize (%)
Place of birth for the foreign-born population - Costa Rica (%)
Place of birth for the foreign-born population - El Salvador (%)
Place of birth for the foreign-born population - Guatemala (%)
Place of birth for the foreign-born population - Honduras (%)
Place of birth for the foreign-born population - Mexico (%)
Place of birth for the foreign-born population - Nicaragua (%)
Place of birth for the foreign-born population - Panama (%)
Place of birth for the foreign-born population - Other Central America (%)
Place of birth for the foreign-born population - Argentina (%)
Place of birth for the foreign-born population - Bolivia (%)
Place of birth for the foreign-born population - Brazil (%)
Place of birth for the foreign-born population - Chile (%)
Place of birth for the foreign-born population - Colombia (%)
Place of birth for the foreign-born population - Ecuador (%)
Place of birth for the foreign-born population - Guyana (%)
Place of birth for the foreign-born population - Peru (%)
Place of birth for the foreign-born population - Uruguay (%)
Place of birth for the foreign-born population - Venezuela (%)
Place of birth for the foreign-born population - Other South America (%)
Place of birth for the foreign-born population - Canada (%)
Place of birth for the foreign-born population - Other Northern America (%)
Place of birth for the foreign-born population - Other (%)
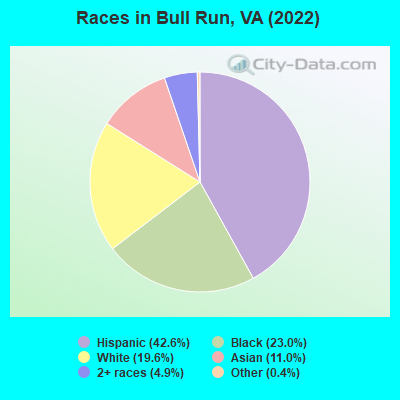
According to 2022 data, the most numerous races in Bull Run, VA are White alone (3,292 residents), Black alone (3,875 residents), and Hispanic (7,161 residents). 43.1% of Bull Run residents speak English at home. 44.2% of Bull Run, VA residents are foreign-born (27.0% born in Latin America, 9.0% born in Africa, 7.6% born in Asia), which is 72.8% greater than the foreign-born rate of 12.0% across the entire state of Virginia.
Race distribution in Bull Run
2000 2022
4,965,637 70.2% White alone 1,376,378 19.4% Black alone 329,540 4.7% Hispanic 259,277 3.7% Asian alone 114,022 1.6% Two or more races 18,596 0.3% American Indian alone 11,685 0.2% Other race alone 3,380 0.05% Native Hawaiian and Other
5,095,130 58.7% White alone 1,594,785 18.4% Black alone 905,750 10.4% Hispanic 602,881 6.9% Asian alone 406,047 4.7% Two or more races 60,419 0.7% Other race alone 11,738 0.1% American Indian alone 6,869 0.08% Native Hawaiian and Other
Income and house value in Bull Run Median household income in 2022 $77,543 White non-Hispanic householders$87,193 Black householders$93,156 Asian householders$74,468 Some other race householders$97,261 Two or more races householders$71,360 Hispanic or Latino race householdersMedian 2022 house value $402,629 White Non-Hispanic householders$388,690 Black or African American householders$435,574 American Indian or Alaska Native householders $438,108 Asian householders$275,283 Some other race householders$413,083 Two or more races householders$414,350 Hispanic or Latino householders
Median age by race in Bull Run
31.5 Median age for White residents32.5 29.7 37.2 Median age for Black or African American residents39.0 30.8 -633,911,367.4 Median age for American Indian / Alaska Native residents-649,621,211.5 -670,886,075.3 37.1 Median age for Asian residents42.1 35.5 -611,955,419.9 Median age for Native Hawaiian / Pacific Islander residents-541,531,822.5 -714,150,046.8 32.1 Median age for Other race residents33.5 32.9 31.8 Median age for Two or more races residents27.3 34.1 40.8 Median age for White alone residents40.3 41.4 29.0 Median age for Hispanic or Latino residents28.7 29.1
Owner/renter occupied households by race in Bull Run
House owners and renters - White residents 957 35.7% Owner occupied1,723 64.3% Renter occupiedHouse owners and renters - Black or African American residents 570 35.8% Owner occupied1,022 64.2% Renter occupiedHouse owners and renters - Asian residents 345 48.3% Owner occupied369 51.7% Renter occupiedHouse owners and renters - Other race residents 93 16.3% Owner occupied476 83.7% Renter occupiedHouse owners and renters - Two or more races residents 179 16.7% Owner occupied893 83.3% Renter occupiedHouse owners and renters - White alone residents 856 40.8% Owner occupied1,243 59.2% Renter occupiedHouse owners and renters - Hispanic or Latino residents 304 15.6% Owner occupied1,648 84.4% Renter occupied
Language usage in Bull Run
English speakers - Total 43.1% of residents of Bull Run speak English at home.
35.4% of residents speak Spanish at home 2,304 42.6% Speak English very well3,110 57.4% Speak English less than very well21.6% of residents speak other language at home 1,818 55.0% Speak English very well1,489 45.0% Speak English less than very well
English speakers - Born in the United States 88.6% of residents of Bull Run speak English at home.
11.0% of residents speak Spanish at home 241 63.4% Speak English very well139 36.6% Speak English less than very well1.5% of residents speak other language at home 53 100.0% Speak English very well
English speakers - Native, born elsewhere 65.4% of residents of Bull Run speak English at home.
21.6% of residents speak Spanish at home 34 51.5% Speak English very well32 48.5% Speak English less than very well7.8% of residents speak other language at home 24 100.0% Speak English less than very well
English speakers - Foreign-born 5.2% of residents of Bull Run speak English at home.
57.7% of residents speak Spanish at home 1,299 31.5% Speak English very well2,828 68.5% Speak English less than very well37.9% of residents speak other language at home 1,339 49.4% Speak English very well1,371 50.6% Speak English less than very well
White (Caucasian) - Speak only English Native:
81.3% (3,008)Foreign-born:
5.4% (62)
White (Caucasian) - Speak another language Native:
14.4% (533)Foreign-born:
93.8% (1,091)
Black or African American - Speak only English Native:
94.2% (2,090)Foreign-born:
2.0% (24)
Black or African American - Speak another language Native:
5.7% (127)Foreign-born:
100.0% (1,230)
Asian - Speak only English Native:
18.3% (85)Foreign-born:
5.3% (62)
Asian - Speak another language Native:
88.8% (411)Foreign-born:
94.9% (1,118)
Other race - Speak only English Native:
55.2% (301)Foreign-born:
1.9% (24)
Other race - Speak another language Native:
44.4% (242)Foreign-born:
95.8% (1,209)
Two or more races - Speak only English Native:
70.8% (860)Foreign-born:
14.8% (345)
Two or more races - Speak another language Native:
28.4% (345)Foreign-born:
85.6% (1,993)
White alone - Speak only English Native:
97.1% (2,816)Foreign-born:
17.4% (39)
White alone - Speak another language Native:
2.9% (85)Foreign-born:
83.5% (189)
Hispanic or Latino - Speak only English Native:
42.0% (835)Foreign-born:
7.8% (347)
Hispanic or Latino - Speak another language Native:
58.1% (1,155)Foreign-born:
92.0% (4,093)
Foreign-born residents in Bull Run 7,428 residents are foreign born (27.0% Latin America , 9.0% Africa , 7.6% Asia ).
This city:
44.2%Virginia:
12.6%
Marital status for residents in Bull Run Marital status - White (Caucasian) population 15 years and over
Males 48.7% Never married36.7% Now married3.0% Separated4.6% Widowed7.0% DivorcedFemales 39.8% Never married33.2% Now married7.3% Separated8.5% Widowed11.2% DivorcedWomen who gave birth in the past 12 months Now married:
77.3% (81)Unmarried:
22.7% (24)
Women who did not give birth in the past 12 months Now married:
43.7% (644)Unmarried:
56.3% (831)
Marital status - Black or African American population 15 years and over
Males 15.1% Never married79.5% Now married0.0% Separated0.9% Widowed4.6% DivorcedFemales 34.1% Never married49.2% Now married2.1% Separated2.8% Widowed11.8% DivorcedWomen who gave birth in the past 12 months Now married:
100.0% (18)Unmarried:
0.0% (0)
Women who did not give birth in the past 12 months Now married:
56.4% (700)Unmarried:
43.6% (540)
Marital status - Asian population 15 years and over
Males 19.1% Never married73.6% Now married0.0% Separated0.9% Widowed6.3% DivorcedFemales 17.9% Never married53.9% Now married1.0% Separated12.1% Widowed15.1% DivorcedWomen who gave birth in the past 12 months Now married:
100.0% (48)Unmarried:
0.0% (0)
Women who did not give birth in the past 12 months Now married:
54.3% (235)Unmarried:
45.7% (198)
Marital status - Other race population 15 years and over
Males 55.2% Never married38.5% Now married2.4% Separated0.0% Widowed3.9% DivorcedFemales 36.3% Never married44.4% Now married0.0% Separated8.8% Widowed10.4% DivorcedWomen who gave birth in the past 12 months Now married:
0.0% (0)Unmarried:
100.0% (16)
Women who did not give birth in the past 12 months Now married:
48.7% (254)Unmarried:
51.3% (267)
Marital status - Two or more races population 15 years and over
Males 75.6% Never married21.3% Now married3.1% Separated0.0% Widowed0.0% DivorcedFemales 66.1% Never married23.5% Now married0.0% Separated1.6% Widowed8.9% DivorcedWomen who gave birth in the past 12 months Now married:
0.0% (0)Unmarried:
100.0% (42)
Women who did not give birth in the past 12 months Now married:
29.7% (329)Unmarried:
70.3% (778)
Marital status - White alone, not Hispanic / Latino population 15 years and over
Males 55.5% Never married22.4% Now married3.5% Separated7.8% Widowed10.8% DivorcedFemales 46.3% Never married23.9% Now married1.5% Separated14.9% Widowed13.3% DivorcedWomen who gave birth in the past 12 months Now married:
56.0% (13)Unmarried:
44.0% (10)
Women who did not give birth in the past 12 months Now married:
29.1% (250)Unmarried:
70.9% (607)
Marital status - Hispanic or Latino population 15 years and over
Males 52.7% Never married42.7% Now married2.9% Separated0.0% Widowed1.8% DivorcedFemales 48.4% Never married35.0% Now married6.2% Separated1.9% Widowed8.5% DivorcedWomen who gave birth in the past 12 months Now married:
59.4% (88)Unmarried:
40.6% (60)
Women who did not give birth in the past 12 months Now married:
46.6% (918)Unmarried:
53.4% (1,052)
Ancestries in Bull Run
489 4.5% Ghanaian433 4.0% Ethiopian411 3.8% American248 2.3% Irish215 2.0% Nigerian188 1.7% African183 1.7% Afghan166 1.5% English141 1.3% German133 1.2% European95 0.9% Egyptian41 0.4% Jamaican39 0.4% Eastern European23 0.2% Armenian20 0.2% Russian19 0.2% Bulgarian17 0.2% Croatian16 0.1% Italian15 0.1% French15 0.1% Polish9 0.08% Lebanese7 0.06% Greek7 0.06% Scottish
Geographical mobility in Bull Run Same house 1 year ago 4,470 75.6% White (Caucasian)3,621 92.1% Black or African American1,607 87.8% Asian1,651 85.8% Other race3,160 90.0% Two or more races2,816 86.1% White alone, not Hispanic / Latino5,360 76.3% Hispanic or LatinoMoved within same county 450 7.6% White / Caucasian157 4.0% Black or African American62 3.4% Asian19 1.0% Other race234 6.7% Two or more races37 1.1% White alone, not Hispanic / Latino484 6.9% Hispanic or LatinoMoved within same state 863 14.6% White / Caucasian117 3.0% Black or African American83 4.5% Asian214 11.1% Other race107 3.0% Two or more races347 10.6% White alone, not Hispanic / Latino1,247 17.7% Hispanic or LatinoMoved from different state 82 1.4% White / Caucasian26 0.7% Black or African American52 1.6% White alone, not Hispanic / Latino31 0.4% Hispanic or LatinoMoved from abroad 176 3.0% White34 0.9% Black or African American93 5.1% Asian48 1.5% White alone, not Hispanic / Latino131 1.9% Hispanic or Latino
Children Nativity (place of birth) in Bull Run
Children under 6 years - Living with two parents Both parents native 263 99.8% Native1 0.2% Foreign-bornBoth parents foreign-born 587 94.2% Native36 5.8% Foreign-bornOne native, one foreign-born parent 225 100.0% NativeChildren under 6 years - Living with one parent Native parent 275 100.0% NativeForeign-born parent 256 91.4% Native24 8.6% Foreign-bornChildren 6 to 17 years - Living with two parents Both parents native 304 100.0% NativeBoth parents foreign-born 716 61.7% Native444 38.3% Foreign-bornOne native, one foreign-born parent 137 100.0% NativeChildren 6 to 17 years - Living with one parent Foreign-born parent 698 59.3% Native478 40.7% Foreign-born
Grandparents responsible for own grandchildren in Bull Run
Grandparents (30 to 59 years) White / Caucasian 10 20.6% Responsible for grandchildren38 79.4% Not responsible for grandchildrenBlack or African American 15 100.0% Not responsible for grandchildrenTwo or more races 7 100.0% Responsible for grandchildrenWhite alone, not Hispanic / Latino 10 20.7% Responsible for grandchildren39 79.3% Not responsible for grandchildrenHispanic or Latino 10 100.0% Not responsible for grandchildrenGrandparents (60 years and over) White / Caucasian 43 100.0% Not responsible for grandchildrenBlack or African American 30 63.1% Responsible for grandchildren18 36.9% Not responsible for grandchildrenWhite alone, not Hispanic / Latino 8 100.0% Not responsible for grandchildrenHispanic or Latino 28 100.0% Not responsible for grandchildren