Races in Burien, Washington (WA) Detailed Stats
Data:
Races - White alone (%)
Races - White alone (% change since 2000)
Races - Black alone (%)
Races - Black alone (% change since 2000)
Races - American Indian alone (%)
Races - American Indian alone (% change since 2000)
Races - Asian alone (%)
Races - Asian alone (% change since 2000)
Races - Hispanic (%)
Races - Hispanic (% change since 2000)
Races - Native Hawaiian and Other Pacific Islander alone (%)
Races - Native Hawaiian and Other Pacific Islander alone (% change since 2000)
Races - Two or more races(%)
Races - Two or more races(% change since 2000)
Races - Other race alone (%)
Races - Other race alone (% change since 2000)
Racial diversity
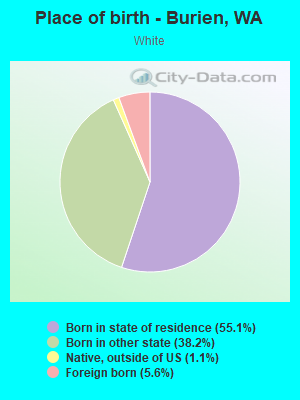
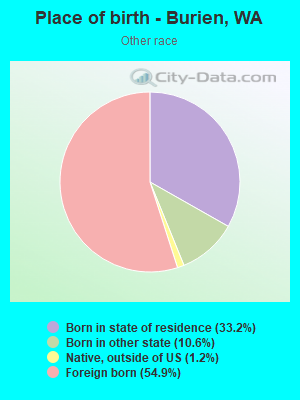
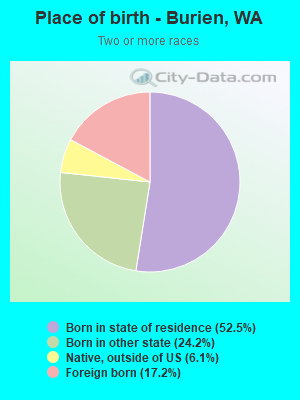
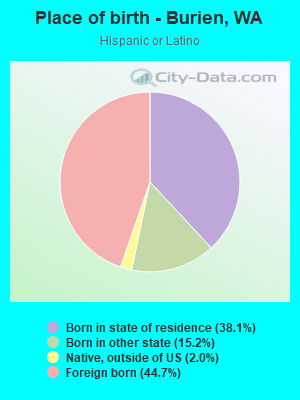
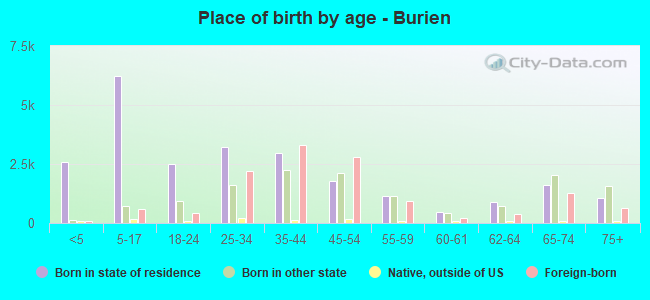
Place of birth - Born in state of residence (%)
Place of birth - Born in state of residence (%) - White
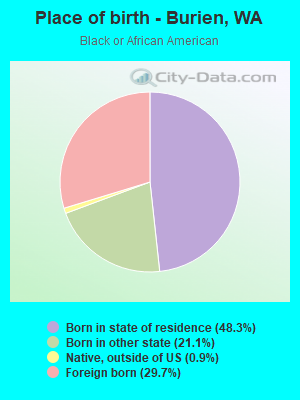
Place of birth - Born in state of residence (%) - Black or African American
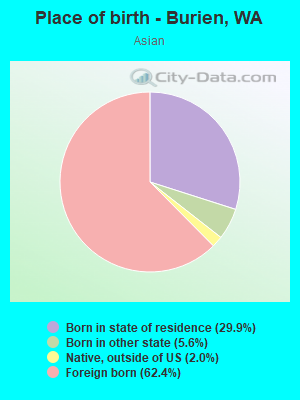
Place of birth - Born in state of residence (%) - Asian
Place of birth - Born in state of residence (%) - Hispanic or Latino
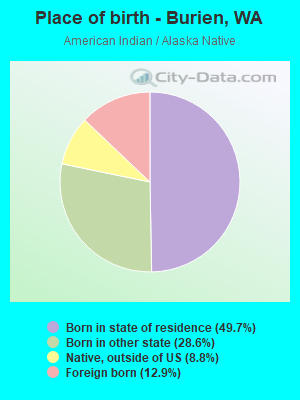
Place of birth - Born in state of residence (%) - American Indian and Alaska Native
Place of birth - Born in state of residence (%) - Multirace
Place of birth - Born in state of residence (%) - Other Race
Place of birth - Born in other state (%)
Place of birth - Born in other state (%) - White
Place of birth - Born in other state (%) - Black or African American
Place of birth - Born in other state (%) - Asian
Place of birth - Born in other state (%) - Hispanic or Latino
Place of birth - Born in other state (%) - American Indian and Alaska Native
Place of birth - Born in other state (%) - Multirace
Place of birth - Born in other state (%) - Other Race
Place of birth - Native, outside of US (%)
Place of birth - Native, outside of US (%) - White
Place of birth - Native, outside of US (%) - Black or African American
Place of birth - Native, outside of US (%) - Asian
Place of birth - Native, outside of US (%) - Hispanic or Latino
Place of birth - Native, outside of US (%) - American Indian and Alaska Native
Place of birth - Native, outside of US (%) - Multirace
Place of birth - Native, outside of US (%) - Other Race
Place of birth - Foreign born (%)
Place of birth - Foreign born (%) - White
Place of birth - Foreign born (%) - Black or African American
Place of birth - Foreign born (%) - Asian
Place of birth - Foreign born (%) - Hispanic or Latino
Place of birth - Foreign born (%) - American Indian and Alaska Native
Place of birth - Foreign born (%) - Multirace
Place of birth - Foreign born (%) - Other Race
Residents speaking English at home (%)
Residents speaking English at home - Born in the United States (%)
Residents speaking English at home - Native, born elsewhere (%)
Residents speaking English at home - Foreign born (%)
Residents speaking Spanish at home (%)
Residents speaking Spanish at home - Born in the United States (%)
Residents speaking Spanish at home - Native, born elsewhere (%)
Residents speaking Spanish at home - Foreign born (%)
Residents speaking other language at home (%)
Residents speaking other language at home - Born in the United States (%)
Residents speaking other language at home - Native, born elsewhere (%)
Residents speaking other language at home - Foreign born (%)
Marital status - Never married (%)
Marital status - Now married (%)
Marital status - Separated (%)
Marital status - Widowed (%)
Marital status - Divorced (%)
Ancestries Reported - Arab (%)
Ancestries Reported - Czech (%)
Ancestries Reported - Danish (%)
Ancestries Reported - Dutch (%)
Ancestries Reported - English (%)
Ancestries Reported - French (%)
Ancestries Reported - French Canadian (%)
Ancestries Reported - German (%)
Ancestries Reported - Greek (%)
Ancestries Reported - Hungarian (%)
Ancestries Reported - Irish (%)
Ancestries Reported - Italian (%)
Ancestries Reported - Lithuanian (%)
Ancestries Reported - Norwegian (%)
Ancestries Reported - Polish (%)
Ancestries Reported - Portuguese (%)
Ancestries Reported - Russian (%)
Ancestries Reported - Scotch-Irish (%)
Ancestries Reported - Scottish (%)
Ancestries Reported - Slovak (%)
Ancestries Reported - Subsaharan African (%)
Ancestries Reported - Swedish (%)
Ancestries Reported - Swiss (%)
Ancestries Reported - Ukrainian (%)
Ancestries Reported - United States (%)
Ancestries Reported - Welsh (%)
Ancestries Reported - West Indian (%)
Ancestries Reported - Other (%)
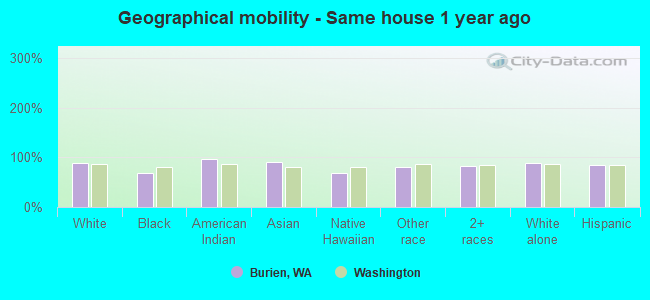
Geographical mobility - Same house 1 year ago (%)
Geographical mobility - Same house 1 year ago (%) - White
Geographical mobility - Same house 1 year ago (%) - Black or African American
Geographical mobility - Same house 1 year ago (%) - Asian
Geographical mobility - Same house 1 year ago (%) - Hispanic or Latino
Geographical mobility - Same house 1 year ago (%) - American Indian and Alaska Native
Geographical mobility - Same house 1 year ago (%) - Multirace
Geographical mobility - Same house 1 year ago (%) - Other Race
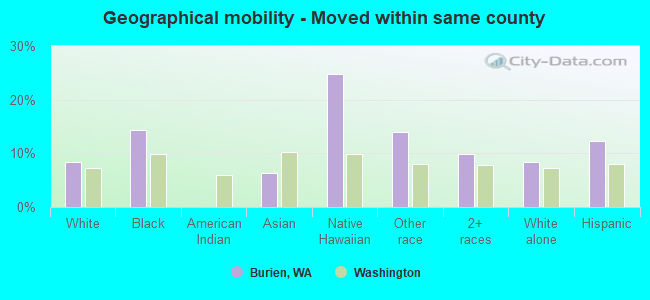
Geographical mobility - Moved within same county (%)
Geographical mobility - Moved within same county (%) - White
Geographical mobility - Moved within same county (%) - Black or African American
Geographical mobility - Moved within same county (%) - Asian
Geographical mobility - Moved within same county (%) - Hispanic or Latino
Geographical mobility - Moved within same county (%) - American Indian and Alaska Native
Geographical mobility - Moved within same county (%) - Multirace
Geographical mobility - Moved within same county (%) - Other Race
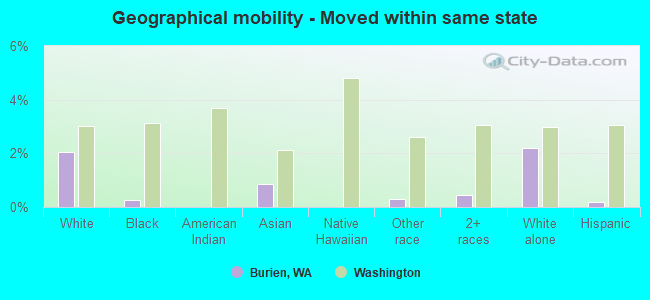
Geographical mobility - Moved from different county within same state (%)
Geographical mobility - Moved from different county within same state (%) - White
Geographical mobility - Moved from different county within same state (%) - Black or African American
Geographical mobility - Moved from different county within same state (%) - Asian
Geographical mobility - Moved from different county within same state (%) - Hispanic or Latino
Geographical mobility - Moved from different county within same state (%) - American Indian and Alaska Native
Geographical mobility - Moved from different county within same state (%) - Multirace
Geographical mobility - Moved from different county within same state (%) - Other Race
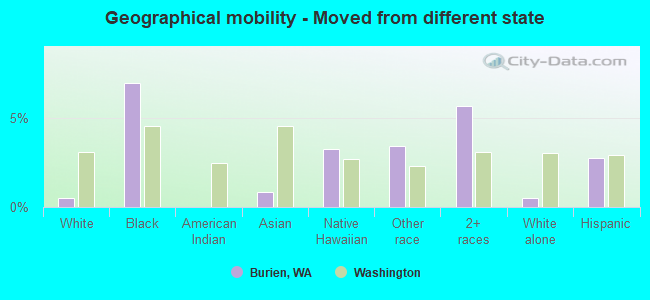
Geographical mobility - Moved from different state (%)
Geographical mobility - Moved from different state (%) - White
Geographical mobility - Moved from different state (%) - Black or African American
Geographical mobility - Moved from different state (%) - Asian
Geographical mobility - Moved from different state (%) - Hispanic or Latino
Geographical mobility - Moved from different state (%) - American Indian and Alaska Native
Geographical mobility - Moved from different state (%) - Multirace
Geographical mobility - Moved from different state (%) - Other Race
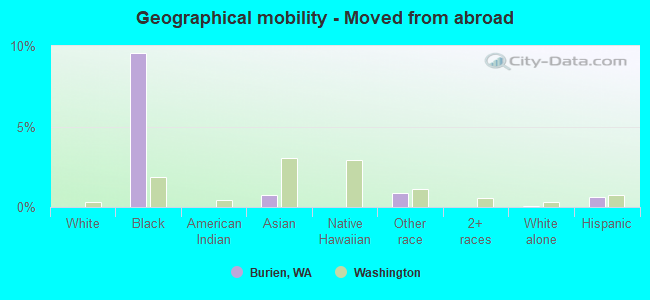
Geographical mobility - Moved from abroad (%)
Geographical mobility - Moved from abroad (%) - White
Geographical mobility - Moved from abroad (%) - Black or African American
Geographical mobility - Moved from abroad (%) - Asian
Geographical mobility - Moved from abroad (%) - Hispanic or Latino
Geographical mobility - Moved from abroad (%) - American Indian and Alaska Native
Geographical mobility - Moved from abroad (%) - Multirace
Geographical mobility - Moved from abroad (%) - Other Race
Place of birth for the foreign-born population - Ireland (%)
Place of birth for the foreign-born population - Denmark (%)
Place of birth for the foreign-born population - Norway (%)
Place of birth for the foreign-born population - Sweden (%)
Place of birth for the foreign-born population - United Kingdom (%)
Place of birth for the foreign-born population - England (%)
Place of birth for the foreign-born population - Scotland (%)
Place of birth for the foreign-born population - Other Northern Europe (%)
Place of birth for the foreign-born population - Austria (%)
Place of birth for the foreign-born population - Belgium (%)
Place of birth for the foreign-born population - France (%)
Place of birth for the foreign-born population - Germany (%)
Place of birth for the foreign-born population - Netherlands (%)
Place of birth for the foreign-born population - Switzerland (%)
Place of birth for the foreign-born population - Other Western Europe (%)
Place of birth for the foreign-born population - Greece (%)
Place of birth for the foreign-born population - Italy (%)
Place of birth for the foreign-born population - Portugal (%)
Place of birth for the foreign-born population - Spain (%)
Place of birth for the foreign-born population - Other Southern Europe (%)
Place of birth for the foreign-born population - Albania (%)
Place of birth for the foreign-born population - Belarus (%)
Place of birth for the foreign-born population - Bosnia and Herzegovina (%)
Place of birth for the foreign-born population - Bulgaria (%)
Place of birth for the foreign-born population - Croatia (%)
Place of birth for the foreign-born population - Czechoslovakia (%)
Place of birth for the foreign-born population - Hungary (%)
Place of birth for the foreign-born population - Latvia (%)
Place of birth for the foreign-born population - Lithuania (%)
Place of birth for the foreign-born population - North Macedonia (Macedonia) (%)
Place of birth for the foreign-born population - Moldova (%)
Place of birth for the foreign-born population - Poland (%)
Place of birth for the foreign-born population - Romania (%)
Place of birth for the foreign-born population - Russia (%)
Place of birth for the foreign-born population - Serbia (%)
Place of birth for the foreign-born population - Ukraine (%)
Place of birth for the foreign-born population - Other Eastern Europe (%)
Place of birth for the foreign-born population - China (%)
Place of birth for the foreign-born population - Hong Kong (%)
Place of birth for the foreign-born population - Taiwan (%)
Place of birth for the foreign-born population - Japan (%)
Place of birth for the foreign-born population - Korea (%)
Place of birth for the foreign-born population - Other Eastern Asia (%)
Place of birth for the foreign-born population - Afghanistan (%)
Place of birth for the foreign-born population - Bangladesh (%)
Place of birth for the foreign-born population - India (%)
Place of birth for the foreign-born population - Iran (%)
Place of birth for the foreign-born population - Kazakhstan (%)
Place of birth for the foreign-born population - Nepal (%)
Place of birth for the foreign-born population - Pakistan (%)
Place of birth for the foreign-born population - Sri Lanka (%)
Place of birth for the foreign-born population - Uzbekistan (%)
Place of birth for the foreign-born population - Other South Central Asia (%)
Place of birth for the foreign-born population - Burma (%)
Place of birth for the foreign-born population - Cambodia (%)
Place of birth for the foreign-born population - Indonesia (%)
Place of birth for the foreign-born population - Laos (%)
Place of birth for the foreign-born population - Malaysia (%)
Place of birth for the foreign-born population - Philippines (%)
Place of birth for the foreign-born population - Singapore (%)
Place of birth for the foreign-born population - Thailand (%)
Place of birth for the foreign-born population - Vietnam (%)
Place of birth for the foreign-born population - Other South Eastern Asia (%)
Place of birth for the foreign-born population - Armenia (%)
Place of birth for the foreign-born population - Iraq (%)
Place of birth for the foreign-born population - Israel (%)
Place of birth for the foreign-born population - Jordan (%)
Place of birth for the foreign-born population - Kuwait (%)
Place of birth for the foreign-born population - Lebanon (%)
Place of birth for the foreign-born population - Saudi Arabia (%)
Place of birth for the foreign-born population - Syria (%)
Place of birth for the foreign-born population - Turkey (%)
Place of birth for the foreign-born population - Yemen (%)
Place of birth for the foreign-born population - Other Western Asia (%)
Place of birth for the foreign-born population - Eritrea (%)
Place of birth for the foreign-born population - Ethiopia (%)
Place of birth for the foreign-born population - Kenya (%)
Place of birth for the foreign-born population - Somalia (%)
Place of birth for the foreign-born population - Uganda (%)
Place of birth for the foreign-born population - Zimbabwe (%)
Place of birth for the foreign-born population - Other Eastern Africa (%)
Place of birth for the foreign-born population - Cameroon (%)
Place of birth for the foreign-born population - Congo (%)
Place of birth for the foreign-born population - Democratic Republic of Congo (Zaire) (%)
Place of birth for the foreign-born population - Other Middle Africa (%)
Place of birth for the foreign-born population - Egypt (%)
Place of birth for the foreign-born population - Morocco (%)
Place of birth for the foreign-born population - Sudan (%)
Place of birth for the foreign-born population - Other Northern Africa (%)
Place of birth for the foreign-born population - South Africa (%)
Place of birth for the foreign-born population - Other Southern Africa (%)
Place of birth for the foreign-born population - Cabo Verde (%)
Place of birth for the foreign-born population - Ghana (%)
Place of birth for the foreign-born population - Liberia (%)
Place of birth for the foreign-born population - Nigeria (%)
Place of birth for the foreign-born population - Senegal (%)
Place of birth for the foreign-born population - Sierra Leone (%)
Place of birth for the foreign-born population - Other Western Africa (%)
Place of birth for the foreign-born population - Australia (%)
Place of birth for the foreign-born population - New Zealand (%)
Place of birth for the foreign-born population - Fiji (%)
Place of birth for the foreign-born population - Micronesia (%)
Place of birth for the foreign-born population - Bahamas (%)
Place of birth for the foreign-born population - Barbados (%)
Place of birth for the foreign-born population - Cuba (%)
Place of birth for the foreign-born population - Dominica (%)
Place of birth for the foreign-born population - Dominican Republic (%)
Place of birth for the foreign-born population - Grenada (%)
Place of birth for the foreign-born population - Haiti (%)
Place of birth for the foreign-born population - Jamaica (%)
Place of birth for the foreign-born population - St. Vincent and the Grenadines (%)
Place of birth for the foreign-born population - Trinidad and Tobago (%)
Place of birth for the foreign-born population - West Indies (%)
Place of birth for the foreign-born population - Other Caribbean (%)
Place of birth for the foreign-born population - Belize (%)
Place of birth for the foreign-born population - Costa Rica (%)
Place of birth for the foreign-born population - El Salvador (%)
Place of birth for the foreign-born population - Guatemala (%)
Place of birth for the foreign-born population - Honduras (%)
Place of birth for the foreign-born population - Mexico (%)
Place of birth for the foreign-born population - Nicaragua (%)
Place of birth for the foreign-born population - Panama (%)
Place of birth for the foreign-born population - Other Central America (%)
Place of birth for the foreign-born population - Argentina (%)
Place of birth for the foreign-born population - Bolivia (%)
Place of birth for the foreign-born population - Brazil (%)
Place of birth for the foreign-born population - Chile (%)
Place of birth for the foreign-born population - Colombia (%)
Place of birth for the foreign-born population - Ecuador (%)
Place of birth for the foreign-born population - Guyana (%)
Place of birth for the foreign-born population - Peru (%)
Place of birth for the foreign-born population - Uruguay (%)
Place of birth for the foreign-born population - Venezuela (%)
Place of birth for the foreign-born population - Other South America (%)
Place of birth for the foreign-born population - Canada (%)
Place of birth for the foreign-born population - Other Northern America (%)
Place of birth for the foreign-born population - Other (%)
Latest news about races in Burien, WA collected exclusively by city-data.com from local newspapers, TV, and radio stations
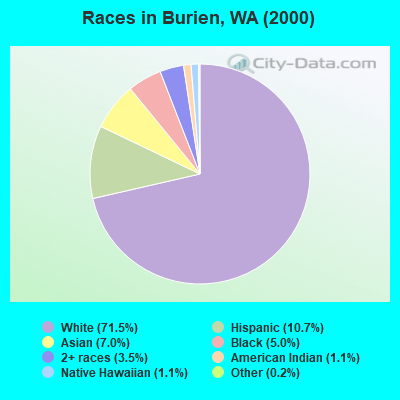
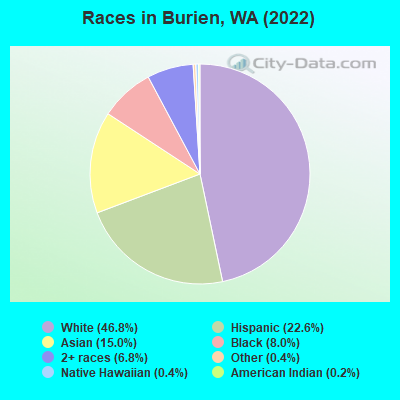
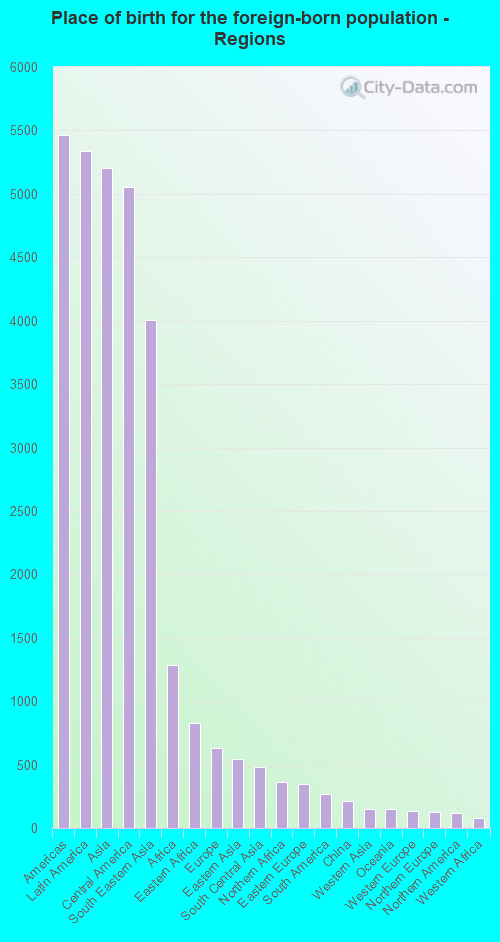
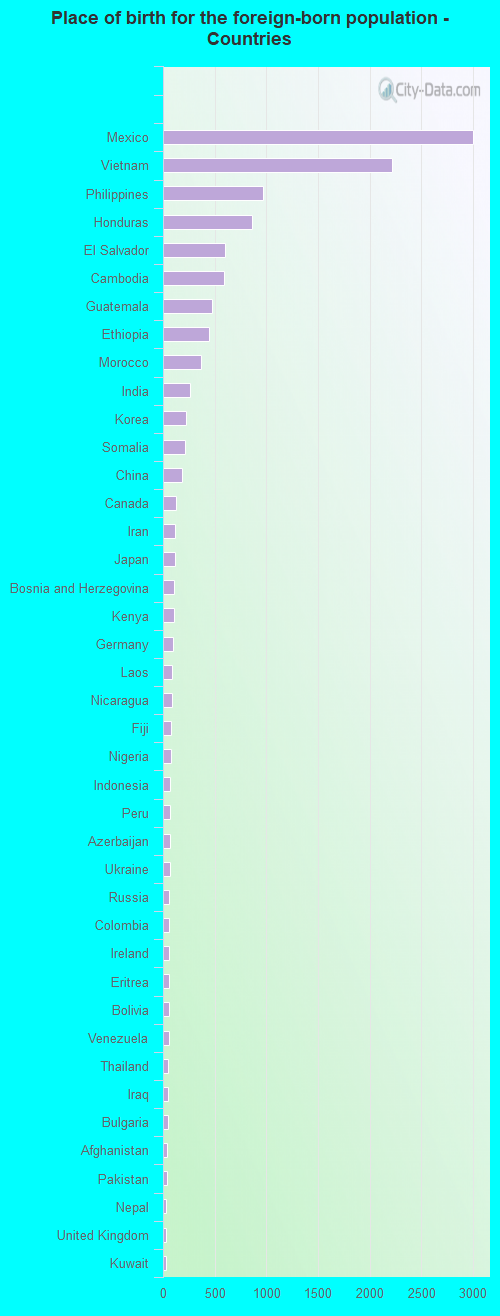
According to 2022 data, the most numerous races in Burien, WA are White alone (24,241 residents), Hispanic (11,712 residents), and Asian alone (7,791 residents). 66.4% of Burien residents speak English at home. 24.6% of Burien, WA residents are foreign-born (9.9% born in Latin America, 9.6% born in Asia), which is 39.0% greater than the foreign-born rate of 15.0% across the entire state of Washington.
Race distribution in Burien
2000 2022
22,799 71.5% White alone 3,397 10.7% Hispanic 2,219 7.0% Asian alone 1,587 5.0% Black alone 1,110 3.5% Two or more races 364 1.1% American Indian alone 353 1.1% Native Hawaiian and Other 52 0.2% Other race alone
24,241 46.8% White alone 11,712 22.6% Hispanic 7,791 15.0% Asian alone 4,151 8.0% Black alone 3,526 6.8% Two or more races 184 0.4% Native Hawaiian and Other 185 0.4% Other race alone 117 0.2% American Indian alone
2000 2022
4,652,490 78.9% White alone 441,509 7.5% Hispanic 319,401 5.4% Asian alone 184,631 3.1% Black alone 175,926 3.0% Two or more races 85,396 1.4% American Indian alone 22,779 0.4% Native Hawaiian and Other 11,989 0.2% Other race alone
4,941,456 63.5% White alone 1,093,313 14.0% Hispanic 755,832 9.7% Asian alone 523,448 6.7% Two or more races 299,537 3.8% Black alone 69,024 0.9% American Indian alone 52,231 0.7% Native Hawaiian and Other 50,945 0.7% Other race alone
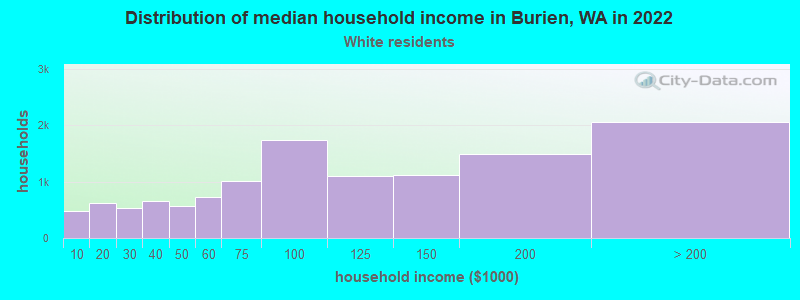
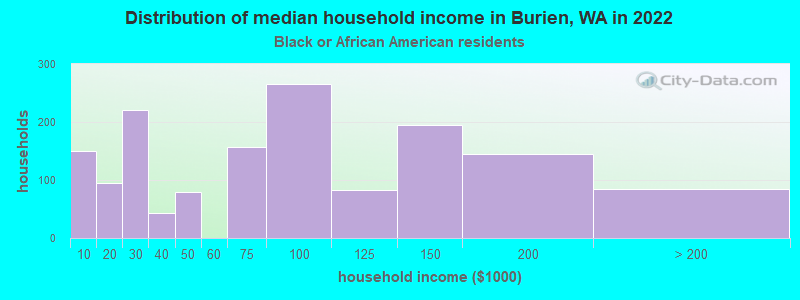
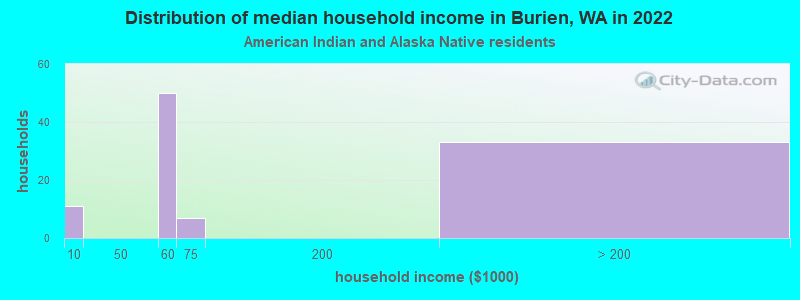
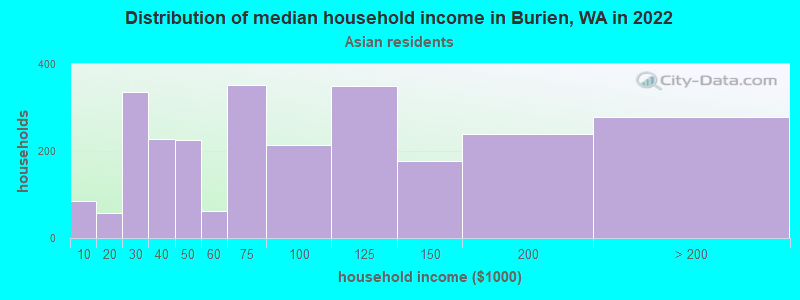
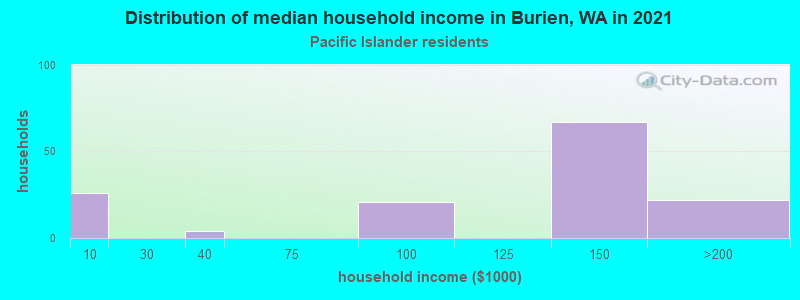
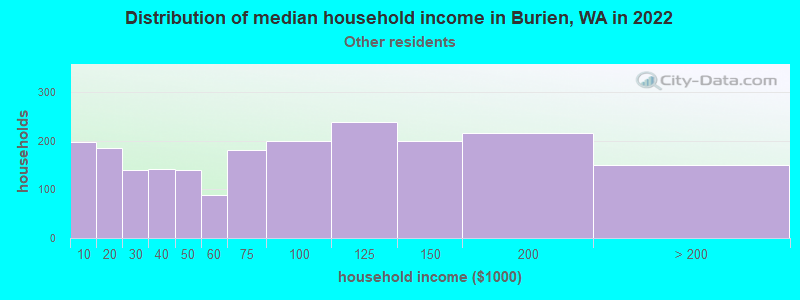
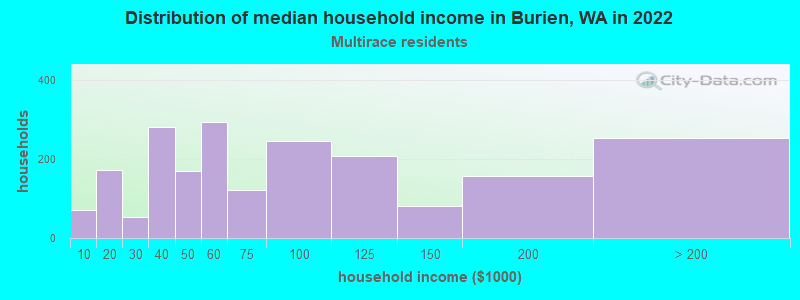
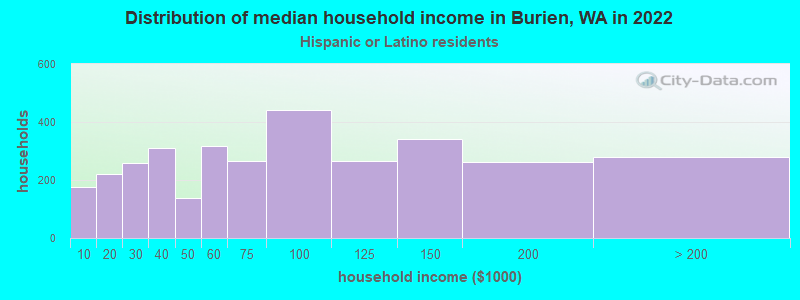
Income and house value in Burien Median household income in 2022 $95,848 White non-Hispanic householders$75,043 Black householders$70,783 American Indian and Alaska Native householders$80,416 Asian householders$74,636 Some other race householders$68,626 Two or more races householders$74,101 Hispanic or Latino race householdersMedian 2022 house value $654,085 White Non-Hispanic householders$913,110 Black or African American householders$667,874 American Indian or Alaska Native householders $669,365 Asian householders$640,667 Native Hawaiian and other Pacific Islander householders$638,059 Some other race householders$596,316 Two or more races householders$619,796 Hispanic or Latino householders
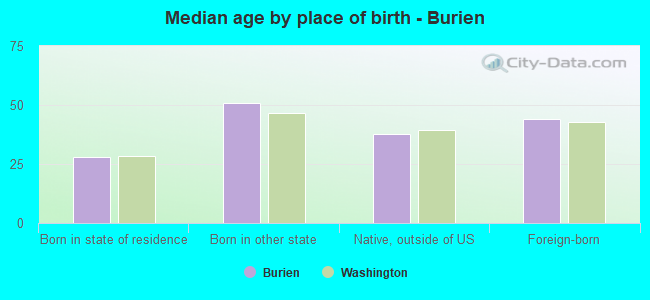
Median age by race in Burien
46.9 Median age for White residents45.1 49.8 35.0 Median age for Black or African American residents31.6 40.7 30.6 Median age for American Indian / Alaska Native residents51.5 29.8 40.0 Median age for Asian residents39.9 39.8 52.3 Median age for Native Hawaiian / Pacific Islander residents63.7 44.2 30.5 Median age for Other race residents29.3 31.3 29.2 Median age for Two or more races residents29.6 28.5 47.8 Median age for White alone residents45.3 50.7 30.4 Median age for Hispanic or Latino residents30.6 30.2
Owner/renter occupied households by race in Burien
House owners and renters - White residents 8,361 68.6% Owner occupied3,825 31.4% Renter occupiedHouse owners and renters - Black or African American residents 444 29.2% Owner occupied1,076 70.8% Renter occupiedHouse owners and renters - American Indian / Alaska Native residents 9 6.9% Owner occupied118 93.1% Renter occupiedHouse owners and renters - Asian residents 1,443 57.0% Owner occupied1,087 43.0% Renter occupiedHouse owners and renters - Native Hawaiian / Pacific Islander residents 39 51.0% Owner occupied37 49.0% Renter occupiedHouse owners and renters - Other race residents 380 18.1% Owner occupied1,723 81.9% Renter occupiedHouse owners and renters - Two or more races residents 738 35.5% Owner occupied1,338 64.5% Renter occupiedHouse owners and renters - White alone residents 8,285 70.4% Owner occupied3,491 29.6% Renter occupiedHouse owners and renters - Hispanic or Latino residents 768 23.6% Owner occupied2,482 76.4% Renter occupied
Language usage in Burien
English speakers - Total 66.4% of residents of Burien speak English at home.
17.0% of residents speak Spanish at home 3,556 42.8% Speak English very well4,761 57.2% Speak English less than very well16.6% of residents speak other language at home 4,406 54.1% Speak English very well3,742 45.9% Speak English less than very well
English speakers - Born in the United States 91.0% of residents of Burien speak English at home.
7.9% of residents speak Spanish at home 859 81.0% Speak English very well201 19.0% Speak English less than very well1.5% of residents speak other language at home 178 89.4% Speak English very well21 10.6% Speak English less than very well
English speakers - Native, born elsewhere 71.6% of residents of Burien speak English at home.
17.9% of residents speak Spanish at home 147 87.0% Speak English very well22 13.0% Speak English less than very well9.6% of residents speak other language at home 77 84.6% Speak English very well14 15.4% Speak English less than very well
English speakers - Foreign-born 10.3% of residents of Burien speak English at home.
38.5% of residents speak Spanish at home 768 15.8% Speak English very well4,097 84.2% Speak English less than very well49.4% of residents speak other language at home 2,688 43.1% Speak English very well3,552 56.9% Speak English less than very well
White (Caucasian) - Speak only English Native:
96.5% (22,140)Foreign-born:
29.8% (423)
White (Caucasian) - Speak another language Native:
3.6% (819)Foreign-born:
70.3% (996)
Black or African American - Speak only English Native:
84.4% (2,367)Foreign-born:
6.5% (84)
Black or African American - Speak another language Native:
15.6% (436)Foreign-born:
91.9% (1,178)
American Indian / Alaska Native - Speak another language Native:
68.4% (138)Foreign-born:
100.0% (31)
Asian - Speak only English Native:
62.0% (1,630)Foreign-born:
12.1% (596)
Asian - Speak another language Native:
37.1% (976)Foreign-born:
87.9% (4,311)
Native Hawaiian / Pacific Islander - Speak another language Native:
48.5% (36)Foreign-born:
95.7% (115)
Other race - Speak only English Native:
24.8% (805)Foreign-born:
1.8% (79)
Other race - Speak another language Native:
74.3% (2,413)Foreign-born:
99.3% (4,250)
Two or more races - Speak only English Native:
88.7% (4,341)Foreign-born:
12.4% (141)
Two or more races - Speak another language Native:
10.3% (503)Foreign-born:
87.7% (995)
White alone - Speak only English Native:
98.5% (21,842)Foreign-born:
39.1% (377)
White alone - Speak another language Native:
1.2% (260)Foreign-born:
59.8% (577)
Hispanic or Latino - Speak only English Native:
43.5% (2,481)Foreign-born:
3.3% (170)
Hispanic or Latino - Speak another language Native:
57.2% (3,263)Foreign-born:
97.0% (4,946)
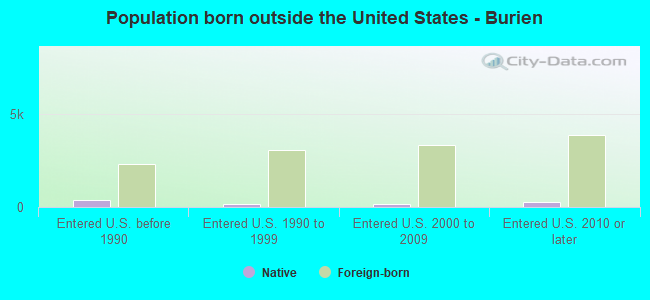
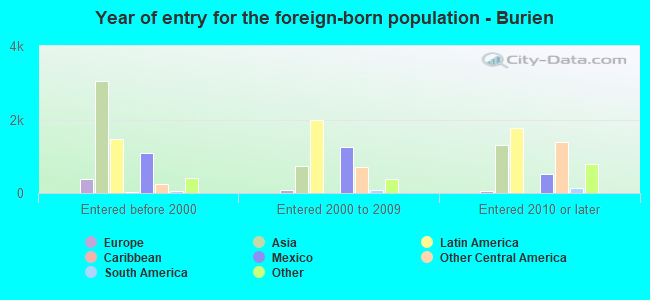
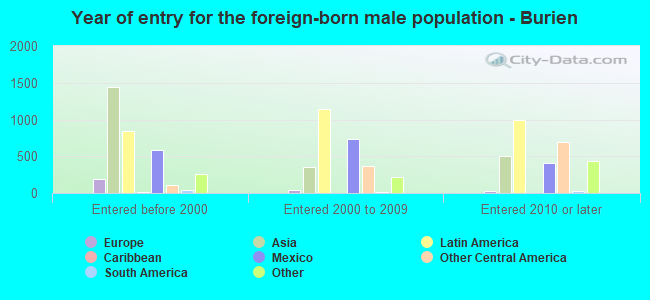
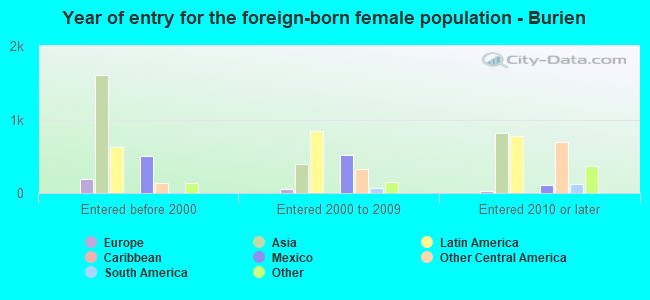
Foreign-born residents in Burien 12,738 residents are foreign born (9.9% Latin America , 9.6% Asia ).
This city:
24.6%Washington:
14.9%
Marital status for residents in Burien Marital status - White (Caucasian) population 15 years and over
Males 33.2% Never married49.2% Now married1.3% Separated2.5% Widowed13.9% DivorcedFemales 26.3% Never married45.7% Now married1.4% Separated10.7% Widowed15.8% DivorcedWomen who gave birth in the past 12 months Now married:
82.1% (318)Unmarried:
17.9% (69)
Women who did not give birth in the past 12 months Now married:
43.9% (1,985)Unmarried:
56.1% (2,538)
Marital status - Black or African American population 15 years and over
Males 57.2% Never married32.5% Now married4.8% Separated1.5% Widowed4.0% DivorcedFemales 42.2% Never married32.9% Now married7.5% Separated7.2% Widowed10.2% DivorcedWomen who gave birth in the past 12 months Now married:
80.8% (86)Unmarried:
19.2% (20)
Women who did not give birth in the past 12 months Now married:
27.6% (187)Unmarried:
72.4% (490)
Marital status - American Indian / Alaska Native population 15 years and over
Males 33.3% Never married33.3% Now married11.8% Separated0.0% Widowed21.5% DivorcedFemales 19.7% Never married80.3% Now married0.0% Separated0.0% Widowed0.0% DivorcedWomen who did not give birth in the past 12 months Now married:
75.7% (93)Unmarried:
24.3% (30)
Marital status - Asian population 15 years and over
Males 28.8% Never married56.8% Now married1.3% Separated2.2% Widowed10.9% DivorcedFemales 24.0% Never married49.6% Now married7.1% Separated4.6% Widowed14.7% DivorcedWomen who gave birth in the past 12 months Now married:
79.3% (131)Unmarried:
20.7% (34)
Women who did not give birth in the past 12 months Now married:
54.0% (1,122)Unmarried:
46.0% (954)
Marital status - Native Hawaiian / Pacific Islander population 15 years and over
Males 16.7% Never married83.3% Now married0.0% Separated0.0% Widowed0.0% DivorcedFemales 35.6% Never married64.4% Now married0.0% Separated0.0% Widowed0.0% DivorcedWomen who did not give birth in the past 12 months Now married:
46.2% (19)Unmarried:
53.8% (23)
Marital status - Other race population 15 years and over
Males 50.5% Never married39.4% Now married8.6% Separated0.0% Widowed1.5% DivorcedFemales 43.4% Never married41.8% Now married3.1% Separated3.2% Widowed8.4% DivorcedWomen who gave birth in the past 12 months Now married:
100.0% (106)Unmarried:
0.0% (0)
Women who did not give birth in the past 12 months Now married:
42.1% (837)Unmarried:
57.9% (1,149)
Marital status - Two or more races population 15 years and over
Males 58.0% Never married34.4% Now married0.0% Separated0.0% Widowed7.7% DivorcedFemales 44.0% Never married31.8% Now married6.0% Separated5.2% Widowed13.0% DivorcedWomen who gave birth in the past 12 months Now married:
0.0% (0)Unmarried:
100.0% (50)
Women who did not give birth in the past 12 months Now married:
33.6% (531)Unmarried:
66.4% (1,050)
Marital status - White alone, not Hispanic / Latino population 15 years and over
Males 33.0% Never married49.5% Now married1.0% Separated2.6% Widowed13.9% DivorcedFemales 25.9% Never married46.4% Now married1.2% Separated10.9% Widowed15.6% DivorcedWomen who gave birth in the past 12 months Now married:
82.1% (328)Unmarried:
17.9% (71)
Women who did not give birth in the past 12 months Now married:
43.3% (1,832)Unmarried:
56.7% (2,395)
Marital status - Hispanic or Latino population 15 years and over
Males 50.0% Never married40.3% Now married6.1% Separated0.1% Widowed3.4% DivorcedFemales 41.4% Never married36.4% Now married5.0% Separated5.4% Widowed11.8% DivorcedWomen who gave birth in the past 12 months Now married:
84.3% (89)Unmarried:
15.7% (17)
Women who did not give birth in the past 12 months Now married:
40.2% (1,159)Unmarried:
59.8% (1,722)
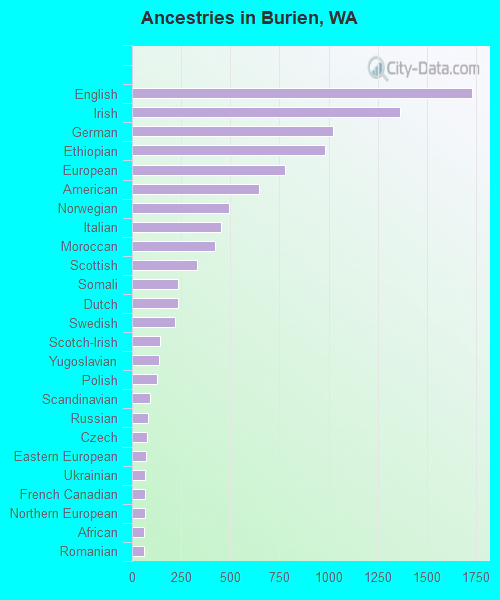
Ancestries in Burien
1,730 6.7% English1,364 5.3% Irish1,025 4.0% German980 3.8% Ethiopian777 3.0% European645 2.5% American492 1.9% Norwegian454 1.8% Italian423 1.6% Moroccan330 1.3% Scottish236 0.9% Somali233 0.9% Dutch219 0.9% Swedish144 0.6% Scotch-Irish135 0.5% Yugoslavian128 0.5% Polish93 0.4% Scandinavian82 0.3% Russian77 0.3% Czech69 0.3% Eastern European68 0.3% Ukrainian68 0.3% French Canadian68 0.3% Northern European63 0.2% African63 0.2% Romanian63 0.2% Iranian49 0.2% Portuguese49 0.2% Afghan44 0.2% Danish38 0.1% Arab36 0.1% British36 0.1% Slovene33 0.1% Nigerian31 0.1% Croatian30 0.1% Belgian29 0.1% Austrian26 0.1% Greek22 0.09% Belizean21 0.08% Bulgarian21 0.08% Australian14 0.05% French14 0.05% Hungarian13 0.05% Lithuanian11 0.04% Slovak10 0.04% Icelander9 0.03% Finnish9 0.03% Canadian8 0.03% Kenyan8 0.03% Armenian3 0.01% Pennsylvania German
Geographical mobility in Burien Same house 1 year ago 22,430 89.4% White (Caucasian)2,960 69.2% Black or African American226 96.7% American Indian / Alaska Native7,067 90.4% Asian124 68.9% Native Hawaiian / Pacific Islander6,400 80.9% Other race5,335 82.7% Two or more races21,273 89.3% White alone, not Hispanic / Latino9,628 83.8% Hispanic or LatinoMoved within same county 2,124 8.5% White / Caucasian610 14.3% Black or African American497 6.4% Asian45 24.7% Native Hawaiian / Pacific Islander1,101 13.9% Other race636 9.9% Two or more races1,985 8.3% White alone, not Hispanic / Latino1,419 12.4% Hispanic or LatinoMoved within same state 511 2.0% White / Caucasian11 0.3% Black or African American68 0.9% Asian23 0.3% Other race28 0.4% Two or more races526 2.2% White alone, not Hispanic / Latino21 0.2% Hispanic or LatinoMoved from different state 120 0.5% White / Caucasian296 6.9% Black or African American66 0.8% Asian6 3.2% Native Hawaiian / Pacific Islander270 3.4% Other race364 5.6% Two or more races123 0.5% White alone, not Hispanic / Latino316 2.8% Hispanic or LatinoMoved from abroad 7 0.0% White410 9.6% Black or African American56 0.7% Asian71 0.9% Other race8 0.0% White alone, not Hispanic / Latino75 0.6% Hispanic or Latino
Children Nativity (place of birth) in Burien
Children under 6 years - Living with two parents Both parents native 995 100.0% NativeBoth parents foreign-born 659 98.9% Native8 1.1% Foreign-bornOne native, one foreign-born parent 460 100.0% NativeChildren under 6 years - Living with one parent Native parent 608 100.0% NativeForeign-born parent 322 68.3% Native149 31.7% Foreign-bornChildren 6 to 17 years - Living with two parents Both parents native 1,457 100.0% NativeBoth parents foreign-born 1,432 84.1% Native271 15.9% Foreign-bornOne native, one foreign-born parent 705 98.6% Native10 1.4% Foreign-bornChildren 6 to 17 years - Living with one parent Native parent 1,508 100.0% NativeForeign-born parent 1,147 56.2% Native895 43.8% Foreign-born
Grandparents responsible for own grandchildren in Burien
Grandparents (30 to 59 years) White / Caucasian 27 13.8% Responsible for grandchildren166 86.2% Not responsible for grandchildrenAsian 81 100.0% Not responsible for grandchildrenOther race 10 29.8% Responsible for grandchildren24 70.2% Not responsible for grandchildrenTwo or more races 50 40.9% Responsible for grandchildren73 59.1% Not responsible for grandchildrenWhite alone, not Hispanic / Latino 23 12.2% Responsible for grandchildren167 87.8% Not responsible for grandchildrenHispanic or Latino 73 43.2% Responsible for grandchildren96 56.8% Not responsible for grandchildrenGrandparents (60 years and over) White / Caucasian 86 48.1% Responsible for grandchildren93 51.9% Not responsible for grandchildrenAsian 25 6.6% Responsible for grandchildren357 93.4% Not responsible for grandchildrenOther race 84 100.0% Not responsible for grandchildrenTwo or more races 30 100.0% Not responsible for grandchildrenWhite alone, not Hispanic / Latino 86 61.9% Responsible for grandchildren53 38.1% Not responsible for grandchildrenHispanic or Latino 152 100.0% Not responsible for grandchildren