Races in Cedar Hill, Texas (TX) Detailed Stats
Data:
Races - White alone (%)
Races - White alone (% change since 2000)
Races - Black alone (%)
Races - Black alone (% change since 2000)
Races - American Indian alone (%)
Races - American Indian alone (% change since 2000)
Races - Asian alone (%)
Races - Asian alone (% change since 2000)
Races - Hispanic (%)
Races - Hispanic (% change since 2000)
Races - Native Hawaiian and Other Pacific Islander alone (%)
Races - Native Hawaiian and Other Pacific Islander alone (% change since 2000)
Races - Two or more races(%)
Races - Two or more races(% change since 2000)
Races - Other race alone (%)
Races - Other race alone (% change since 2000)
Racial diversity
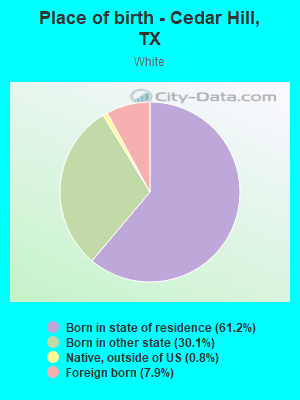
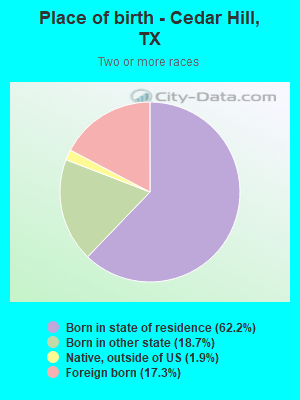
Place of birth - Born in state of residence (%)
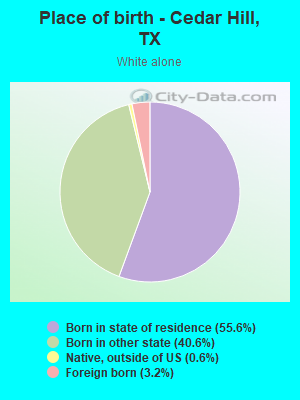
Place of birth - Born in state of residence (%) - White
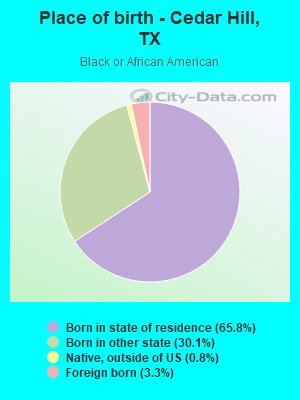
Place of birth - Born in state of residence (%) - Black or African American
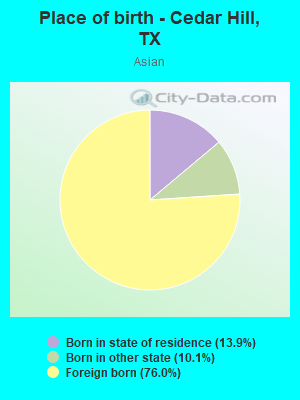
Place of birth - Born in state of residence (%) - Asian
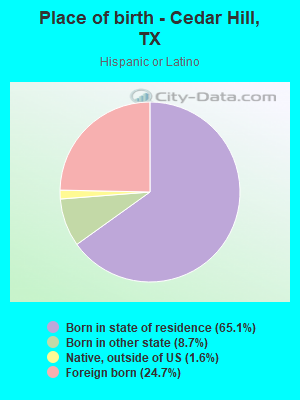
Place of birth - Born in state of residence (%) - Hispanic or Latino
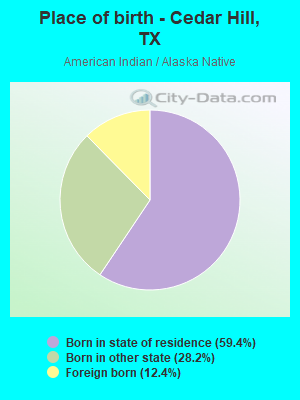
Place of birth - Born in state of residence (%) - American Indian and Alaska Native
Place of birth - Born in state of residence (%) - Multirace
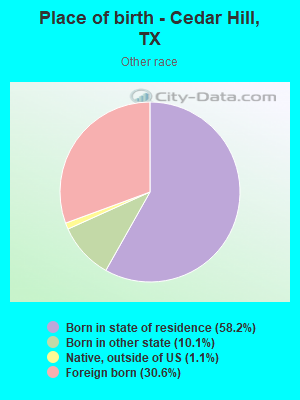
Place of birth - Born in state of residence (%) - Other Race
Place of birth - Born in other state (%)
Place of birth - Born in other state (%) - White
Place of birth - Born in other state (%) - Black or African American
Place of birth - Born in other state (%) - Asian
Place of birth - Born in other state (%) - Hispanic or Latino
Place of birth - Born in other state (%) - American Indian and Alaska Native
Place of birth - Born in other state (%) - Multirace
Place of birth - Born in other state (%) - Other Race
Place of birth - Native, outside of US (%)
Place of birth - Native, outside of US (%) - White
Place of birth - Native, outside of US (%) - Black or African American
Place of birth - Native, outside of US (%) - Asian
Place of birth - Native, outside of US (%) - Hispanic or Latino
Place of birth - Native, outside of US (%) - American Indian and Alaska Native
Place of birth - Native, outside of US (%) - Multirace
Place of birth - Native, outside of US (%) - Other Race
Place of birth - Foreign born (%)
Place of birth - Foreign born (%) - White
Place of birth - Foreign born (%) - Black or African American
Place of birth - Foreign born (%) - Asian
Place of birth - Foreign born (%) - Hispanic or Latino
Place of birth - Foreign born (%) - American Indian and Alaska Native
Place of birth - Foreign born (%) - Multirace
Place of birth - Foreign born (%) - Other Race
Residents speaking English at home (%)
Residents speaking English at home - Born in the United States (%)
Residents speaking English at home - Native, born elsewhere (%)
Residents speaking English at home - Foreign born (%)
Residents speaking Spanish at home (%)
Residents speaking Spanish at home - Born in the United States (%)
Residents speaking Spanish at home - Native, born elsewhere (%)
Residents speaking Spanish at home - Foreign born (%)
Residents speaking other language at home (%)
Residents speaking other language at home - Born in the United States (%)
Residents speaking other language at home - Native, born elsewhere (%)
Residents speaking other language at home - Foreign born (%)
Marital status - Never married (%)
Marital status - Now married (%)
Marital status - Separated (%)
Marital status - Widowed (%)
Marital status - Divorced (%)
Ancestries Reported - Arab (%)
Ancestries Reported - Czech (%)
Ancestries Reported - Danish (%)
Ancestries Reported - Dutch (%)
Ancestries Reported - English (%)
Ancestries Reported - French (%)
Ancestries Reported - French Canadian (%)
Ancestries Reported - German (%)
Ancestries Reported - Greek (%)
Ancestries Reported - Hungarian (%)
Ancestries Reported - Irish (%)
Ancestries Reported - Italian (%)
Ancestries Reported - Lithuanian (%)
Ancestries Reported - Norwegian (%)
Ancestries Reported - Polish (%)
Ancestries Reported - Portuguese (%)
Ancestries Reported - Russian (%)
Ancestries Reported - Scotch-Irish (%)
Ancestries Reported - Scottish (%)
Ancestries Reported - Slovak (%)
Ancestries Reported - Subsaharan African (%)
Ancestries Reported - Swedish (%)
Ancestries Reported - Swiss (%)
Ancestries Reported - Ukrainian (%)
Ancestries Reported - United States (%)
Ancestries Reported - Welsh (%)
Ancestries Reported - West Indian (%)
Ancestries Reported - Other (%)
Geographical mobility - Same house 1 year ago (%)
Geographical mobility - Same house 1 year ago (%) - White
Geographical mobility - Same house 1 year ago (%) - Black or African American
Geographical mobility - Same house 1 year ago (%) - Asian
Geographical mobility - Same house 1 year ago (%) - Hispanic or Latino
Geographical mobility - Same house 1 year ago (%) - American Indian and Alaska Native
Geographical mobility - Same house 1 year ago (%) - Multirace
Geographical mobility - Same house 1 year ago (%) - Other Race
Geographical mobility - Moved within same county (%)
Geographical mobility - Moved within same county (%) - White
Geographical mobility - Moved within same county (%) - Black or African American
Geographical mobility - Moved within same county (%) - Asian
Geographical mobility - Moved within same county (%) - Hispanic or Latino
Geographical mobility - Moved within same county (%) - American Indian and Alaska Native
Geographical mobility - Moved within same county (%) - Multirace
Geographical mobility - Moved within same county (%) - Other Race
Geographical mobility - Moved from different county within same state (%)
Geographical mobility - Moved from different county within same state (%) - White
Geographical mobility - Moved from different county within same state (%) - Black or African American
Geographical mobility - Moved from different county within same state (%) - Asian
Geographical mobility - Moved from different county within same state (%) - Hispanic or Latino
Geographical mobility - Moved from different county within same state (%) - American Indian and Alaska Native
Geographical mobility - Moved from different county within same state (%) - Multirace
Geographical mobility - Moved from different county within same state (%) - Other Race
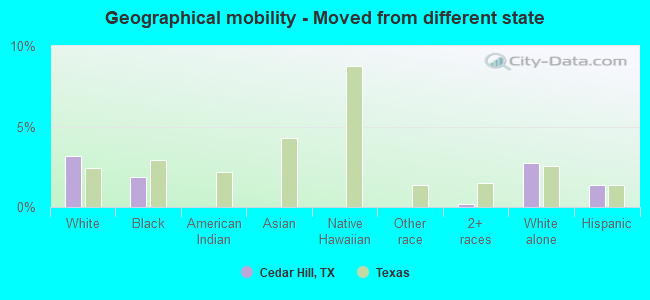
Geographical mobility - Moved from different state (%)
Geographical mobility - Moved from different state (%) - White
Geographical mobility - Moved from different state (%) - Black or African American
Geographical mobility - Moved from different state (%) - Asian
Geographical mobility - Moved from different state (%) - Hispanic or Latino
Geographical mobility - Moved from different state (%) - American Indian and Alaska Native
Geographical mobility - Moved from different state (%) - Multirace
Geographical mobility - Moved from different state (%) - Other Race
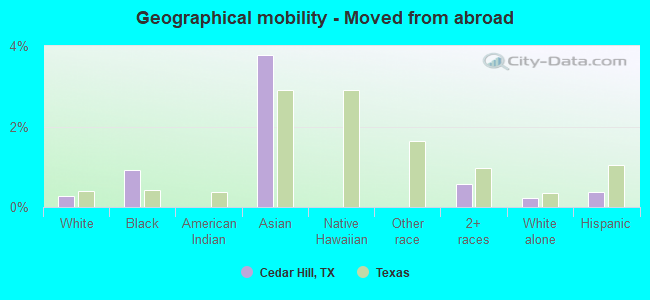
Geographical mobility - Moved from abroad (%)
Geographical mobility - Moved from abroad (%) - White
Geographical mobility - Moved from abroad (%) - Black or African American
Geographical mobility - Moved from abroad (%) - Asian
Geographical mobility - Moved from abroad (%) - Hispanic or Latino
Geographical mobility - Moved from abroad (%) - American Indian and Alaska Native
Geographical mobility - Moved from abroad (%) - Multirace
Geographical mobility - Moved from abroad (%) - Other Race
Place of birth for the foreign-born population - Ireland (%)
Place of birth for the foreign-born population - Denmark (%)
Place of birth for the foreign-born population - Norway (%)
Place of birth for the foreign-born population - Sweden (%)
Place of birth for the foreign-born population - United Kingdom (%)
Place of birth for the foreign-born population - England (%)
Place of birth for the foreign-born population - Scotland (%)
Place of birth for the foreign-born population - Other Northern Europe (%)
Place of birth for the foreign-born population - Austria (%)
Place of birth for the foreign-born population - Belgium (%)
Place of birth for the foreign-born population - France (%)
Place of birth for the foreign-born population - Germany (%)
Place of birth for the foreign-born population - Netherlands (%)
Place of birth for the foreign-born population - Switzerland (%)
Place of birth for the foreign-born population - Other Western Europe (%)
Place of birth for the foreign-born population - Greece (%)
Place of birth for the foreign-born population - Italy (%)
Place of birth for the foreign-born population - Portugal (%)
Place of birth for the foreign-born population - Spain (%)
Place of birth for the foreign-born population - Other Southern Europe (%)
Place of birth for the foreign-born population - Albania (%)
Place of birth for the foreign-born population - Belarus (%)
Place of birth for the foreign-born population - Bosnia and Herzegovina (%)
Place of birth for the foreign-born population - Bulgaria (%)
Place of birth for the foreign-born population - Croatia (%)
Place of birth for the foreign-born population - Czechoslovakia (%)
Place of birth for the foreign-born population - Hungary (%)
Place of birth for the foreign-born population - Latvia (%)
Place of birth for the foreign-born population - Lithuania (%)
Place of birth for the foreign-born population - North Macedonia (Macedonia) (%)
Place of birth for the foreign-born population - Moldova (%)
Place of birth for the foreign-born population - Poland (%)
Place of birth for the foreign-born population - Romania (%)
Place of birth for the foreign-born population - Russia (%)
Place of birth for the foreign-born population - Serbia (%)
Place of birth for the foreign-born population - Ukraine (%)
Place of birth for the foreign-born population - Other Eastern Europe (%)
Place of birth for the foreign-born population - China (%)
Place of birth for the foreign-born population - Hong Kong (%)
Place of birth for the foreign-born population - Taiwan (%)
Place of birth for the foreign-born population - Japan (%)
Place of birth for the foreign-born population - Korea (%)
Place of birth for the foreign-born population - Other Eastern Asia (%)
Place of birth for the foreign-born population - Afghanistan (%)
Place of birth for the foreign-born population - Bangladesh (%)
Place of birth for the foreign-born population - India (%)
Place of birth for the foreign-born population - Iran (%)
Place of birth for the foreign-born population - Kazakhstan (%)
Place of birth for the foreign-born population - Nepal (%)
Place of birth for the foreign-born population - Pakistan (%)
Place of birth for the foreign-born population - Sri Lanka (%)
Place of birth for the foreign-born population - Uzbekistan (%)
Place of birth for the foreign-born population - Other South Central Asia (%)
Place of birth for the foreign-born population - Burma (%)
Place of birth for the foreign-born population - Cambodia (%)
Place of birth for the foreign-born population - Indonesia (%)
Place of birth for the foreign-born population - Laos (%)
Place of birth for the foreign-born population - Malaysia (%)
Place of birth for the foreign-born population - Philippines (%)
Place of birth for the foreign-born population - Singapore (%)
Place of birth for the foreign-born population - Thailand (%)
Place of birth for the foreign-born population - Vietnam (%)
Place of birth for the foreign-born population - Other South Eastern Asia (%)
Place of birth for the foreign-born population - Armenia (%)
Place of birth for the foreign-born population - Iraq (%)
Place of birth for the foreign-born population - Israel (%)
Place of birth for the foreign-born population - Jordan (%)
Place of birth for the foreign-born population - Kuwait (%)
Place of birth for the foreign-born population - Lebanon (%)
Place of birth for the foreign-born population - Saudi Arabia (%)
Place of birth for the foreign-born population - Syria (%)
Place of birth for the foreign-born population - Turkey (%)
Place of birth for the foreign-born population - Yemen (%)
Place of birth for the foreign-born population - Other Western Asia (%)
Place of birth for the foreign-born population - Eritrea (%)
Place of birth for the foreign-born population - Ethiopia (%)
Place of birth for the foreign-born population - Kenya (%)
Place of birth for the foreign-born population - Somalia (%)
Place of birth for the foreign-born population - Uganda (%)
Place of birth for the foreign-born population - Zimbabwe (%)
Place of birth for the foreign-born population - Other Eastern Africa (%)
Place of birth for the foreign-born population - Cameroon (%)
Place of birth for the foreign-born population - Congo (%)
Place of birth for the foreign-born population - Democratic Republic of Congo (Zaire) (%)
Place of birth for the foreign-born population - Other Middle Africa (%)
Place of birth for the foreign-born population - Egypt (%)
Place of birth for the foreign-born population - Morocco (%)
Place of birth for the foreign-born population - Sudan (%)
Place of birth for the foreign-born population - Other Northern Africa (%)
Place of birth for the foreign-born population - South Africa (%)
Place of birth for the foreign-born population - Other Southern Africa (%)
Place of birth for the foreign-born population - Cabo Verde (%)
Place of birth for the foreign-born population - Ghana (%)
Place of birth for the foreign-born population - Liberia (%)
Place of birth for the foreign-born population - Nigeria (%)
Place of birth for the foreign-born population - Senegal (%)
Place of birth for the foreign-born population - Sierra Leone (%)
Place of birth for the foreign-born population - Other Western Africa (%)
Place of birth for the foreign-born population - Australia (%)
Place of birth for the foreign-born population - New Zealand (%)
Place of birth for the foreign-born population - Fiji (%)
Place of birth for the foreign-born population - Micronesia (%)
Place of birth for the foreign-born population - Bahamas (%)
Place of birth for the foreign-born population - Barbados (%)
Place of birth for the foreign-born population - Cuba (%)
Place of birth for the foreign-born population - Dominica (%)
Place of birth for the foreign-born population - Dominican Republic (%)
Place of birth for the foreign-born population - Grenada (%)
Place of birth for the foreign-born population - Haiti (%)
Place of birth for the foreign-born population - Jamaica (%)
Place of birth for the foreign-born population - St. Vincent and the Grenadines (%)
Place of birth for the foreign-born population - Trinidad and Tobago (%)
Place of birth for the foreign-born population - West Indies (%)
Place of birth for the foreign-born population - Other Caribbean (%)
Place of birth for the foreign-born population - Belize (%)
Place of birth for the foreign-born population - Costa Rica (%)
Place of birth for the foreign-born population - El Salvador (%)
Place of birth for the foreign-born population - Guatemala (%)
Place of birth for the foreign-born population - Honduras (%)
Place of birth for the foreign-born population - Mexico (%)
Place of birth for the foreign-born population - Nicaragua (%)
Place of birth for the foreign-born population - Panama (%)
Place of birth for the foreign-born population - Other Central America (%)
Place of birth for the foreign-born population - Argentina (%)
Place of birth for the foreign-born population - Bolivia (%)
Place of birth for the foreign-born population - Brazil (%)
Place of birth for the foreign-born population - Chile (%)
Place of birth for the foreign-born population - Colombia (%)
Place of birth for the foreign-born population - Ecuador (%)
Place of birth for the foreign-born population - Guyana (%)
Place of birth for the foreign-born population - Peru (%)
Place of birth for the foreign-born population - Uruguay (%)
Place of birth for the foreign-born population - Venezuela (%)
Place of birth for the foreign-born population - Other South America (%)
Place of birth for the foreign-born population - Canada (%)
Place of birth for the foreign-born population - Other Northern America (%)
Place of birth for the foreign-born population - Other (%)
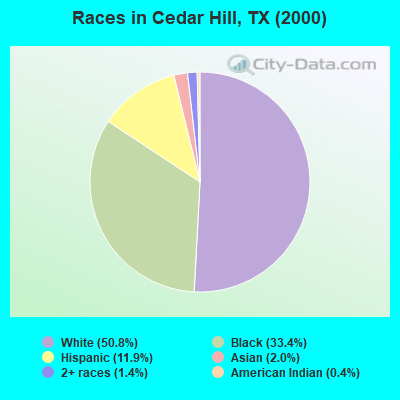
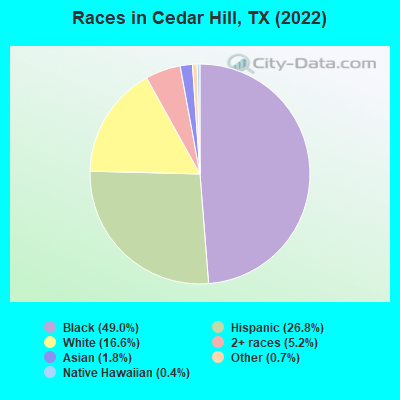
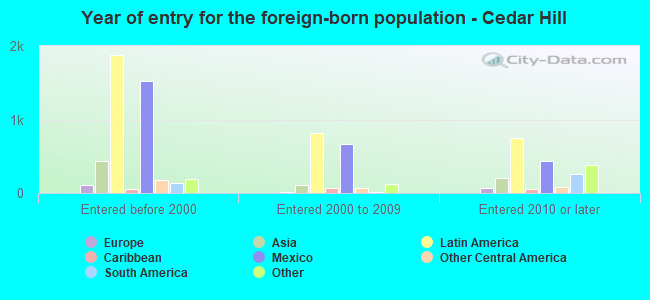
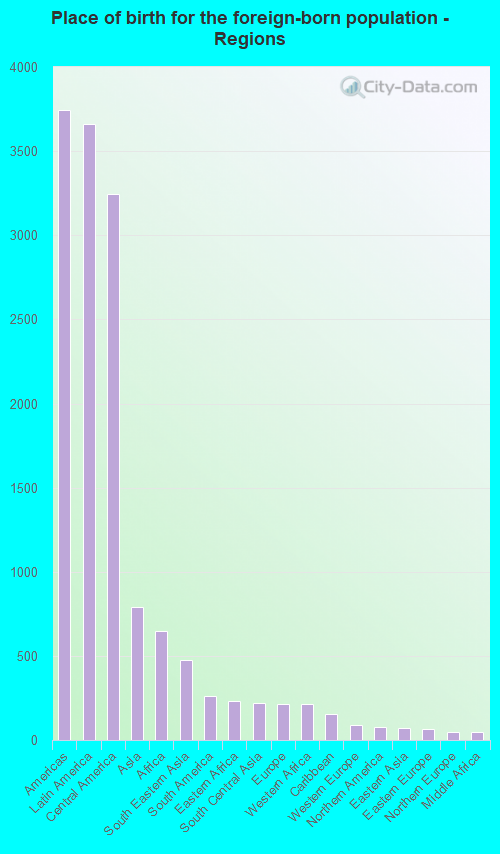
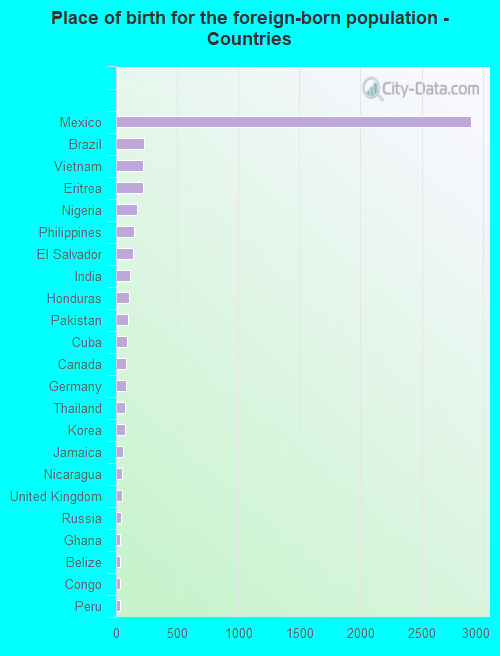
According to 2022 data, the most numerous races in Cedar Hill, TX are Hispanic (13,039 residents), White alone (8,069 residents), and Black alone (23,826 residents). 78.0% of Cedar Hill residents speak English at home. 11.1% of Cedar Hill, TX residents are foreign-born (7.3% born in Latin America, 1.6% born in Asia, 1.3% born in Africa), which is 52.9% less than the foreign-born rate of 17.0% across the entire state of Texas.
Race distribution in Cedar Hill
2000 2022
10,933,313 52.4% White alone 6,669,666 32.0% Hispanic 2,364,255 11.3% Black alone 554,445 2.7% Asian alone 230,567 1.1% Two or more races 68,859 0.3% American Indian alone 19,958 0.10% Other race alone 10,757 0.05% Native Hawaiian and Other
12,070,642 40.2% Hispanic 11,683,430 38.9% White alone 3,508,706 11.7% Black alone 1,608,173 5.4% Asian alone 956,560 3.2% Two or more races 125,763 0.4% Other race alone 47,023 0.2% American Indian alone 29,275 0.10% Native Hawaiian and Other
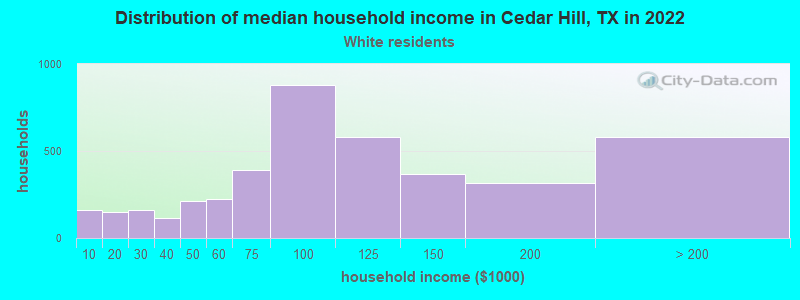
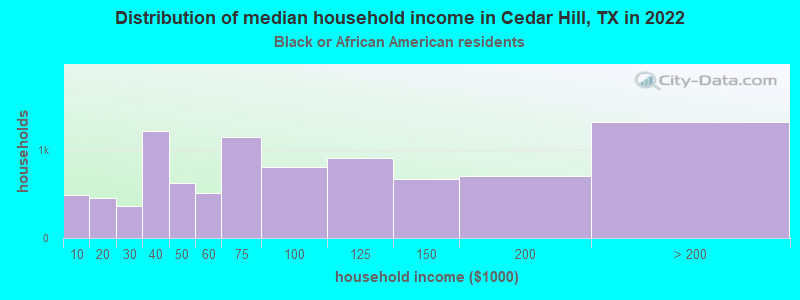
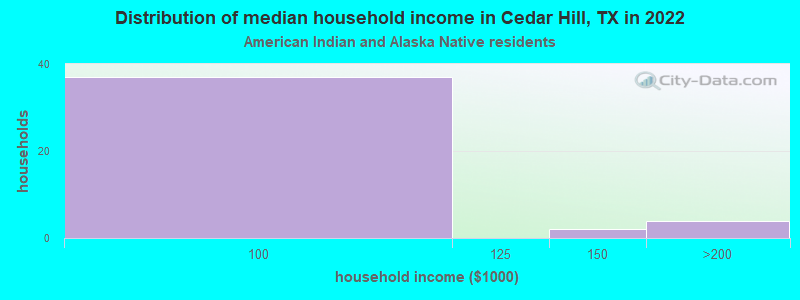
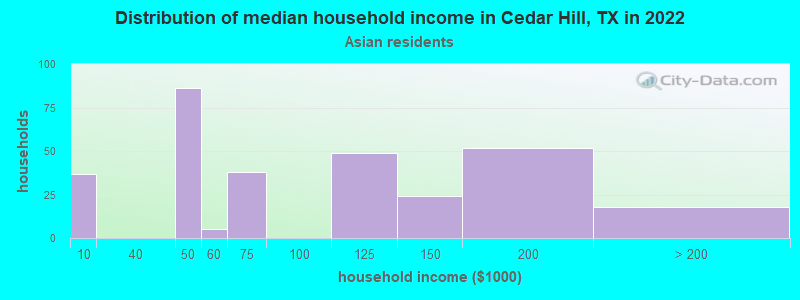
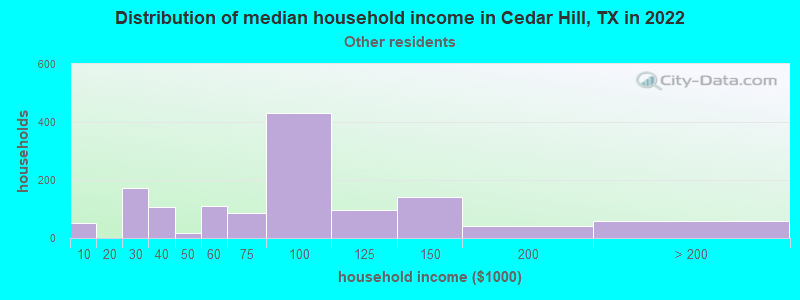
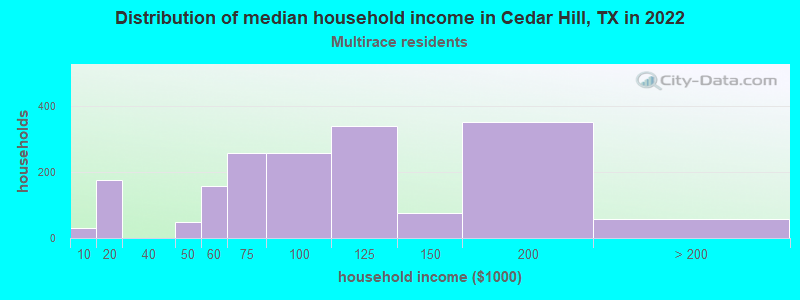
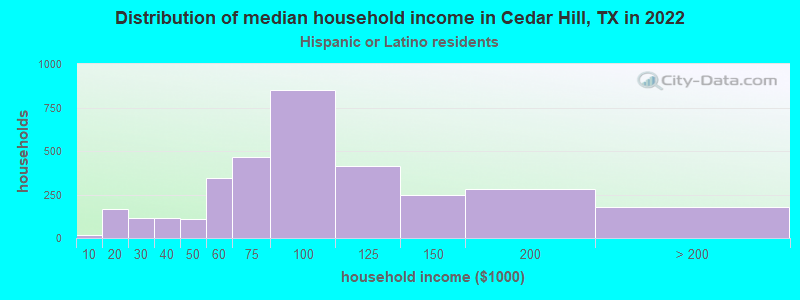
Income and house value in Cedar Hill Median household income in 2022 $92,215 White non-Hispanic householders$74,060 Black householders$89,531 American Indian and Alaska Native householders$74,278 Asian householders$91,015 Some other race householders$93,795 Two or more races householders$87,823 Hispanic or Latino race householdersMedian 2022 house value $288,943 White Non-Hispanic householders$293,165 Black or African American householders$196,047 American Indian or Alaska Native householders $274,767 Asian householders$274,465 Some other race householders$343,233 Two or more races householders$277,481 Hispanic or Latino householders
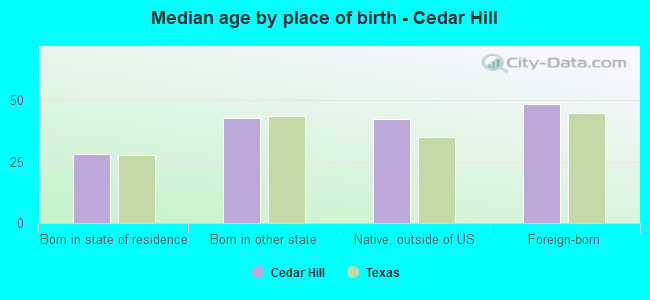
Median age by race in Cedar Hill
39.6 Median age for White residents37.8 41.4 37.8 Median age for Black or African American residents34.4 40.6 44.8 Median age for American Indian / Alaska Native residents40.3 62.5 47.2 Median age for Asian residents48.1 44.9 7.2 Median age for Native Hawaiian / Pacific Islander residents7.0 12.9 27.1 Median age for Other race residents28.2 25.8 25.8 Median age for Two or more races residents21.1 31.8 48.4 Median age for White alone residents46.4 50.2 27.0 Median age for Hispanic or Latino residents23.3 28.7
Owner/renter occupied households by race in Cedar Hill
House owners and renters - White residents 3,325 78.8% Owner occupied893 21.2% Renter occupiedHouse owners and renters - Black or African American residents 5,611 62.4% Owner occupied3,378 37.6% Renter occupiedHouse owners and renters - American Indian / Alaska Native residents 36 80.4% Owner occupied9 19.6% Renter occupiedHouse owners and renters - Asian residents 250 82.6% Owner occupied53 17.4% Renter occupiedHouse owners and renters - Native Hawaiian / Pacific Islander residents 26 100.0% Owner occupiedHouse owners and renters - Other race residents 1,067 83.1% Owner occupied217 16.9% Renter occupiedHouse owners and renters - Two or more races residents 1,359 77.7% Owner occupied391 22.3% Renter occupiedHouse owners and renters - White alone residents 2,790 78.2% Owner occupied776 21.8% Renter occupiedHouse owners and renters - Hispanic or Latino residents 2,507 76.6% Owner occupied765 23.4% Renter occupied
Language usage in Cedar Hill
English speakers - Total 78.0% of residents of Cedar Hill speak English at home.
17.7% of residents speak Spanish at home 5,182 63.6% Speak English very well2,964 36.4% Speak English less than very well4.5% of residents speak other language at home 1,310 64.0% Speak English very well736 36.0% Speak English less than very well
English speakers - Born in the United States 92.1% of residents of Cedar Hill speak English at home.
5.7% of residents speak Spanish at home 542 73.6% Speak English very well194 26.4% Speak English less than very well1.1% of residents speak other language at home 118 84.3% Speak English very well22 15.7% Speak English less than very well
English speakers - Native, born elsewhere 51.2% of residents of Cedar Hill speak English at home.
34.5% of residents speak Spanish at home 137 84.0% Speak English very well26 16.0% Speak English less than very well9.5% of residents speak other language at home 45 100.0% Speak English very well
English speakers - Foreign-born 6.7% of residents of Cedar Hill speak English at home.
60.6% of residents speak Spanish at home 916 29.4% Speak English very well2,200 70.6% Speak English less than very well32.1% of residents speak other language at home 941 57.1% Speak English very well708 42.9% Speak English less than very well
White (Caucasian) - Speak only English Native:
89.2% (9,221)Foreign-born:
11.1% (101)
White (Caucasian) - Speak another language Native:
11.8% (1,218)Foreign-born:
82.3% (748)
Black or African American - Speak only English Native:
98.6% (21,549)Foreign-born:
10.2% (84)
Black or African American - Speak another language Native:
1.5% (336)Foreign-born:
92.3% (758)
American Indian / Alaska Native - Speak another language Native:
38.8% (27)Foreign-born:
100.0% (10)
Asian - Speak only English Native:
63.1% (121)Foreign-born:
11.1% (75)
Asian - Speak another language Native:
34.6% (66)Foreign-born:
88.8% (599)
Native Hawaiian / Pacific Islander - Speak another language Native:
27.1% (46)Foreign-born:
100.0% (18)
Other race - Speak only English Native:
61.2% (1,807)Foreign-born:
0.7% (10)
Other race - Speak another language Native:
39.5% (1,167)Foreign-born:
99.4% (1,417)
Two or more races - Speak only English Native:
57.7% (3,222)Foreign-born:
4.1% (50)
Two or more races - Speak another language Native:
39.3% (2,192)Foreign-born:
95.7% (1,176)
White alone - Speak only English Native:
98.2% (7,540)Foreign-born:
30.9% (80)
White alone - Speak another language Native:
2.1% (165)Foreign-born:
68.6% (178)
Hispanic or Latino - Speak only English Native:
48.1% (4,342)Foreign-born:
2.9% (94)
Hispanic or Latino - Speak another language Native:
52.9% (4,776)Foreign-born:
96.7% (3,116)
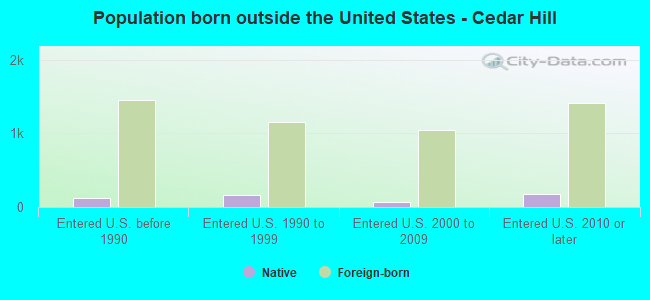
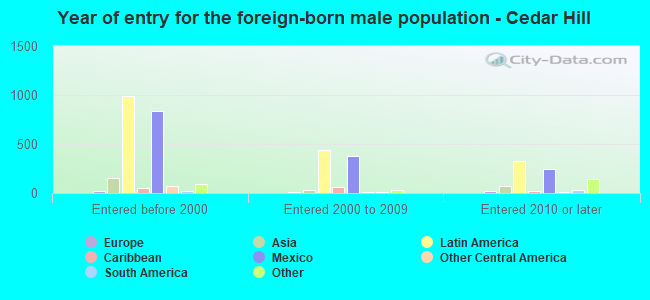
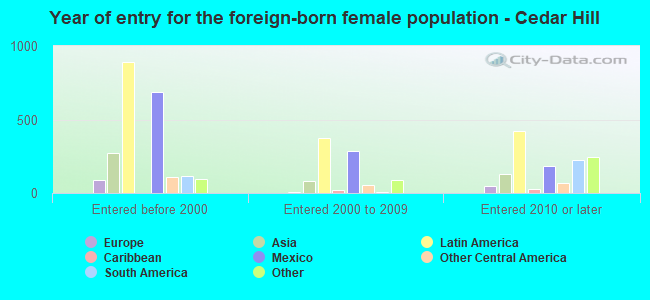
Foreign-born residents in Cedar Hill 5,412 residents are foreign born (7.3% Latin America , 1.6% Asia , 1.3% Africa ).
This city:
11.1%Texas:
17.1%
Marital status for residents in Cedar Hill Marital status - White (Caucasian) population 15 years and over
Males 32.7% Never married53.8% Now married0.8% Separated2.5% Widowed10.2% DivorcedFemales 29.6% Never married51.1% Now married0.7% Separated8.6% Widowed10.0% DivorcedWomen who gave birth in the past 12 months Now married:
47.3% (30)Unmarried:
52.7% (34)
Women who did not give birth in the past 12 months Now married:
45.5% (1,110)Unmarried:
54.5% (1,331)
Marital status - Black or African American population 15 years and over
Males 36.2% Never married52.3% Now married0.8% Separated1.4% Widowed9.4% DivorcedFemales 40.0% Never married40.2% Now married2.7% Separated3.1% Widowed14.0% DivorcedWomen who gave birth in the past 12 months Now married:
34.8% (164)Unmarried:
65.2% (307)
Women who did not give birth in the past 12 months Now married:
38.5% (2,230)Unmarried:
61.5% (3,561)
Marital status - American Indian / Alaska Native population 15 years and over
Males 43.4% Never married30.2% Now married0.0% Separated0.0% Widowed26.4% DivorcedFemales 30.8% Never married23.1% Now married0.0% Separated0.0% Widowed46.2% DivorcedWomen who did not give birth in the past 12 months Now married:
42.9% (3)Unmarried:
57.1% (4)
Marital status - Asian population 15 years and over
Males 34.6% Never married60.3% Now married0.0% Separated2.3% Widowed2.8% DivorcedFemales 23.5% Never married62.1% Now married3.4% Separated3.8% Widowed7.2% DivorcedWomen who did not give birth in the past 12 months Now married:
60.7% (162)Unmarried:
39.3% (105)
Marital status - Native Hawaiian / Pacific Islander population 15 years and over
Males 0.0% Never married100.0% Now married0.0% Separated0.0% Widowed0.0% DivorcedFemales 0.0% Never married100.0% Now married0.0% Separated0.0% Widowed0.0% DivorcedWomen who did not give birth in the past 12 months Now married:
100.0% (39)Unmarried:
0.0% (0)
Marital status - Other race population 15 years and over
Males 35.0% Never married61.8% Now married1.8% Separated0.0% Widowed1.4% DivorcedFemales 26.6% Never married53.1% Now married10.6% Separated3.8% Widowed5.9% DivorcedWomen who gave birth in the past 12 months Now married:
71.9% (60)Unmarried:
28.1% (23)
Women who did not give birth in the past 12 months Now married:
61.4% (694)Unmarried:
38.6% (436)
Marital status - Two or more races population 15 years and over
Males 46.5% Never married39.2% Now married4.3% Separated1.4% Widowed8.7% DivorcedFemales 40.4% Never married40.0% Now married2.7% Separated4.5% Widowed12.4% DivorcedWomen who gave birth in the past 12 months Now married:
100.0% (32)Unmarried:
0.0% (0)
Women who did not give birth in the past 12 months Now married:
44.7% (915)Unmarried:
55.3% (1,130)
Marital status - White alone, not Hispanic / Latino population 15 years and over
Males 27.5% Never married56.0% Now married1.3% Separated2.3% Widowed12.9% DivorcedFemales 23.7% Never married51.7% Now married0.2% Separated10.7% Widowed13.7% DivorcedWomen who gave birth in the past 12 months Now married:
86.3% (42)Unmarried:
13.7% (7)
Women who did not give birth in the past 12 months Now married:
40.6% (703)Unmarried:
59.4% (1,029)
Marital status - Hispanic or Latino population 15 years and over
Males 41.0% Never married52.4% Now married1.0% Separated1.5% Widowed4.0% DivorcedFemales 35.6% Never married50.2% Now married2.7% Separated4.9% Widowed6.6% DivorcedWomen who gave birth in the past 12 months Now married:
58.0% (81)Unmarried:
42.0% (59)
Women who did not give birth in the past 12 months Now married:
52.7% (1,719)Unmarried:
47.3% (1,544)
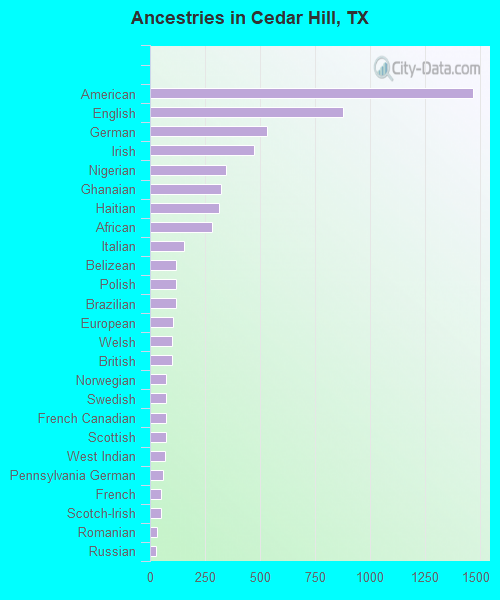
Ancestries in Cedar Hill
1,469 4.7% American879 2.8% English531 1.7% German474 1.5% Irish344 1.1% Nigerian325 1.0% Ghanaian316 1.0% Haitian283 0.9% African155 0.5% Italian118 0.4% Belizean118 0.4% Polish117 0.4% Brazilian106 0.3% European99 0.3% Welsh99 0.3% British75 0.2% Norwegian72 0.2% Swedish72 0.2% French Canadian71 0.2% Scottish69 0.2% West Indian58 0.2% Pennsylvania German51 0.2% French48 0.2% Scotch-Irish31 0.10% Romanian29 0.09% Russian28 0.09% Northern European25 0.08% Ukrainian18 0.06% Czech16 0.05% Belgian14 0.04% Armenian12 0.04% Danish11 0.04% Swiss9 0.03% Czechoslovakian7 0.02% Eastern European7 0.02% Iranian3 0.01% Croatian
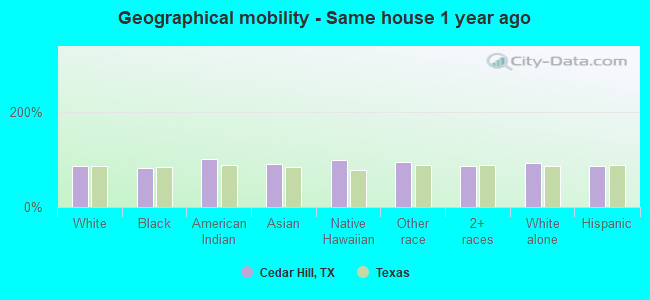
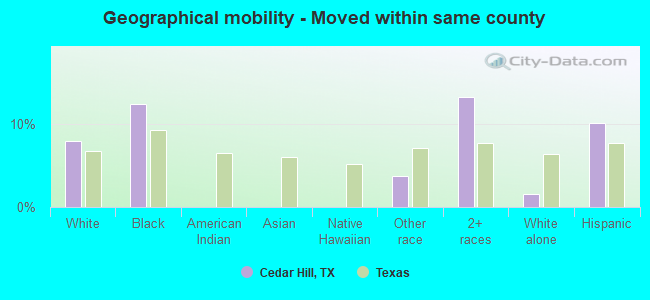
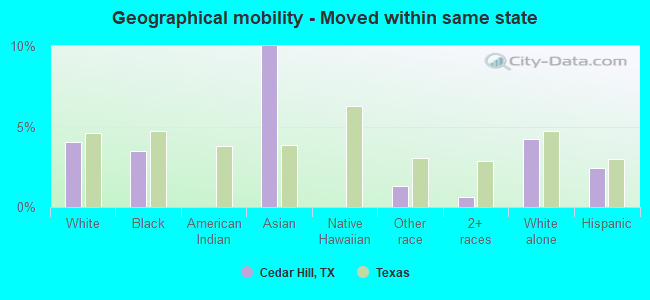
Geographical mobility in Cedar Hill Same house 1 year ago 9,348 84.8% White (Caucasian)19,513 81.3% Black or African American78 100.0% American Indian / Alaska Native811 90.5% Asian224 98.2% Native Hawaiian / Pacific Islander4,261 95.3% Other race6,129 85.0% Two or more races7,360 91.9% White alone, not Hispanic / Latino10,932 85.0% Hispanic or LatinoMoved within same county 880 8.0% White / Caucasian2,999 12.5% Black or African American167 3.7% Other race961 13.3% Two or more races130 1.6% White alone, not Hispanic / Latino1,312 10.2% Hispanic or LatinoMoved within same state 446 4.0% White / Caucasian833 3.5% Black or African American90 10.0% Asian58 1.3% Other race45 0.6% Two or more races338 4.2% White alone, not Hispanic / Latino308 2.4% Hispanic or LatinoMoved from different state 347 3.1% White / Caucasian451 1.9% Black or African American15 0.2% Two or more races221 2.8% White alone, not Hispanic / Latino178 1.4% Hispanic or LatinoMoved from abroad 31 0.3% White222 0.9% Black or African American34 3.8% Asian42 0.6% Two or more races18 0.2% White alone, not Hispanic / Latino49 0.4% Hispanic or Latino
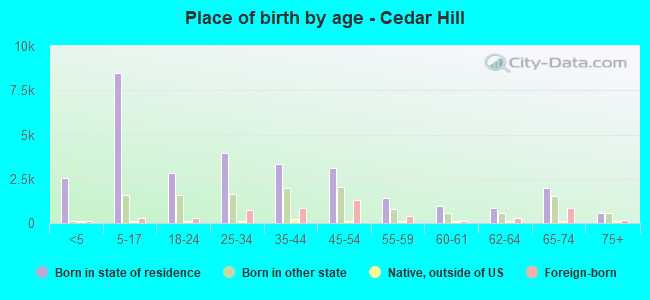
Children Nativity (place of birth) in Cedar Hill
Children under 6 years - Living with two parents Both parents native 1,562 100.0% NativeBoth parents foreign-born 314 100.0% NativeOne native, one foreign-born parent 284 100.0% NativeChildren under 6 years - Living with one parent Native parent 1,199 100.0% NativeForeign-born parent 77 100.0% NativeChildren 6 to 17 years - Living with two parents Both parents native 3,790 100.0% NativeBoth parents foreign-born 874 83.6% Native172 16.4% Foreign-bornOne native, one foreign-born parent 566 89.9% Native64 10.1% Foreign-bornChildren 6 to 17 years - Living with one parent Native parent 2,954 100.0% NativeForeign-born parent 301 54.7% Native250 45.3% Foreign-born
Grandparents responsible for own grandchildren in Cedar Hill
Grandparents (30 to 59 years) White / Caucasian 79 59.4% Responsible for grandchildren54 40.6% Not responsible for grandchildrenBlack or African American 182 57.1% Responsible for grandchildren136 42.9% Not responsible for grandchildrenAmerican Indian / Alaska Native 9 100.0% Responsible for grandchildrenAsian 13 100.0% Not responsible for grandchildrenOther race 24 100.0% Responsible for grandchildrenTwo or more races 110 100.0% Responsible for grandchildrenWhite alone, not Hispanic / Latino 28 30.8% Responsible for grandchildren62 69.2% Not responsible for grandchildrenHispanic or Latino 159 95.1% Responsible for grandchildren8 4.9% Not responsible for grandchildrenGrandparents (60 years and over) White / Caucasian 49 26.1% Responsible for grandchildren139 73.9% Not responsible for grandchildrenBlack or African American 49 17.2% Responsible for grandchildren237 82.8% Not responsible for grandchildrenOther race 87 100.0% Not responsible for grandchildrenTwo or more races 27 100.0% Not responsible for grandchildrenWhite alone, not Hispanic / Latino 62 29.2% Responsible for grandchildren151 70.8% Not responsible for grandchildrenHispanic or Latino 171 100.0% Not responsible for grandchildren