Races in Celina, Texas (TX) Detailed Stats
Data:
Races - White alone (%)
Races - White alone (% change since 2000)
Races - Black alone (%)
Races - Black alone (% change since 2000)
Races - American Indian alone (%)
Races - American Indian alone (% change since 2000)
Races - Asian alone (%)
Races - Asian alone (% change since 2000)
Races - Hispanic (%)
Races - Hispanic (% change since 2000)
Races - Native Hawaiian and Other Pacific Islander alone (%)
Races - Native Hawaiian and Other Pacific Islander alone (% change since 2000)
Races - Two or more races(%)
Races - Two or more races(% change since 2000)
Races - Other race alone (%)
Races - Other race alone (% change since 2000)
Racial diversity
Place of birth - Born in state of residence (%)
Place of birth - Born in state of residence (%) - White
Place of birth - Born in state of residence (%) - Black or African American
Place of birth - Born in state of residence (%) - Asian
Place of birth - Born in state of residence (%) - Hispanic or Latino
Place of birth - Born in state of residence (%) - American Indian and Alaska Native
Place of birth - Born in state of residence (%) - Multirace
Place of birth - Born in state of residence (%) - Other Race
Place of birth - Born in other state (%)
Place of birth - Born in other state (%) - White
Place of birth - Born in other state (%) - Black or African American
Place of birth - Born in other state (%) - Asian
Place of birth - Born in other state (%) - Hispanic or Latino
Place of birth - Born in other state (%) - American Indian and Alaska Native
Place of birth - Born in other state (%) - Multirace
Place of birth - Born in other state (%) - Other Race
Place of birth - Native, outside of US (%)
Place of birth - Native, outside of US (%) - White
Place of birth - Native, outside of US (%) - Black or African American
Place of birth - Native, outside of US (%) - Asian
Place of birth - Native, outside of US (%) - Hispanic or Latino
Place of birth - Native, outside of US (%) - American Indian and Alaska Native
Place of birth - Native, outside of US (%) - Multirace
Place of birth - Native, outside of US (%) - Other Race
Place of birth - Foreign born (%)
Place of birth - Foreign born (%) - White
Place of birth - Foreign born (%) - Black or African American
Place of birth - Foreign born (%) - Asian
Place of birth - Foreign born (%) - Hispanic or Latino
Place of birth - Foreign born (%) - American Indian and Alaska Native
Place of birth - Foreign born (%) - Multirace
Place of birth - Foreign born (%) - Other Race
Residents speaking English at home (%)
Residents speaking English at home - Born in the United States (%)
Residents speaking English at home - Native, born elsewhere (%)
Residents speaking English at home - Foreign born (%)
Residents speaking Spanish at home (%)
Residents speaking Spanish at home - Born in the United States (%)
Residents speaking Spanish at home - Native, born elsewhere (%)
Residents speaking Spanish at home - Foreign born (%)
Residents speaking other language at home (%)
Residents speaking other language at home - Born in the United States (%)
Residents speaking other language at home - Native, born elsewhere (%)
Residents speaking other language at home - Foreign born (%)
Marital status - Never married (%)
Marital status - Now married (%)
Marital status - Separated (%)
Marital status - Widowed (%)
Marital status - Divorced (%)
Ancestries Reported - Arab (%)
Ancestries Reported - Czech (%)
Ancestries Reported - Danish (%)
Ancestries Reported - Dutch (%)
Ancestries Reported - English (%)
Ancestries Reported - French (%)
Ancestries Reported - French Canadian (%)
Ancestries Reported - German (%)
Ancestries Reported - Greek (%)
Ancestries Reported - Hungarian (%)
Ancestries Reported - Irish (%)
Ancestries Reported - Italian (%)
Ancestries Reported - Lithuanian (%)
Ancestries Reported - Norwegian (%)
Ancestries Reported - Polish (%)
Ancestries Reported - Portuguese (%)
Ancestries Reported - Russian (%)
Ancestries Reported - Scotch-Irish (%)
Ancestries Reported - Scottish (%)
Ancestries Reported - Slovak (%)
Ancestries Reported - Subsaharan African (%)
Ancestries Reported - Swedish (%)
Ancestries Reported - Swiss (%)
Ancestries Reported - Ukrainian (%)
Ancestries Reported - United States (%)
Ancestries Reported - Welsh (%)
Ancestries Reported - West Indian (%)
Ancestries Reported - Other (%)
Geographical mobility - Same house 1 year ago (%)
Geographical mobility - Same house 1 year ago (%) - White
Geographical mobility - Same house 1 year ago (%) - Black or African American
Geographical mobility - Same house 1 year ago (%) - Asian
Geographical mobility - Same house 1 year ago (%) - Hispanic or Latino
Geographical mobility - Same house 1 year ago (%) - American Indian and Alaska Native
Geographical mobility - Same house 1 year ago (%) - Multirace
Geographical mobility - Same house 1 year ago (%) - Other Race
Geographical mobility - Moved within same county (%)
Geographical mobility - Moved within same county (%) - White
Geographical mobility - Moved within same county (%) - Black or African American
Geographical mobility - Moved within same county (%) - Asian
Geographical mobility - Moved within same county (%) - Hispanic or Latino
Geographical mobility - Moved within same county (%) - American Indian and Alaska Native
Geographical mobility - Moved within same county (%) - Multirace
Geographical mobility - Moved within same county (%) - Other Race
Geographical mobility - Moved from different county within same state (%)
Geographical mobility - Moved from different county within same state (%) - White
Geographical mobility - Moved from different county within same state (%) - Black or African American
Geographical mobility - Moved from different county within same state (%) - Asian
Geographical mobility - Moved from different county within same state (%) - Hispanic or Latino
Geographical mobility - Moved from different county within same state (%) - American Indian and Alaska Native
Geographical mobility - Moved from different county within same state (%) - Multirace
Geographical mobility - Moved from different county within same state (%) - Other Race
Geographical mobility - Moved from different state (%)
Geographical mobility - Moved from different state (%) - White
Geographical mobility - Moved from different state (%) - Black or African American
Geographical mobility - Moved from different state (%) - Asian
Geographical mobility - Moved from different state (%) - Hispanic or Latino
Geographical mobility - Moved from different state (%) - American Indian and Alaska Native
Geographical mobility - Moved from different state (%) - Multirace
Geographical mobility - Moved from different state (%) - Other Race
Geographical mobility - Moved from abroad (%)
Geographical mobility - Moved from abroad (%) - White
Geographical mobility - Moved from abroad (%) - Black or African American
Geographical mobility - Moved from abroad (%) - Asian
Geographical mobility - Moved from abroad (%) - Hispanic or Latino
Geographical mobility - Moved from abroad (%) - American Indian and Alaska Native
Geographical mobility - Moved from abroad (%) - Multirace
Geographical mobility - Moved from abroad (%) - Other Race
Place of birth for the foreign-born population - Ireland (%)
Place of birth for the foreign-born population - Denmark (%)
Place of birth for the foreign-born population - Norway (%)
Place of birth for the foreign-born population - Sweden (%)
Place of birth for the foreign-born population - United Kingdom (%)
Place of birth for the foreign-born population - England (%)
Place of birth for the foreign-born population - Scotland (%)
Place of birth for the foreign-born population - Other Northern Europe (%)
Place of birth for the foreign-born population - Austria (%)
Place of birth for the foreign-born population - Belgium (%)
Place of birth for the foreign-born population - France (%)
Place of birth for the foreign-born population - Germany (%)
Place of birth for the foreign-born population - Netherlands (%)
Place of birth for the foreign-born population - Switzerland (%)
Place of birth for the foreign-born population - Other Western Europe (%)
Place of birth for the foreign-born population - Greece (%)
Place of birth for the foreign-born population - Italy (%)
Place of birth for the foreign-born population - Portugal (%)
Place of birth for the foreign-born population - Spain (%)
Place of birth for the foreign-born population - Other Southern Europe (%)
Place of birth for the foreign-born population - Albania (%)
Place of birth for the foreign-born population - Belarus (%)
Place of birth for the foreign-born population - Bosnia and Herzegovina (%)
Place of birth for the foreign-born population - Bulgaria (%)
Place of birth for the foreign-born population - Croatia (%)
Place of birth for the foreign-born population - Czechoslovakia (%)
Place of birth for the foreign-born population - Hungary (%)
Place of birth for the foreign-born population - Latvia (%)
Place of birth for the foreign-born population - Lithuania (%)
Place of birth for the foreign-born population - North Macedonia (Macedonia) (%)
Place of birth for the foreign-born population - Moldova (%)
Place of birth for the foreign-born population - Poland (%)
Place of birth for the foreign-born population - Romania (%)
Place of birth for the foreign-born population - Russia (%)
Place of birth for the foreign-born population - Serbia (%)
Place of birth for the foreign-born population - Ukraine (%)
Place of birth for the foreign-born population - Other Eastern Europe (%)
Place of birth for the foreign-born population - China (%)
Place of birth for the foreign-born population - Hong Kong (%)
Place of birth for the foreign-born population - Taiwan (%)
Place of birth for the foreign-born population - Japan (%)
Place of birth for the foreign-born population - Korea (%)
Place of birth for the foreign-born population - Other Eastern Asia (%)
Place of birth for the foreign-born population - Afghanistan (%)
Place of birth for the foreign-born population - Bangladesh (%)
Place of birth for the foreign-born population - India (%)
Place of birth for the foreign-born population - Iran (%)
Place of birth for the foreign-born population - Kazakhstan (%)
Place of birth for the foreign-born population - Nepal (%)
Place of birth for the foreign-born population - Pakistan (%)
Place of birth for the foreign-born population - Sri Lanka (%)
Place of birth for the foreign-born population - Uzbekistan (%)
Place of birth for the foreign-born population - Other South Central Asia (%)
Place of birth for the foreign-born population - Burma (%)
Place of birth for the foreign-born population - Cambodia (%)
Place of birth for the foreign-born population - Indonesia (%)
Place of birth for the foreign-born population - Laos (%)
Place of birth for the foreign-born population - Malaysia (%)
Place of birth for the foreign-born population - Philippines (%)
Place of birth for the foreign-born population - Singapore (%)
Place of birth for the foreign-born population - Thailand (%)
Place of birth for the foreign-born population - Vietnam (%)
Place of birth for the foreign-born population - Other South Eastern Asia (%)
Place of birth for the foreign-born population - Armenia (%)
Place of birth for the foreign-born population - Iraq (%)
Place of birth for the foreign-born population - Israel (%)
Place of birth for the foreign-born population - Jordan (%)
Place of birth for the foreign-born population - Kuwait (%)
Place of birth for the foreign-born population - Lebanon (%)
Place of birth for the foreign-born population - Saudi Arabia (%)
Place of birth for the foreign-born population - Syria (%)
Place of birth for the foreign-born population - Turkey (%)
Place of birth for the foreign-born population - Yemen (%)
Place of birth for the foreign-born population - Other Western Asia (%)
Place of birth for the foreign-born population - Eritrea (%)
Place of birth for the foreign-born population - Ethiopia (%)
Place of birth for the foreign-born population - Kenya (%)
Place of birth for the foreign-born population - Somalia (%)
Place of birth for the foreign-born population - Uganda (%)
Place of birth for the foreign-born population - Zimbabwe (%)
Place of birth for the foreign-born population - Other Eastern Africa (%)
Place of birth for the foreign-born population - Cameroon (%)
Place of birth for the foreign-born population - Congo (%)
Place of birth for the foreign-born population - Democratic Republic of Congo (Zaire) (%)
Place of birth for the foreign-born population - Other Middle Africa (%)
Place of birth for the foreign-born population - Egypt (%)
Place of birth for the foreign-born population - Morocco (%)
Place of birth for the foreign-born population - Sudan (%)
Place of birth for the foreign-born population - Other Northern Africa (%)
Place of birth for the foreign-born population - South Africa (%)
Place of birth for the foreign-born population - Other Southern Africa (%)
Place of birth for the foreign-born population - Cabo Verde (%)
Place of birth for the foreign-born population - Ghana (%)
Place of birth for the foreign-born population - Liberia (%)
Place of birth for the foreign-born population - Nigeria (%)
Place of birth for the foreign-born population - Senegal (%)
Place of birth for the foreign-born population - Sierra Leone (%)
Place of birth for the foreign-born population - Other Western Africa (%)
Place of birth for the foreign-born population - Australia (%)
Place of birth for the foreign-born population - New Zealand (%)
Place of birth for the foreign-born population - Fiji (%)
Place of birth for the foreign-born population - Micronesia (%)
Place of birth for the foreign-born population - Bahamas (%)
Place of birth for the foreign-born population - Barbados (%)
Place of birth for the foreign-born population - Cuba (%)
Place of birth for the foreign-born population - Dominica (%)
Place of birth for the foreign-born population - Dominican Republic (%)
Place of birth for the foreign-born population - Grenada (%)
Place of birth for the foreign-born population - Haiti (%)
Place of birth for the foreign-born population - Jamaica (%)
Place of birth for the foreign-born population - St. Vincent and the Grenadines (%)
Place of birth for the foreign-born population - Trinidad and Tobago (%)
Place of birth for the foreign-born population - West Indies (%)
Place of birth for the foreign-born population - Other Caribbean (%)
Place of birth for the foreign-born population - Belize (%)
Place of birth for the foreign-born population - Costa Rica (%)
Place of birth for the foreign-born population - El Salvador (%)
Place of birth for the foreign-born population - Guatemala (%)
Place of birth for the foreign-born population - Honduras (%)
Place of birth for the foreign-born population - Mexico (%)
Place of birth for the foreign-born population - Nicaragua (%)
Place of birth for the foreign-born population - Panama (%)
Place of birth for the foreign-born population - Other Central America (%)
Place of birth for the foreign-born population - Argentina (%)
Place of birth for the foreign-born population - Bolivia (%)
Place of birth for the foreign-born population - Brazil (%)
Place of birth for the foreign-born population - Chile (%)
Place of birth for the foreign-born population - Colombia (%)
Place of birth for the foreign-born population - Ecuador (%)
Place of birth for the foreign-born population - Guyana (%)
Place of birth for the foreign-born population - Peru (%)
Place of birth for the foreign-born population - Uruguay (%)
Place of birth for the foreign-born population - Venezuela (%)
Place of birth for the foreign-born population - Other South America (%)
Place of birth for the foreign-born population - Canada (%)
Place of birth for the foreign-born population - Other Northern America (%)
Place of birth for the foreign-born population - Other (%)
Latest news about races in Celina, TX collected exclusively by city-data.com from local newspapers, TV, and radio stations
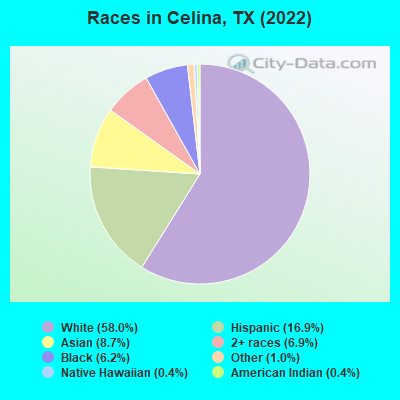
According to 2022 data, the most numerous races in Celina, TX are Hispanic (3,897 residents), White alone (13,382 residents), and Black alone (1,424 residents). 81.1% of Celina residents speak English at home. 12.8% of Celina, TX residents are foreign-born (6.1% born in Asia, 4.8% born in Latin America), which is 33.1% less than the foreign-born rate of 17.0% across the entire state of Texas.
Race distribution in Celina
2000 2022
10,933,313 52.4% White alone 6,669,666 32.0% Hispanic 2,364,255 11.3% Black alone 554,445 2.7% Asian alone 230,567 1.1% Two or more races 68,859 0.3% American Indian alone 19,958 0.10% Other race alone 10,757 0.05% Native Hawaiian and Other
12,070,642 40.2% Hispanic 11,683,430 38.9% White alone 3,508,706 11.7% Black alone 1,608,173 5.4% Asian alone 956,560 3.2% Two or more races 125,763 0.4% Other race alone 47,023 0.2% American Indian alone 29,275 0.10% Native Hawaiian and Other
Income and house value in Celina Median household income in 2022 $128,578 White non-Hispanic householders$146,158 Black householders$168,452 Asian householdersover $200,000 Some other race householders$160,173 Two or more races householders$136,874 Hispanic or Latino race householdersMedian 2022 house value $534,450 White Non-Hispanic householders$361,559 Black or African American householders over $1,000,000 Asian householders$262,952 Some other race householders$308,968 Hispanic or Latino householders
Median age by race in Celina
38.1 Median age for White residents38.7 37.5 25.8 Median age for Black or African American residents25.4 35.2 71.7 Median age for American Indian / Alaska Native residents-724,137,930.3 64.1 49.7 Median age for Asian residents54.3 40.2 -819,226,749.4 Median age for Native Hawaiian / Pacific Islander residents-770,894,787.8 -577,777,777.2 29.2 Median age for Other race residents29.8 26.4 23.9 Median age for Two or more races residents23.1 39.2 38.0 Median age for White alone residents38.8 37.6 28.3 Median age for Hispanic or Latino residents26.4 35.4
Owner/renter occupied households by race in Celina
House owners and renters - White residents 4,562 89.1% Owner occupied560 10.9% Renter occupiedHouse owners and renters - Black or African American residents 677 95.8% Owner occupied30 4.2% Renter occupiedHouse owners and renters - American Indian / Alaska Native residents 8 100.0% Owner occupiedHouse owners and renters - Asian residents 577 100.0% Owner occupiedHouse owners and renters - Other race residents 225 82.7% Owner occupied47 17.3% Renter occupiedHouse owners and renters - Two or more races residents 821 94.5% Owner occupied48 5.5% Renter occupiedHouse owners and renters - White alone residents 4,515 90.9% Owner occupied452 9.1% Renter occupiedHouse owners and renters - Hispanic or Latino residents 679 78.1% Owner occupied190 21.9% Renter occupied
Language usage in Celina
English speakers - Total 81.1% of residents of Celina speak English at home.
8.9% of residents speak Spanish at home 1,397 71.5% Speak English very well556 28.5% Speak English less than very well9.7% of residents speak other language at home 1,887 89.2% Speak English very well229 10.8% Speak English less than very well
English speakers - Born in the United States 93.8% of residents of Celina speak English at home.
3.7% of residents speak Spanish at home 249 83.8% Speak English very well48 16.2% Speak English less than very well2.1% of residents speak other language at home 173 100.0% Speak English very well
English speakers - Native, born elsewhere 45.6% of residents of Celina speak English at home.
70.2% of residents speak Spanish at home 294 100.0% Speak English very well
English speakers - Foreign-born 16.4% of residents of Celina speak English at home.
24.4% of residents speak Spanish at home 351 45.9% Speak English very well413 54.1% Speak English less than very well60.2% of residents speak other language at home 1,658 87.9% Speak English very well228 12.1% Speak English less than very well
White (Caucasian) - Speak only English Native:
97.8% (12,922)Foreign-born:
28.0% (150)
White (Caucasian) - Speak another language Native:
2.9% (385)Foreign-born:
72.9% (390)
Asian - Speak only English Native:
55.0% (200)Foreign-born:
7.0% (110)
Asian - Speak another language Native:
44.6% (162)Foreign-born:
92.2% (1,451)
Other race - Speak only English Native:
86.3% (129)Foreign-born:
36.4% (118)
Other race - Speak another language Native:
21.5% (32)Foreign-born:
35.5% (115)
Two or more races - Speak another language Native:
31.6% (1,047)Foreign-born:
100.0% (699)
White alone - Speak only English Native:
98.7% (12,047)Foreign-born:
32.1% (145)
White alone - Speak another language Native:
1.3% (156)Foreign-born:
67.4% (305)
Hispanic or Latino - Speak another language Native:
37.2% (1,101)Foreign-born:
98.9% (768)
Foreign-born residents in Celina 2,948 residents are foreign born (6.1% Asia , 4.8% Latin America ).
This city:
12.8%Texas:
17.1%
Marital status for residents in Celina Marital status - White (Caucasian) population 15 years and over
Males 20.0% Never married72.0% Now married0.0% Separated1.6% Widowed6.4% DivorcedFemales 17.8% Never married67.6% Now married0.0% Separated2.8% Widowed11.7% DivorcedWomen who gave birth in the past 12 months Now married:
75.2% (99)Unmarried:
24.8% (33)
Women who did not give birth in the past 12 months Now married:
71.2% (2,520)Unmarried:
28.8% (1,020)
Marital status - Black or African American population 15 years and over
Males 43.0% Never married48.1% Now married5.0% Separated0.0% Widowed3.9% DivorcedFemales 20.6% Never married73.7% Now married3.3% Separated0.0% Widowed2.4% DivorcedWomen who did not give birth in the past 12 months Now married:
70.4% (338)Unmarried:
29.6% (142)
Marital status - Asian population 15 years and over
Males 16.7% Never married81.4% Now married0.0% Separated1.9% Widowed0.0% DivorcedFemales 7.5% Never married92.5% Now married0.0% Separated0.0% Widowed0.0% DivorcedWomen who gave birth in the past 12 months Now married:
100.0% (50)Unmarried:
0.0% (0)
Women who did not give birth in the past 12 months Now married:
89.4% (706)Unmarried:
10.6% (84)
Marital status - Other race population 15 years and over
Males 18.1% Never married81.9% Now married0.0% Separated0.0% Widowed0.0% DivorcedFemales 43.6% Never married46.4% Now married0.0% Separated10.0% Widowed0.0% DivorcedWomen who did not give birth in the past 12 months Now married:
40.0% (33)Unmarried:
60.0% (49)
Marital status - Two or more races population 15 years and over
Males 52.9% Never married42.9% Now married4.2% Separated0.0% Widowed0.0% DivorcedFemales 28.2% Never married47.6% Now married0.0% Separated0.0% Widowed24.2% DivorcedWomen who did not give birth in the past 12 months Now married:
58.4% (419)Unmarried:
41.6% (299)
Marital status - White alone, not Hispanic / Latino population 15 years and over
Males 19.7% Never married71.3% Now married0.0% Separated1.7% Widowed7.2% DivorcedFemales 19.1% Never married65.7% Now married0.0% Separated3.0% Widowed12.2% DivorcedWomen who gave birth in the past 12 months Now married:
65.6% (64)Unmarried:
34.4% (34)
Women who did not give birth in the past 12 months Now married:
69.3% (2,338)Unmarried:
30.7% (1,038)
Marital status - Hispanic or Latino population 15 years and over
Males 44.4% Never married55.6% Now married0.0% Separated0.0% Widowed0.0% DivorcedFemales 23.6% Never married69.4% Now married0.0% Separated0.9% Widowed6.0% DivorcedWomen who gave birth in the past 12 months Now married:
100.0% (40)Unmarried:
0.0% (0)
Women who did not give birth in the past 12 months Now married:
69.9% (753)Unmarried:
30.1% (325)
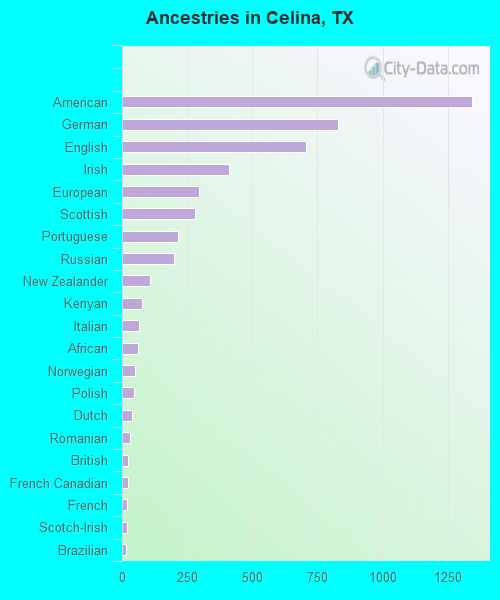
Ancestries in Celina
1,341 13.8% American829 8.5% German707 7.3% English412 4.2% Irish294 3.0% European279 2.9% Scottish216 2.2% Portuguese200 2.1% Russian106 1.1% New Zealander78 0.8% Kenyan67 0.7% Italian62 0.6% African51 0.5% Norwegian47 0.5% Polish39 0.4% Dutch31 0.3% Romanian22 0.2% British22 0.2% French Canadian18 0.2% French18 0.2% Scotch-Irish14 0.1% Brazilian
Geographical mobility in Celina Same house 1 year ago 12,554 87.8% White (Caucasian)1,631 100.0% Black or African American185 100.0% American Indian / Alaska Native1,573 80.9% Asian76 98.2% Native Hawaiian / Pacific Islander218 43.5% Other race3,714 87.9% Two or more races11,419 86.3% White alone, not Hispanic / Latino3,598 93.1% Hispanic or LatinoMoved within same county 1,108 7.7% White / Caucasian15 0.9% Black or African American231 11.9% Asian191 38.0% Other race324 7.7% Two or more races1,190 9.0% White alone, not Hispanic / Latino130 3.4% Hispanic or LatinoMoved within same state 570 4.0% White / Caucasian41 2.1% Asian56 11.2% Other race45 1.1% Two or more races536 4.0% White alone, not Hispanic / Latino98 2.5% Hispanic or LatinoMoved from different state 57 0.4% White / Caucasian48 1.1% Two or more races58 0.4% White alone, not Hispanic / LatinoMoved from abroad 44 2.3% Asian
Children Nativity (place of birth) in Celina
Children under 6 years - Living with two parents Both parents native 1,675 100.0% NativeBoth parents foreign-born 92 100.0% NativeOne native, one foreign-born parent 203 100.0% NativeChildren under 6 years - Living with one parent Native parent 4 100.0% NativeForeign-born parent 22 100.0% NativeChildren 6 to 17 years - Living with two parents Both parents native 3,286 100.0% NativeBoth parents foreign-born 251 100.0% NativeOne native, one foreign-born parent 501 100.0% NativeChildren 6 to 17 years - Living with one parent Native parent 495 100.0% NativeForeign-born parent 14 47.2% Native16 52.8% Foreign-born
Grandparents responsible for own grandchildren in Celina
Grandparents (30 to 59 years) White / Caucasian 13 100.0% Not responsible for grandchildrenWhite alone, not Hispanic / Latino 7 100.0% Not responsible for grandchildrenHispanic or Latino 5 100.0% Not responsible for grandchildren
Grandparents (60 years and over) White / Caucasian 36 100.0% Not responsible for grandchildrenWhite alone, not Hispanic / Latino 38 100.0% Not responsible for grandchildren