Races in Champaign, Illinois (IL) Detailed Stats
Data:
Races - White alone (%)
Races - White alone (% change since 2000)
Races - Black alone (%)
Races - Black alone (% change since 2000)
Races - American Indian alone (%)
Races - American Indian alone (% change since 2000)
Races - Asian alone (%)
Races - Asian alone (% change since 2000)
Races - Hispanic (%)
Races - Hispanic (% change since 2000)
Races - Native Hawaiian and Other Pacific Islander alone (%)
Races - Native Hawaiian and Other Pacific Islander alone (% change since 2000)
Races - Two or more races(%)
Races - Two or more races(% change since 2000)
Races - Other race alone (%)
Races - Other race alone (% change since 2000)
Racial diversity
Place of birth - Born in state of residence (%)
Place of birth - Born in state of residence (%) - White
Place of birth - Born in state of residence (%) - Black or African American
Place of birth - Born in state of residence (%) - Asian
Place of birth - Born in state of residence (%) - Hispanic or Latino
Place of birth - Born in state of residence (%) - American Indian and Alaska Native
Place of birth - Born in state of residence (%) - Multirace
Place of birth - Born in state of residence (%) - Other Race
Place of birth - Born in other state (%)
Place of birth - Born in other state (%) - White
Place of birth - Born in other state (%) - Black or African American
Place of birth - Born in other state (%) - Asian
Place of birth - Born in other state (%) - Hispanic or Latino
Place of birth - Born in other state (%) - American Indian and Alaska Native
Place of birth - Born in other state (%) - Multirace
Place of birth - Born in other state (%) - Other Race
Place of birth - Native, outside of US (%)
Place of birth - Native, outside of US (%) - White
Place of birth - Native, outside of US (%) - Black or African American
Place of birth - Native, outside of US (%) - Asian
Place of birth - Native, outside of US (%) - Hispanic or Latino
Place of birth - Native, outside of US (%) - American Indian and Alaska Native
Place of birth - Native, outside of US (%) - Multirace
Place of birth - Native, outside of US (%) - Other Race
Place of birth - Foreign born (%)
Place of birth - Foreign born (%) - White
Place of birth - Foreign born (%) - Black or African American
Place of birth - Foreign born (%) - Asian
Place of birth - Foreign born (%) - Hispanic or Latino
Place of birth - Foreign born (%) - American Indian and Alaska Native
Place of birth - Foreign born (%) - Multirace
Place of birth - Foreign born (%) - Other Race
Residents speaking English at home (%)
Residents speaking English at home - Born in the United States (%)
Residents speaking English at home - Native, born elsewhere (%)
Residents speaking English at home - Foreign born (%)
Residents speaking Spanish at home (%)
Residents speaking Spanish at home - Born in the United States (%)
Residents speaking Spanish at home - Native, born elsewhere (%)
Residents speaking Spanish at home - Foreign born (%)
Residents speaking other language at home (%)
Residents speaking other language at home - Born in the United States (%)
Residents speaking other language at home - Native, born elsewhere (%)
Residents speaking other language at home - Foreign born (%)
Marital status - Never married (%)
Marital status - Now married (%)
Marital status - Separated (%)
Marital status - Widowed (%)
Marital status - Divorced (%)
Ancestries Reported - Arab (%)
Ancestries Reported - Czech (%)
Ancestries Reported - Danish (%)
Ancestries Reported - Dutch (%)
Ancestries Reported - English (%)
Ancestries Reported - French (%)
Ancestries Reported - French Canadian (%)
Ancestries Reported - German (%)
Ancestries Reported - Greek (%)
Ancestries Reported - Hungarian (%)
Ancestries Reported - Irish (%)
Ancestries Reported - Italian (%)
Ancestries Reported - Lithuanian (%)
Ancestries Reported - Norwegian (%)
Ancestries Reported - Polish (%)
Ancestries Reported - Portuguese (%)
Ancestries Reported - Russian (%)
Ancestries Reported - Scotch-Irish (%)
Ancestries Reported - Scottish (%)
Ancestries Reported - Slovak (%)
Ancestries Reported - Subsaharan African (%)
Ancestries Reported - Swedish (%)
Ancestries Reported - Swiss (%)
Ancestries Reported - Ukrainian (%)
Ancestries Reported - United States (%)
Ancestries Reported - Welsh (%)
Ancestries Reported - West Indian (%)
Ancestries Reported - Other (%)
Geographical mobility - Same house 1 year ago (%)
Geographical mobility - Same house 1 year ago (%) - White
Geographical mobility - Same house 1 year ago (%) - Black or African American
Geographical mobility - Same house 1 year ago (%) - Asian
Geographical mobility - Same house 1 year ago (%) - Hispanic or Latino
Geographical mobility - Same house 1 year ago (%) - American Indian and Alaska Native
Geographical mobility - Same house 1 year ago (%) - Multirace
Geographical mobility - Same house 1 year ago (%) - Other Race
Geographical mobility - Moved within same county (%)
Geographical mobility - Moved within same county (%) - White
Geographical mobility - Moved within same county (%) - Black or African American
Geographical mobility - Moved within same county (%) - Asian
Geographical mobility - Moved within same county (%) - Hispanic or Latino
Geographical mobility - Moved within same county (%) - American Indian and Alaska Native
Geographical mobility - Moved within same county (%) - Multirace
Geographical mobility - Moved within same county (%) - Other Race
Geographical mobility - Moved from different county within same state (%)
Geographical mobility - Moved from different county within same state (%) - White
Geographical mobility - Moved from different county within same state (%) - Black or African American
Geographical mobility - Moved from different county within same state (%) - Asian
Geographical mobility - Moved from different county within same state (%) - Hispanic or Latino
Geographical mobility - Moved from different county within same state (%) - American Indian and Alaska Native
Geographical mobility - Moved from different county within same state (%) - Multirace
Geographical mobility - Moved from different county within same state (%) - Other Race
Geographical mobility - Moved from different state (%)
Geographical mobility - Moved from different state (%) - White
Geographical mobility - Moved from different state (%) - Black or African American
Geographical mobility - Moved from different state (%) - Asian
Geographical mobility - Moved from different state (%) - Hispanic or Latino
Geographical mobility - Moved from different state (%) - American Indian and Alaska Native
Geographical mobility - Moved from different state (%) - Multirace
Geographical mobility - Moved from different state (%) - Other Race
Geographical mobility - Moved from abroad (%)
Geographical mobility - Moved from abroad (%) - White
Geographical mobility - Moved from abroad (%) - Black or African American
Geographical mobility - Moved from abroad (%) - Asian
Geographical mobility - Moved from abroad (%) - Hispanic or Latino
Geographical mobility - Moved from abroad (%) - American Indian and Alaska Native
Geographical mobility - Moved from abroad (%) - Multirace
Geographical mobility - Moved from abroad (%) - Other Race
Place of birth for the foreign-born population - Ireland (%)
Place of birth for the foreign-born population - Denmark (%)
Place of birth for the foreign-born population - Norway (%)
Place of birth for the foreign-born population - Sweden (%)
Place of birth for the foreign-born population - United Kingdom (%)
Place of birth for the foreign-born population - England (%)
Place of birth for the foreign-born population - Scotland (%)
Place of birth for the foreign-born population - Other Northern Europe (%)
Place of birth for the foreign-born population - Austria (%)
Place of birth for the foreign-born population - Belgium (%)
Place of birth for the foreign-born population - France (%)
Place of birth for the foreign-born population - Germany (%)
Place of birth for the foreign-born population - Netherlands (%)
Place of birth for the foreign-born population - Switzerland (%)
Place of birth for the foreign-born population - Other Western Europe (%)
Place of birth for the foreign-born population - Greece (%)
Place of birth for the foreign-born population - Italy (%)
Place of birth for the foreign-born population - Portugal (%)
Place of birth for the foreign-born population - Spain (%)
Place of birth for the foreign-born population - Other Southern Europe (%)
Place of birth for the foreign-born population - Albania (%)
Place of birth for the foreign-born population - Belarus (%)
Place of birth for the foreign-born population - Bosnia and Herzegovina (%)
Place of birth for the foreign-born population - Bulgaria (%)
Place of birth for the foreign-born population - Croatia (%)
Place of birth for the foreign-born population - Czechoslovakia (%)
Place of birth for the foreign-born population - Hungary (%)
Place of birth for the foreign-born population - Latvia (%)
Place of birth for the foreign-born population - Lithuania (%)
Place of birth for the foreign-born population - North Macedonia (Macedonia) (%)
Place of birth for the foreign-born population - Moldova (%)
Place of birth for the foreign-born population - Poland (%)
Place of birth for the foreign-born population - Romania (%)
Place of birth for the foreign-born population - Russia (%)
Place of birth for the foreign-born population - Serbia (%)
Place of birth for the foreign-born population - Ukraine (%)
Place of birth for the foreign-born population - Other Eastern Europe (%)
Place of birth for the foreign-born population - China (%)
Place of birth for the foreign-born population - Hong Kong (%)
Place of birth for the foreign-born population - Taiwan (%)
Place of birth for the foreign-born population - Japan (%)
Place of birth for the foreign-born population - Korea (%)
Place of birth for the foreign-born population - Other Eastern Asia (%)
Place of birth for the foreign-born population - Afghanistan (%)
Place of birth for the foreign-born population - Bangladesh (%)
Place of birth for the foreign-born population - India (%)
Place of birth for the foreign-born population - Iran (%)
Place of birth for the foreign-born population - Kazakhstan (%)
Place of birth for the foreign-born population - Nepal (%)
Place of birth for the foreign-born population - Pakistan (%)
Place of birth for the foreign-born population - Sri Lanka (%)
Place of birth for the foreign-born population - Uzbekistan (%)
Place of birth for the foreign-born population - Other South Central Asia (%)
Place of birth for the foreign-born population - Burma (%)
Place of birth for the foreign-born population - Cambodia (%)
Place of birth for the foreign-born population - Indonesia (%)
Place of birth for the foreign-born population - Laos (%)
Place of birth for the foreign-born population - Malaysia (%)
Place of birth for the foreign-born population - Philippines (%)
Place of birth for the foreign-born population - Singapore (%)
Place of birth for the foreign-born population - Thailand (%)
Place of birth for the foreign-born population - Vietnam (%)
Place of birth for the foreign-born population - Other South Eastern Asia (%)
Place of birth for the foreign-born population - Armenia (%)
Place of birth for the foreign-born population - Iraq (%)
Place of birth for the foreign-born population - Israel (%)
Place of birth for the foreign-born population - Jordan (%)
Place of birth for the foreign-born population - Kuwait (%)
Place of birth for the foreign-born population - Lebanon (%)
Place of birth for the foreign-born population - Saudi Arabia (%)
Place of birth for the foreign-born population - Syria (%)
Place of birth for the foreign-born population - Turkey (%)
Place of birth for the foreign-born population - Yemen (%)
Place of birth for the foreign-born population - Other Western Asia (%)
Place of birth for the foreign-born population - Eritrea (%)
Place of birth for the foreign-born population - Ethiopia (%)
Place of birth for the foreign-born population - Kenya (%)
Place of birth for the foreign-born population - Somalia (%)
Place of birth for the foreign-born population - Uganda (%)
Place of birth for the foreign-born population - Zimbabwe (%)
Place of birth for the foreign-born population - Other Eastern Africa (%)
Place of birth for the foreign-born population - Cameroon (%)
Place of birth for the foreign-born population - Congo (%)
Place of birth for the foreign-born population - Democratic Republic of Congo (Zaire) (%)
Place of birth for the foreign-born population - Other Middle Africa (%)
Place of birth for the foreign-born population - Egypt (%)
Place of birth for the foreign-born population - Morocco (%)
Place of birth for the foreign-born population - Sudan (%)
Place of birth for the foreign-born population - Other Northern Africa (%)
Place of birth for the foreign-born population - South Africa (%)
Place of birth for the foreign-born population - Other Southern Africa (%)
Place of birth for the foreign-born population - Cabo Verde (%)
Place of birth for the foreign-born population - Ghana (%)
Place of birth for the foreign-born population - Liberia (%)
Place of birth for the foreign-born population - Nigeria (%)
Place of birth for the foreign-born population - Senegal (%)
Place of birth for the foreign-born population - Sierra Leone (%)
Place of birth for the foreign-born population - Other Western Africa (%)
Place of birth for the foreign-born population - Australia (%)
Place of birth for the foreign-born population - New Zealand (%)
Place of birth for the foreign-born population - Fiji (%)
Place of birth for the foreign-born population - Micronesia (%)
Place of birth for the foreign-born population - Bahamas (%)
Place of birth for the foreign-born population - Barbados (%)
Place of birth for the foreign-born population - Cuba (%)
Place of birth for the foreign-born population - Dominica (%)
Place of birth for the foreign-born population - Dominican Republic (%)
Place of birth for the foreign-born population - Grenada (%)
Place of birth for the foreign-born population - Haiti (%)
Place of birth for the foreign-born population - Jamaica (%)
Place of birth for the foreign-born population - St. Vincent and the Grenadines (%)
Place of birth for the foreign-born population - Trinidad and Tobago (%)
Place of birth for the foreign-born population - West Indies (%)
Place of birth for the foreign-born population - Other Caribbean (%)
Place of birth for the foreign-born population - Belize (%)
Place of birth for the foreign-born population - Costa Rica (%)
Place of birth for the foreign-born population - El Salvador (%)
Place of birth for the foreign-born population - Guatemala (%)
Place of birth for the foreign-born population - Honduras (%)
Place of birth for the foreign-born population - Mexico (%)
Place of birth for the foreign-born population - Nicaragua (%)
Place of birth for the foreign-born population - Panama (%)
Place of birth for the foreign-born population - Other Central America (%)
Place of birth for the foreign-born population - Argentina (%)
Place of birth for the foreign-born population - Bolivia (%)
Place of birth for the foreign-born population - Brazil (%)
Place of birth for the foreign-born population - Chile (%)
Place of birth for the foreign-born population - Colombia (%)
Place of birth for the foreign-born population - Ecuador (%)
Place of birth for the foreign-born population - Guyana (%)
Place of birth for the foreign-born population - Peru (%)
Place of birth for the foreign-born population - Uruguay (%)
Place of birth for the foreign-born population - Venezuela (%)
Place of birth for the foreign-born population - Other South America (%)
Place of birth for the foreign-born population - Canada (%)
Place of birth for the foreign-born population - Other Northern America (%)
Place of birth for the foreign-born population - Other (%)
Latest news about races in Champaign, IL collected exclusively by city-data.com from local newspapers, TV, and radio stations
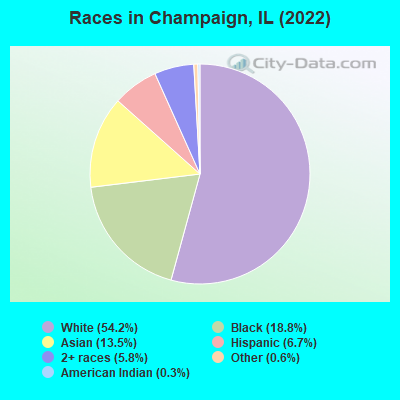
According to 2022 data, the most numerous races in Champaign, IL are White alone (48,398 residents), Hispanic (5,982 residents), and Black alone (16,771 residents). 78.2% of Champaign residents speak English at home. 17.1% of Champaign, IL residents are foreign-born (11.1% born in Asia, 2.4% born in Africa, 2.1% born in Latin America), which is 18.0% greater than the foreign-born rate of 14.0% across the entire state of Illinois.
Race distribution in Champaign
2000 2022
48,168 71.3% White alone 10,471 15.5% Black alone 4,591 6.8% Asian alone 2,724 4.0% Hispanic 1,267 1.9% Two or more races 145 0.2% Other race alone 132 0.2% American Indian alone 20 0.03% Native Hawaiian and Other
48,398 54.2% White alone 16,771 18.8% Black alone 12,087 13.5% Asian alone 5,982 6.7% Hispanic 5,215 5.8% Two or more races 552 0.6% Other race alone 240 0.3% American Indian alone
2000 2022
8,424,140 67.8% White alone 1,856,152 14.9% Black alone 1,530,262 12.3% Hispanic 419,916 3.4% Asian alone 153,996 1.2% Two or more races 13,479 0.1% Other race alone 18,232 0.1% American Indian alone 3,116 0.03% Native Hawaiian and Other
7,356,301 58.5% White alone 2,299,726 18.3% Hispanic 1,660,423 13.2% Black alone 747,296 5.9% Asian alone 458,599 3.6% Two or more races 45,386 0.4% Other race alone 10,405 0.08% American Indian alone 3,896 0.03% Native Hawaiian and Other
Income and house value in Champaign Median household income in 2022 $64,161 White non-Hispanic householders$28,963 Black householders$51,965 Asian householdersover $200,000 Some other race householders$66,051 Two or more races householders$40,552 Hispanic or Latino race householdersMedian 2022 house value $223,763 White Non-Hispanic householders$138,846 Black or African American householders$134,589 American Indian or Alaska Native householders $227,784 Asian householders$186,863 Some other race householders$212,882 Two or more races householders$220,451 Hispanic or Latino householders
Median age by race in Champaign
30.9 Median age for White residents30.7 31.0 25.5 Median age for Black or African American residents25.6 25.2 12.9 Median age for American Indian / Alaska Native residents41.3 12.6 24.2 Median age for Asian residents25.1 22.6 -666,666,666.0 Median age for Native Hawaiian / Pacific Islander residents-666,666,666.0 -666,666,666.0 21.5 Median age for Other race residents32.3 21.2 18.7 Median age for Two or more races residents22.3 14.0 32.3 Median age for White alone residents32.3 32.1 22.3 Median age for Hispanic or Latino residents23.3 21.5
Owner/renter occupied households by race in Champaign
House owners and renters - White residents 11,912 52.2% Owner occupied10,902 47.8% Renter occupiedHouse owners and renters - Black or African American residents 1,969 26.4% Owner occupied5,487 73.6% Renter occupiedHouse owners and renters - American Indian / Alaska Native residents 92 58.9% Owner occupied64 41.1% Renter occupiedHouse owners and renters - Asian residents 973 21.5% Owner occupied3,547 78.5% Renter occupiedHouse owners and renters - Other race residents 220 50.5% Owner occupied216 49.5% Renter occupiedHouse owners and renters - Two or more races residents 471 33.2% Owner occupied949 66.8% Renter occupiedHouse owners and renters - White alone residents 11,881 53.4% Owner occupied10,367 46.6% Renter occupiedHouse owners and renters - Hispanic or Latino residents 415 20.9% Owner occupied1,574 79.1% Renter occupied
Language usage in Champaign
English speakers - Total 78.2% of residents of Champaign speak English at home.
4.8% of residents speak Spanish at home 3,490 84.1% Speak English very well660 15.9% Speak English less than very well16.9% of residents speak other language at home 9,333 64.4% Speak English very well5,155 35.6% Speak English less than very well
English speakers - Born in the United States 89.3% of residents of Champaign speak English at home.
4.1% of residents speak Spanish at home 777 100.0% Speak English very well6.7% of residents speak other language at home 1,265 100.0% Speak English very well
English speakers - Native, born elsewhere 58.3% of residents of Champaign speak English at home.
9.2% of residents speak Spanish at home 280 100.0% Speak English very well32.5% of residents speak other language at home 274 27.9% Speak English very well709 72.1% Speak English less than very well
English speakers - Foreign-born 6.1% of residents of Champaign speak English at home.
10.5% of residents speak Spanish at home 882 68.4% Speak English very well408 31.6% Speak English less than very well83.4% of residents speak other language at home 6,001 58.4% Speak English very well4,270 41.6% Speak English less than very well
White (Caucasian) - Speak only English Native:
97.2% (44,888)Foreign-born:
12.7% (349)
White (Caucasian) - Speak another language Native:
2.8% (1,304)Foreign-born:
87.3% (2,402)
Black or African American - Speak only English Native:
97.4% (11,714)Foreign-born:
4.3% (71)
Black or African American - Speak another language Native:
2.6% (309)Foreign-born:
97.6% (1,609)
Asian - Speak only English Native:
37.7% (1,946)Foreign-born:
4.7% (305)
Asian - Speak another language Native:
62.3% (3,215)Foreign-born:
95.3% (6,225)
Other race - Speak only English Native:
33.0% (339)Foreign-born:
4.4% (41)
Other race - Speak another language Native:
66.2% (680)Foreign-born:
97.1% (915)
Two or more races - Speak only English Native:
71.9% (3,716)Foreign-born:
18.7% (130)
Two or more races - Speak another language Native:
28.4% (1,468)Foreign-born:
79.3% (549)
White alone - Speak only English Native:
98.5% (44,412)Foreign-born:
12.7% (281)
White alone - Speak another language Native:
1.5% (694)Foreign-born:
87.3% (1,928)
Hispanic or Latino - Speak only English Native:
31.1% (1,212)Foreign-born:
7.1% (94)
Hispanic or Latino - Speak another language Native:
68.9% (2,691)Foreign-born:
92.9% (1,231)
Foreign-born residents in Champaign 15,124 residents are foreign born (11.1% Asia , 2.4% Africa , 2.1% Latin America ).
This city:
17.1%Illinois:
14.1%
Marital status for residents in Champaign Marital status - White (Caucasian) population 15 years and over
Males 55.1% Never married36.4% Now married1.6% Separated0.5% Widowed6.4% DivorcedFemales 46.4% Never married41.2% Now married0.8% Separated5.4% Widowed6.3% DivorcedWomen who gave birth in the past 12 months Now married:
84.7% (311)Unmarried:
15.3% (56)
Women who did not give birth in the past 12 months Now married:
29.9% (4,390)Unmarried:
70.1% (10,308)
Marital status - Black or African American population 15 years and over
Males 61.9% Never married25.4% Now married0.0% Separated2.8% Widowed9.9% DivorcedFemales 65.0% Never married16.4% Now married1.2% Separated5.5% Widowed11.9% DivorcedWomen who gave birth in the past 12 months Now married:
50.7% (116)Unmarried:
49.3% (113)
Women who did not give birth in the past 12 months Now married:
10.4% (454)Unmarried:
89.6% (3,916)
Marital status - American Indian / Alaska Native population 15 years and over
Males 0.0% Never married43.6% Now married0.0% Separated0.0% Widowed56.4% DivorcedFemales 47.1% Never married20.6% Now married0.0% Separated32.4% Widowed0.0% DivorcedWomen who did not give birth in the past 12 months Now married:
30.4% (12)Unmarried:
69.6% (27)
Marital status - Asian population 15 years and over
Males 65.3% Never married32.7% Now married0.0% Separated0.0% Widowed2.0% DivorcedFemales 60.0% Never married35.6% Now married0.3% Separated1.2% Widowed2.8% DivorcedWomen who gave birth in the past 12 months Now married:
100.0% (170)Unmarried:
0.0% (0)
Women who did not give birth in the past 12 months Now married:
18.5% (870)Unmarried:
81.5% (3,832)
Marital status - Native Hawaiian / Pacific Islander population 15 years and over
Males 0.0% Never married0.0% Now married0.0% Separated0.0% Widowed100.0% DivorcedFemales 100.0% Never married0.0% Now married0.0% Separated0.0% Widowed0.0% DivorcedWomen who did not give birth in the past 12 months Now married:
0.0% (0)Unmarried:
100.0% (9)
Marital status - Other race population 15 years and over
Males 47.6% Never married45.8% Now married2.9% Separated1.3% Widowed2.5% DivorcedFemales 55.9% Never married35.3% Now married0.0% Separated6.4% Widowed2.4% DivorcedWomen who did not give birth in the past 12 months Now married:
26.7% (137)Unmarried:
73.3% (377)
Marital status - Two or more races population 15 years and over
Males 64.9% Never married29.6% Now married0.0% Separated0.4% Widowed5.1% DivorcedFemales 71.0% Never married13.8% Now married2.8% Separated1.7% Widowed10.7% DivorcedWomen who gave birth in the past 12 months Now married:
41.9% (69)Unmarried:
58.1% (96)
Women who did not give birth in the past 12 months Now married:
7.0% (85)Unmarried:
93.0% (1,143)
Marital status - White alone, not Hispanic / Latino population 15 years and over
Males 54.6% Never married36.7% Now married1.6% Separated0.5% Widowed6.6% DivorcedFemales 46.3% Never married41.2% Now married0.8% Separated5.5% Widowed6.3% DivorcedWomen who gave birth in the past 12 months Now married:
100.0% (311)Unmarried:
0.0% (0)
Women who did not give birth in the past 12 months Now married:
29.3% (4,148)Unmarried:
70.7% (10,009)
Marital status - Hispanic or Latino population 15 years and over
Males 55.4% Never married40.4% Now married1.0% Separated1.6% Widowed1.7% DivorcedFemales 62.5% Never married33.1% Now married0.0% Separated2.2% Widowed2.3% DivorcedWomen who gave birth in the past 12 months Now married:
0.0% (0)Unmarried:
100.0% (10)
Women who did not give birth in the past 12 months Now married:
29.1% (430)Unmarried:
70.9% (1,047)
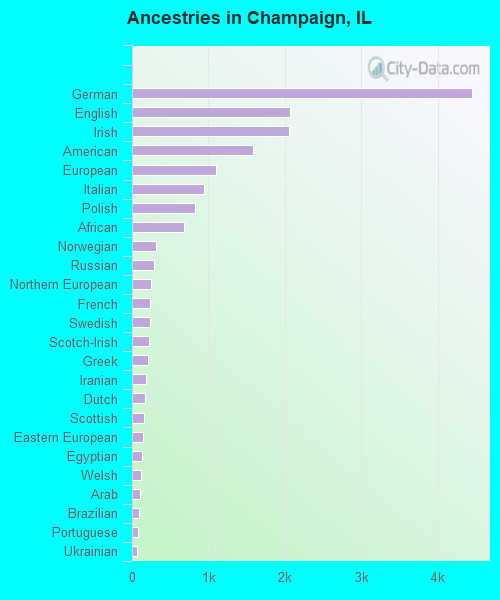
Ancestries in Champaign
4,448 10.3% German2,064 4.8% English2,059 4.8% Irish1,588 3.7% American1,096 2.5% European937 2.2% Italian824 1.9% Polish679 1.6% African311 0.7% Norwegian285 0.7% Russian250 0.6% Northern European236 0.5% French231 0.5% Swedish223 0.5% Scotch-Irish207 0.5% Greek179 0.4% Iranian172 0.4% Dutch154 0.4% Scottish150 0.3% Eastern European128 0.3% Egyptian112 0.3% Welsh100 0.2% Arab87 0.2% Brazilian77 0.2% Portuguese67 0.2% Ukrainian63 0.1% Czech60 0.1% Moroccan60 0.1% Swiss53 0.1% Hungarian49 0.1% British47 0.1% Scandinavian44 0.1% Czechoslovakian42 0.10% Turkish36 0.08% Austrian34 0.08% Nigerian31 0.07% Israeli30 0.07% Lebanese30 0.07% Jamaican27 0.06% Croatian27 0.06% Slovak26 0.06% Latvian22 0.05% Belizean20 0.05% Kenyan18 0.04% Yugoslavian17 0.04% Danish15 0.03% Finnish15 0.03% West Indian14 0.03% South African12 0.03% Lithuanian12 0.03% Serbian10 0.02% Romanian10 0.02% French Canadian9 0.02% Cypriot9 0.02% Ethiopian8 0.02% Australian5 0.01% Ghanaian3 0.01% Bulgarian3 0.01% Albanian
Geographical mobility in Champaign Same house 1 year ago 33,802 67.7% White (Caucasian)12,469 83.7% Black or African American271 98.0% American Indian / Alaska Native6,509 54.5% Asian20 76.8% Native Hawaiian / Pacific Islander1,538 74.3% Other race5,666 80.2% Two or more races32,917 68.4% White alone, not Hispanic / Latino3,229 55.8% Hispanic or LatinoMoved within same county 6,895 13.8% White / Caucasian1,226 8.2% Black or African American5 1.7% American Indian / Alaska Native2,938 24.6% Asian241 11.6% Other race920 13.0% Two or more races6,796 14.1% White alone, not Hispanic / Latino1,063 18.4% Hispanic or LatinoMoved within same state 5,747 11.5% White / Caucasian585 3.9% Black or African American602 5.0% Asian7 25.2% Native Hawaiian / Pacific Islander170 8.2% Other race270 3.8% Two or more races5,473 11.4% White alone, not Hispanic / Latino746 12.9% Hispanic or LatinoMoved from different state 2,285 4.6% White / Caucasian422 2.8% Black or African American771 6.5% Asian30 1.4% Other race207 2.9% Two or more races2,115 4.4% White alone, not Hispanic / Latino371 6.4% Hispanic or LatinoMoved from abroad 1,193 2.4% White5 0.0% Black or African American1,132 9.5% Asian16 0.8% Other race826 1.7% White alone, not Hispanic / Latino375 6.5% Hispanic or Latino
Children Nativity (place of birth) in Champaign
Children under 6 years - Living with two parents Both parents native 1,353 100.0% NativeBoth parents foreign-born 1,625 96.4% Native60 3.6% Foreign-bornOne native, one foreign-born parent 778 100.0% NativeChildren under 6 years - Living with one parent Native parent 1,216 98.9% Native13 1.1% Foreign-bornForeign-born parent 128 100.0% NativeChildren 6 to 17 years - Living with two parents Both parents native 2,541 99.9% Native2 0.1% Foreign-bornBoth parents foreign-born 1,311 76.4% Native406 23.6% Foreign-bornOne native, one foreign-born parent 1,968 100.0% NativeChildren 6 to 17 years - Living with one parent Native parent 1,728 97.2% Native50 2.8% Foreign-bornForeign-born parent 578 67.5% Native278 32.5% Foreign-born
Place of birth for residents in Champaign 9,888 Asia5,632 Eastern Asia4,268 China2,682 South Central Asia2,108 Africa1,998 Americas1,832 Latin America1,204 Middle Africa1,198 South Eastern Asia1,136 Central America1,086 Europe652 South America435 Eastern Europe375 Western Asia300 Northern Europe252 Northern Africa185 Western Europe166 Northern America164 Southern Europe129 Western Africa53 Eastern Africa43 Caribbean42 Oceania20 Southern Africa18 Australia and New Zealand Subregion4,043 China2,225 India1,118 Korea967 Democratic Republic of Congo (Zaire)807 Mexico625 Philippines402 Vietnam299 Brazil209 Russia192 United Kingdom189 Taiwan181 Cameroon166 Canada166 Guatemala152 Egypt145 Japan139 Argentina125 Jordan124 Iran122 Germany121 Nigeria116 Poland112 Italy103 Nepal101 Pakistan94 Laos89 Peru81 Bangladesh74 Israel71 Norway67 Panama66 El Salvador58 Turkey55 Congo54 Venezuela54 Saudi Arabia52 Thailand51 Morocco49 Algeria49 Colombia48 Austria36 Hong Kong36 Kazakhstan35 Czechoslovakia29 Costa Rica27 Cuba26 Greece25 Lebanon24 Micronesia23 Syria23 Serbia23 Ukraine20 South Africa18 Ecuador18 England17 Hungary15 Portugal15 Netherlands14 Jamaica13 New Zealand13 Indonesia11 Ireland11 Spain10 Sri Lanka9 Ethiopia9 Malaysia8 Togo8 Sweden5 Australia3 Chile3 Bulgaria2 Haiti2 Burma (Myanmar)
Grandparents responsible for own grandchildren in Champaign
Grandparents (30 to 59 years) White / Caucasian 138 79.4% Responsible for grandchildren36 20.6% Not responsible for grandchildrenBlack or African American 31 31.3% Responsible for grandchildren68 68.7% Not responsible for grandchildrenAsian 72 100.0% Not responsible for grandchildrenWhite alone, not Hispanic / Latino 152 77.6% Responsible for grandchildren44 22.4% Not responsible for grandchildrenGrandparents (60 years and over) White / Caucasian 57 42.3% Responsible for grandchildren77 57.7% Not responsible for grandchildrenBlack or African American 39 38.2% Responsible for grandchildren63 61.8% Not responsible for grandchildrenAsian 81 41.7% Responsible for grandchildren113 58.3% Not responsible for grandchildrenWhite alone, not Hispanic / Latino 61 41.2% Responsible for grandchildren87 58.8% Not responsible for grandchildren