Races in Cibolo, Texas (TX) Detailed Stats
Data:
Races - White alone (%)
Races - White alone (% change since 2000)
Races - Black alone (%)
Races - Black alone (% change since 2000)
Races - American Indian alone (%)
Races - American Indian alone (% change since 2000)
Races - Asian alone (%)
Races - Asian alone (% change since 2000)
Races - Hispanic (%)
Races - Hispanic (% change since 2000)
Races - Native Hawaiian and Other Pacific Islander alone (%)
Races - Native Hawaiian and Other Pacific Islander alone (% change since 2000)
Races - Two or more races(%)
Races - Two or more races(% change since 2000)
Races - Other race alone (%)
Races - Other race alone (% change since 2000)
Racial diversity
Place of birth - Born in state of residence (%)
Place of birth - Born in state of residence (%) - White
Place of birth - Born in state of residence (%) - Black or African American
Place of birth - Born in state of residence (%) - Asian
Place of birth - Born in state of residence (%) - Hispanic or Latino
Place of birth - Born in state of residence (%) - American Indian and Alaska Native
Place of birth - Born in state of residence (%) - Multirace
Place of birth - Born in state of residence (%) - Other Race
Place of birth - Born in other state (%)
Place of birth - Born in other state (%) - White
Place of birth - Born in other state (%) - Black or African American
Place of birth - Born in other state (%) - Asian
Place of birth - Born in other state (%) - Hispanic or Latino
Place of birth - Born in other state (%) - American Indian and Alaska Native
Place of birth - Born in other state (%) - Multirace
Place of birth - Born in other state (%) - Other Race
Place of birth - Native, outside of US (%)
Place of birth - Native, outside of US (%) - White
Place of birth - Native, outside of US (%) - Black or African American
Place of birth - Native, outside of US (%) - Asian
Place of birth - Native, outside of US (%) - Hispanic or Latino
Place of birth - Native, outside of US (%) - American Indian and Alaska Native
Place of birth - Native, outside of US (%) - Multirace
Place of birth - Native, outside of US (%) - Other Race
Place of birth - Foreign born (%)
Place of birth - Foreign born (%) - White
Place of birth - Foreign born (%) - Black or African American
Place of birth - Foreign born (%) - Asian
Place of birth - Foreign born (%) - Hispanic or Latino
Place of birth - Foreign born (%) - American Indian and Alaska Native
Place of birth - Foreign born (%) - Multirace
Place of birth - Foreign born (%) - Other Race
Residents speaking English at home (%)
Residents speaking English at home - Born in the United States (%)
Residents speaking English at home - Native, born elsewhere (%)
Residents speaking English at home - Foreign born (%)
Residents speaking Spanish at home (%)
Residents speaking Spanish at home - Born in the United States (%)
Residents speaking Spanish at home - Native, born elsewhere (%)
Residents speaking Spanish at home - Foreign born (%)
Residents speaking other language at home (%)
Residents speaking other language at home - Born in the United States (%)
Residents speaking other language at home - Native, born elsewhere (%)
Residents speaking other language at home - Foreign born (%)
Marital status - Never married (%)
Marital status - Now married (%)
Marital status - Separated (%)
Marital status - Widowed (%)
Marital status - Divorced (%)
Ancestries Reported - Arab (%)
Ancestries Reported - Czech (%)
Ancestries Reported - Danish (%)
Ancestries Reported - Dutch (%)
Ancestries Reported - English (%)
Ancestries Reported - French (%)
Ancestries Reported - French Canadian (%)
Ancestries Reported - German (%)
Ancestries Reported - Greek (%)
Ancestries Reported - Hungarian (%)
Ancestries Reported - Irish (%)
Ancestries Reported - Italian (%)
Ancestries Reported - Lithuanian (%)
Ancestries Reported - Norwegian (%)
Ancestries Reported - Polish (%)
Ancestries Reported - Portuguese (%)
Ancestries Reported - Russian (%)
Ancestries Reported - Scotch-Irish (%)
Ancestries Reported - Scottish (%)
Ancestries Reported - Slovak (%)
Ancestries Reported - Subsaharan African (%)
Ancestries Reported - Swedish (%)
Ancestries Reported - Swiss (%)
Ancestries Reported - Ukrainian (%)
Ancestries Reported - United States (%)
Ancestries Reported - Welsh (%)
Ancestries Reported - West Indian (%)
Ancestries Reported - Other (%)
Geographical mobility - Same house 1 year ago (%)
Geographical mobility - Same house 1 year ago (%) - White
Geographical mobility - Same house 1 year ago (%) - Black or African American
Geographical mobility - Same house 1 year ago (%) - Asian
Geographical mobility - Same house 1 year ago (%) - Hispanic or Latino
Geographical mobility - Same house 1 year ago (%) - American Indian and Alaska Native
Geographical mobility - Same house 1 year ago (%) - Multirace
Geographical mobility - Same house 1 year ago (%) - Other Race
Geographical mobility - Moved within same county (%)
Geographical mobility - Moved within same county (%) - White
Geographical mobility - Moved within same county (%) - Black or African American
Geographical mobility - Moved within same county (%) - Asian
Geographical mobility - Moved within same county (%) - Hispanic or Latino
Geographical mobility - Moved within same county (%) - American Indian and Alaska Native
Geographical mobility - Moved within same county (%) - Multirace
Geographical mobility - Moved within same county (%) - Other Race
Geographical mobility - Moved from different county within same state (%)
Geographical mobility - Moved from different county within same state (%) - White
Geographical mobility - Moved from different county within same state (%) - Black or African American
Geographical mobility - Moved from different county within same state (%) - Asian
Geographical mobility - Moved from different county within same state (%) - Hispanic or Latino
Geographical mobility - Moved from different county within same state (%) - American Indian and Alaska Native
Geographical mobility - Moved from different county within same state (%) - Multirace
Geographical mobility - Moved from different county within same state (%) - Other Race
Geographical mobility - Moved from different state (%)
Geographical mobility - Moved from different state (%) - White
Geographical mobility - Moved from different state (%) - Black or African American
Geographical mobility - Moved from different state (%) - Asian
Geographical mobility - Moved from different state (%) - Hispanic or Latino
Geographical mobility - Moved from different state (%) - American Indian and Alaska Native
Geographical mobility - Moved from different state (%) - Multirace
Geographical mobility - Moved from different state (%) - Other Race
Geographical mobility - Moved from abroad (%)
Geographical mobility - Moved from abroad (%) - White
Geographical mobility - Moved from abroad (%) - Black or African American
Geographical mobility - Moved from abroad (%) - Asian
Geographical mobility - Moved from abroad (%) - Hispanic or Latino
Geographical mobility - Moved from abroad (%) - American Indian and Alaska Native
Geographical mobility - Moved from abroad (%) - Multirace
Geographical mobility - Moved from abroad (%) - Other Race
Place of birth for the foreign-born population - Ireland (%)
Place of birth for the foreign-born population - Denmark (%)
Place of birth for the foreign-born population - Norway (%)
Place of birth for the foreign-born population - Sweden (%)
Place of birth for the foreign-born population - United Kingdom (%)
Place of birth for the foreign-born population - England (%)
Place of birth for the foreign-born population - Scotland (%)
Place of birth for the foreign-born population - Other Northern Europe (%)
Place of birth for the foreign-born population - Austria (%)
Place of birth for the foreign-born population - Belgium (%)
Place of birth for the foreign-born population - France (%)
Place of birth for the foreign-born population - Germany (%)
Place of birth for the foreign-born population - Netherlands (%)
Place of birth for the foreign-born population - Switzerland (%)
Place of birth for the foreign-born population - Other Western Europe (%)
Place of birth for the foreign-born population - Greece (%)
Place of birth for the foreign-born population - Italy (%)
Place of birth for the foreign-born population - Portugal (%)
Place of birth for the foreign-born population - Spain (%)
Place of birth for the foreign-born population - Other Southern Europe (%)
Place of birth for the foreign-born population - Albania (%)
Place of birth for the foreign-born population - Belarus (%)
Place of birth for the foreign-born population - Bosnia and Herzegovina (%)
Place of birth for the foreign-born population - Bulgaria (%)
Place of birth for the foreign-born population - Croatia (%)
Place of birth for the foreign-born population - Czechoslovakia (%)
Place of birth for the foreign-born population - Hungary (%)
Place of birth for the foreign-born population - Latvia (%)
Place of birth for the foreign-born population - Lithuania (%)
Place of birth for the foreign-born population - North Macedonia (Macedonia) (%)
Place of birth for the foreign-born population - Moldova (%)
Place of birth for the foreign-born population - Poland (%)
Place of birth for the foreign-born population - Romania (%)
Place of birth for the foreign-born population - Russia (%)
Place of birth for the foreign-born population - Serbia (%)
Place of birth for the foreign-born population - Ukraine (%)
Place of birth for the foreign-born population - Other Eastern Europe (%)
Place of birth for the foreign-born population - China (%)
Place of birth for the foreign-born population - Hong Kong (%)
Place of birth for the foreign-born population - Taiwan (%)
Place of birth for the foreign-born population - Japan (%)
Place of birth for the foreign-born population - Korea (%)
Place of birth for the foreign-born population - Other Eastern Asia (%)
Place of birth for the foreign-born population - Afghanistan (%)
Place of birth for the foreign-born population - Bangladesh (%)
Place of birth for the foreign-born population - India (%)
Place of birth for the foreign-born population - Iran (%)
Place of birth for the foreign-born population - Kazakhstan (%)
Place of birth for the foreign-born population - Nepal (%)
Place of birth for the foreign-born population - Pakistan (%)
Place of birth for the foreign-born population - Sri Lanka (%)
Place of birth for the foreign-born population - Uzbekistan (%)
Place of birth for the foreign-born population - Other South Central Asia (%)
Place of birth for the foreign-born population - Burma (%)
Place of birth for the foreign-born population - Cambodia (%)
Place of birth for the foreign-born population - Indonesia (%)
Place of birth for the foreign-born population - Laos (%)
Place of birth for the foreign-born population - Malaysia (%)
Place of birth for the foreign-born population - Philippines (%)
Place of birth for the foreign-born population - Singapore (%)
Place of birth for the foreign-born population - Thailand (%)
Place of birth for the foreign-born population - Vietnam (%)
Place of birth for the foreign-born population - Other South Eastern Asia (%)
Place of birth for the foreign-born population - Armenia (%)
Place of birth for the foreign-born population - Iraq (%)
Place of birth for the foreign-born population - Israel (%)
Place of birth for the foreign-born population - Jordan (%)
Place of birth for the foreign-born population - Kuwait (%)
Place of birth for the foreign-born population - Lebanon (%)
Place of birth for the foreign-born population - Saudi Arabia (%)
Place of birth for the foreign-born population - Syria (%)
Place of birth for the foreign-born population - Turkey (%)
Place of birth for the foreign-born population - Yemen (%)
Place of birth for the foreign-born population - Other Western Asia (%)
Place of birth for the foreign-born population - Eritrea (%)
Place of birth for the foreign-born population - Ethiopia (%)
Place of birth for the foreign-born population - Kenya (%)
Place of birth for the foreign-born population - Somalia (%)
Place of birth for the foreign-born population - Uganda (%)
Place of birth for the foreign-born population - Zimbabwe (%)
Place of birth for the foreign-born population - Other Eastern Africa (%)
Place of birth for the foreign-born population - Cameroon (%)
Place of birth for the foreign-born population - Congo (%)
Place of birth for the foreign-born population - Democratic Republic of Congo (Zaire) (%)
Place of birth for the foreign-born population - Other Middle Africa (%)
Place of birth for the foreign-born population - Egypt (%)
Place of birth for the foreign-born population - Morocco (%)
Place of birth for the foreign-born population - Sudan (%)
Place of birth for the foreign-born population - Other Northern Africa (%)
Place of birth for the foreign-born population - South Africa (%)
Place of birth for the foreign-born population - Other Southern Africa (%)
Place of birth for the foreign-born population - Cabo Verde (%)
Place of birth for the foreign-born population - Ghana (%)
Place of birth for the foreign-born population - Liberia (%)
Place of birth for the foreign-born population - Nigeria (%)
Place of birth for the foreign-born population - Senegal (%)
Place of birth for the foreign-born population - Sierra Leone (%)
Place of birth for the foreign-born population - Other Western Africa (%)
Place of birth for the foreign-born population - Australia (%)
Place of birth for the foreign-born population - New Zealand (%)
Place of birth for the foreign-born population - Fiji (%)
Place of birth for the foreign-born population - Micronesia (%)
Place of birth for the foreign-born population - Bahamas (%)
Place of birth for the foreign-born population - Barbados (%)
Place of birth for the foreign-born population - Cuba (%)
Place of birth for the foreign-born population - Dominica (%)
Place of birth for the foreign-born population - Dominican Republic (%)
Place of birth for the foreign-born population - Grenada (%)
Place of birth for the foreign-born population - Haiti (%)
Place of birth for the foreign-born population - Jamaica (%)
Place of birth for the foreign-born population - St. Vincent and the Grenadines (%)
Place of birth for the foreign-born population - Trinidad and Tobago (%)
Place of birth for the foreign-born population - West Indies (%)
Place of birth for the foreign-born population - Other Caribbean (%)
Place of birth for the foreign-born population - Belize (%)
Place of birth for the foreign-born population - Costa Rica (%)
Place of birth for the foreign-born population - El Salvador (%)
Place of birth for the foreign-born population - Guatemala (%)
Place of birth for the foreign-born population - Honduras (%)
Place of birth for the foreign-born population - Mexico (%)
Place of birth for the foreign-born population - Nicaragua (%)
Place of birth for the foreign-born population - Panama (%)
Place of birth for the foreign-born population - Other Central America (%)
Place of birth for the foreign-born population - Argentina (%)
Place of birth for the foreign-born population - Bolivia (%)
Place of birth for the foreign-born population - Brazil (%)
Place of birth for the foreign-born population - Chile (%)
Place of birth for the foreign-born population - Colombia (%)
Place of birth for the foreign-born population - Ecuador (%)
Place of birth for the foreign-born population - Guyana (%)
Place of birth for the foreign-born population - Peru (%)
Place of birth for the foreign-born population - Uruguay (%)
Place of birth for the foreign-born population - Venezuela (%)
Place of birth for the foreign-born population - Other South America (%)
Place of birth for the foreign-born population - Canada (%)
Place of birth for the foreign-born population - Other Northern America (%)
Place of birth for the foreign-born population - Other (%)
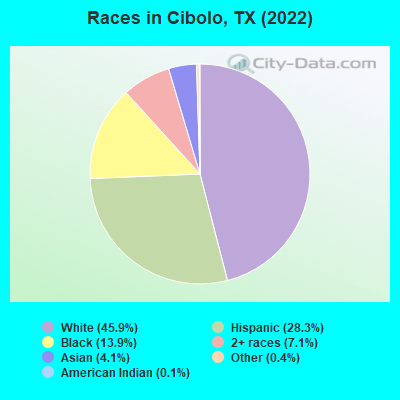
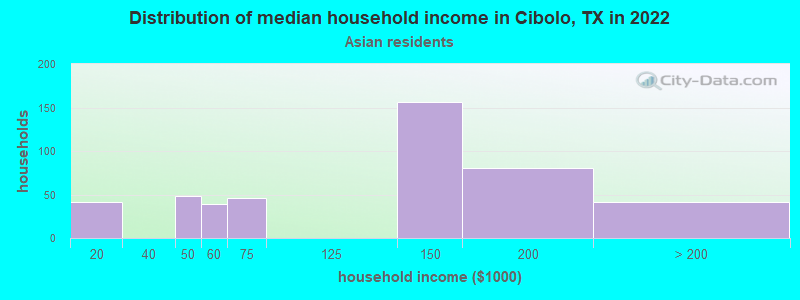
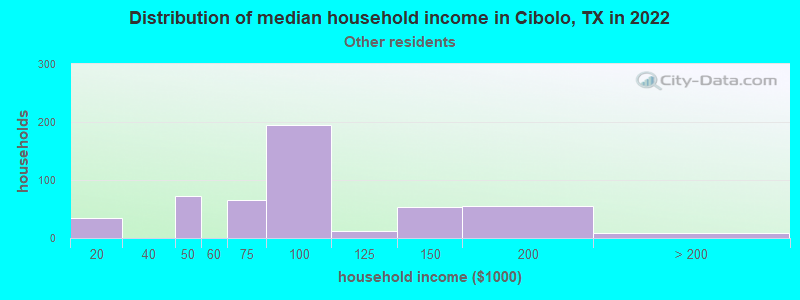
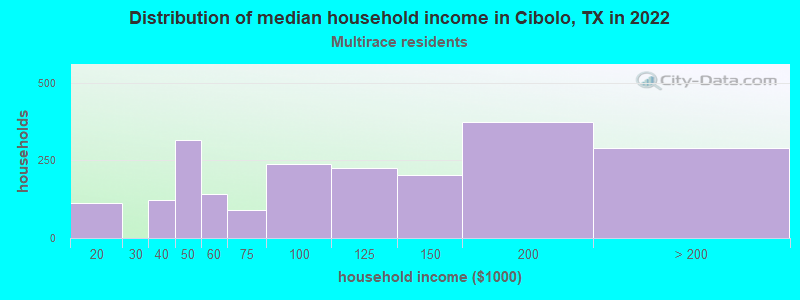
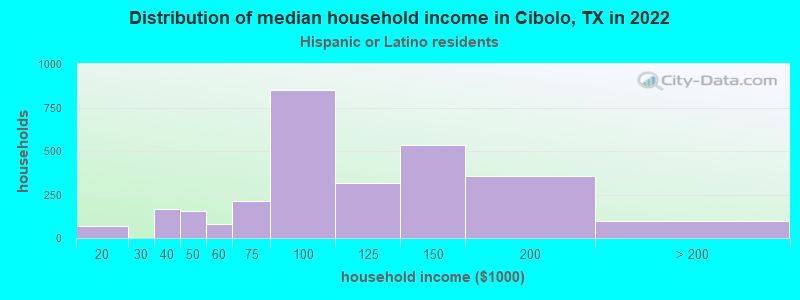
According to 2022 data, the most numerous races in Cibolo, TX are Hispanic (9,700 residents), White alone (15,740 residents), and Black alone (4,755 residents). 82.1% of Cibolo residents speak English at home. 6.0% of Cibolo, TX residents are foreign-born (2.1% born in Latin America, 2.1% born in Asia, 1.3% born in Europe), which is 181.7% less than the foreign-born rate of 17.0% across the entire state of Texas.
Race distribution in Cibolo
2000 2022
10,933,313 52.4% White alone 6,669,666 32.0% Hispanic 2,364,255 11.3% Black alone 554,445 2.7% Asian alone 230,567 1.1% Two or more races 68,859 0.3% American Indian alone 19,958 0.10% Other race alone 10,757 0.05% Native Hawaiian and Other
12,070,642 40.2% Hispanic 11,683,430 38.9% White alone 3,508,706 11.7% Black alone 1,608,173 5.4% Asian alone 956,560 3.2% Two or more races 125,763 0.4% Other race alone 47,023 0.2% American Indian alone 29,275 0.10% Native Hawaiian and Other
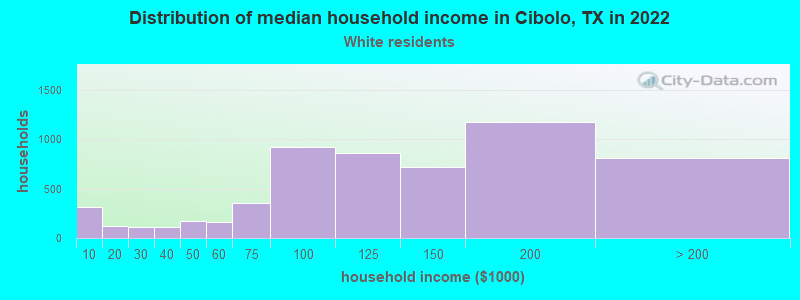
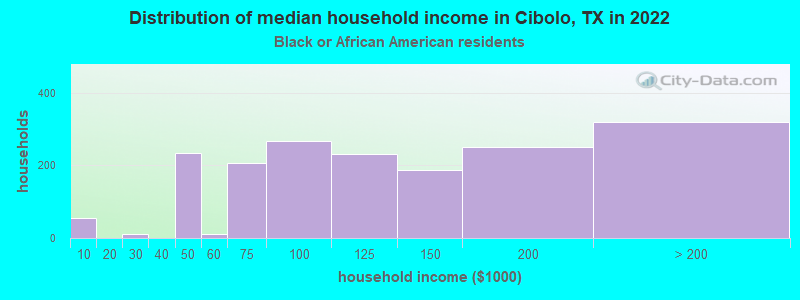
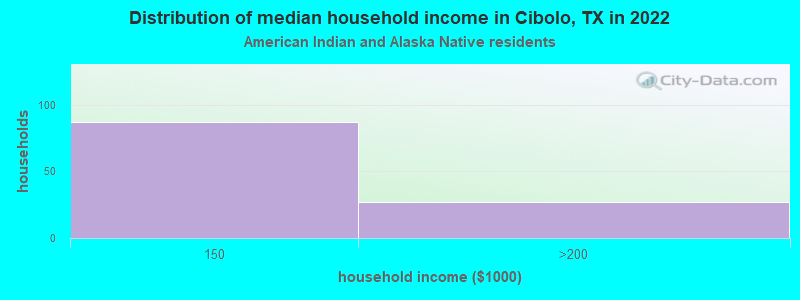
Income and house value in Cibolo Median household income in 2022 $118,994 White non-Hispanic householders$129,735 Black householders$189,745 American Indian and Alaska Native householders$145,207 Asian householders$85,808 Some other race householders$106,828 Two or more races householders$109,290 Hispanic or Latino race householdersMedian 2022 house value $359,442 White Non-Hispanic householders$504,495 Black or African American householders $235,745 Asian householders$265,421 Some other race householders$513,093 Two or more races householders$245,730 Hispanic or Latino householders
Median age by race in Cibolo
39.6 Median age for White residents36.3 40.7 37.0 Median age for Black or African American residents33.1 39.2 38.1 Median age for American Indian / Alaska Native residents50.5 42.4 32.6 Median age for Asian residents20.6 48.5 -581,560,283.1 Median age for Native Hawaiian / Pacific Islander residents-666,666,666.0 -666,666,666.0 31.7 Median age for Other race residents31.4 31.8 24.0 Median age for Two or more races residents22.6 25.5 37.5 Median age for White alone residents34.6 38.9 33.0 Median age for Hispanic or Latino residents34.6 32.0
Owner/renter occupied households by race in Cibolo
House owners and renters - White residents 5,048 87.6% Owner occupied714 12.4% Renter occupiedHouse owners and renters - Black or African American residents 1,342 81.4% Owner occupied306 18.6% Renter occupiedHouse owners and renters - American Indian / Alaska Native residents 102 78.1% Owner occupied29 21.9% Renter occupiedHouse owners and renters - Asian residents 422 94.4% Owner occupied25 5.6% Renter occupiedHouse owners and renters - Other race residents 472 75.2% Owner occupied156 24.8% Renter occupiedHouse owners and renters - Two or more races residents 1,570 75.7% Owner occupied503 24.3% Renter occupiedHouse owners and renters - White alone residents 4,637 87.7% Owner occupied650 12.3% Renter occupiedHouse owners and renters - Hispanic or Latino residents 2,363 83.1% Owner occupied481 16.9% Renter occupied
Language usage in Cibolo
English speakers - Total 82.1% of residents of Cibolo speak English at home.
11.4% of residents speak Spanish at home 3,126 85.4% Speak English very well533 14.6% Speak English less than very well6.5% of residents speak other language at home 1,842 88.0% Speak English very well252 12.0% Speak English less than very well
English speakers - Born in the United States 89.1% of residents of Cibolo speak English at home.
8.2% of residents speak Spanish at home 943 83.0% Speak English very well193 17.0% Speak English less than very well2.4% of residents speak other language at home 306 92.2% Speak English very well26 7.8% Speak English less than very well
English speakers - Native, born elsewhere 63.8% of residents of Cibolo speak English at home.
22.9% of residents speak Spanish at home 318 94.9% Speak English very well17 5.1% Speak English less than very well24.1% of residents speak other language at home 333 94.6% Speak English very well19 5.4% Speak English less than very well
English speakers - Foreign-born 29.0% of residents of Cibolo speak English at home.
28.9% of residents speak Spanish at home 477 72.5% Speak English very well181 27.5% Speak English less than very well50.2% of residents speak other language at home 976 85.3% Speak English very well168 14.7% Speak English less than very well
White (Caucasian) - Speak only English Native:
97.7% (14,666)Foreign-born:
60.2% (194)
White (Caucasian) - Speak another language Native:
4.1% (621)Foreign-born:
43.8% (141)
Black or African American - Speak only English Native:
97.8% (5,024)Foreign-born:
44.0% (78)
Black or African American - Speak another language Native:
2.2% (113)Foreign-born:
54.1% (96)
American Indian / Alaska Native - Speak another language Native:
35.2% (95)Foreign-born:
98.9% (30)
Asian - Speak only English Native:
59.8% (638)Foreign-born:
21.2% (176)
Asian - Speak another language Native:
38.5% (411)Foreign-born:
79.0% (653)
Other race - Speak another language Native:
25.5% (324)Foreign-born:
97.9% (277)
Two or more races - Speak only English Native:
63.9% (4,484)Foreign-born:
27.4% (161)
Two or more races - Speak another language Native:
31.8% (2,228)Foreign-born:
64.9% (381)
White alone - Speak only English Native:
98.5% (14,112)Foreign-born:
38.9% (225)
White alone - Speak another language Native:
1.2% (171)Foreign-born:
46.9% (271)
Hispanic or Latino - Speak only English Native:
64.1% (5,252)Foreign-born:
4.2% (33)
Hispanic or Latino - Speak another language Native:
34.2% (2,800)Foreign-born:
95.7% (751)
Foreign-born residents in Cibolo 2,071 residents are foreign born (2.1% Latin America , 2.1% Asia , 1.3% Europe ).
This city:
6.0%Texas:
17.1%
Marital status for residents in Cibolo Marital status - White (Caucasian) population 15 years and over
Males 32.0% Never married59.9% Now married0.7% Separated1.6% Widowed5.9% DivorcedFemales 22.7% Never married60.8% Now married0.7% Separated4.5% Widowed11.3% DivorcedWomen who gave birth in the past 12 months Now married:
84.0% (159)Unmarried:
16.0% (30)
Women who did not give birth in the past 12 months Now married:
56.8% (2,081)Unmarried:
43.2% (1,586)
Marital status - Black or African American population 15 years and over
Males 31.3% Never married58.5% Now married0.0% Separated3.3% Widowed6.8% DivorcedFemales 39.0% Never married38.5% Now married5.9% Separated8.3% Widowed8.2% DivorcedWomen who gave birth in the past 12 months Now married:
19.1% (17)Unmarried:
80.9% (73)
Women who did not give birth in the past 12 months Now married:
42.4% (554)Unmarried:
57.6% (753)
Marital status - American Indian / Alaska Native population 15 years and over
Males 22.4% Never married77.6% Now married0.0% Separated0.0% Widowed0.0% DivorcedFemales 28.6% Never married66.7% Now married0.0% Separated0.0% Widowed4.8% DivorcedWomen who did not give birth in the past 12 months Now married:
63.9% (76)Unmarried:
36.1% (43)
Marital status - Asian population 15 years and over
Males 64.3% Never married35.7% Now married0.0% Separated0.0% Widowed0.0% DivorcedFemales 21.5% Never married57.5% Now married6.7% Separated2.2% Widowed12.1% DivorcedWomen who gave birth in the past 12 months Now married:
100.0% (45)Unmarried:
0.0% (0)
Women who did not give birth in the past 12 months Now married:
46.4% (146)Unmarried:
53.6% (169)
Marital status - Other race population 15 years and over
Males 14.1% Never married70.0% Now married4.2% Separated0.0% Widowed11.6% DivorcedFemales 23.9% Never married76.1% Now married0.0% Separated0.0% Widowed0.0% DivorcedWomen who gave birth in the past 12 months Now married:
100.0% (24)Unmarried:
0.0% (0)
Women who did not give birth in the past 12 months Now married:
65.1% (281)Unmarried:
34.9% (151)
Marital status - Two or more races population 15 years and over
Males 51.7% Never married43.3% Now married1.5% Separated0.3% Widowed3.2% DivorcedFemales 37.3% Never married40.3% Now married1.9% Separated5.1% Widowed15.4% DivorcedWomen who gave birth in the past 12 months Now married:
6.4% (10)Unmarried:
93.6% (141)
Women who did not give birth in the past 12 months Now married:
45.5% (1,066)Unmarried:
54.5% (1,276)
Marital status - White alone, not Hispanic / Latino population 15 years and over
Males 31.5% Never married61.7% Now married0.8% Separated1.9% Widowed4.1% DivorcedFemales 20.7% Never married63.5% Now married0.6% Separated4.7% Widowed10.5% DivorcedWomen who gave birth in the past 12 months Now married:
100.0% (174)Unmarried:
0.0% (0)
Women who did not give birth in the past 12 months Now married:
57.9% (2,063)Unmarried:
42.1% (1,500)
Marital status - Hispanic or Latino population 15 years and over
Males 35.9% Never married54.5% Now married1.4% Separated0.2% Widowed8.0% DivorcedFemales 34.7% Never married47.8% Now married1.1% Separated4.4% Widowed11.9% DivorcedWomen who gave birth in the past 12 months Now married:
16.4% (39)Unmarried:
83.6% (198)
Women who did not give birth in the past 12 months Now married:
50.0% (1,278)Unmarried:
50.0% (1,278)
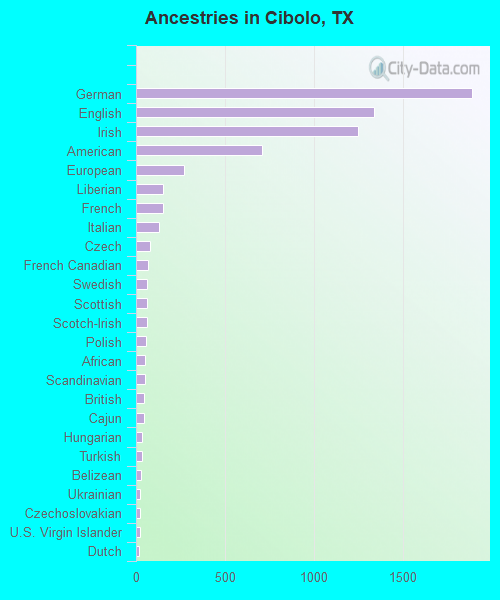
Ancestries in Cibolo
1,891 11.2% German1,341 7.9% English1,250 7.4% Irish711 4.2% American268 1.6% European153 0.9% Liberian151 0.9% French129 0.8% Italian77 0.5% Czech68 0.4% French Canadian63 0.4% Swedish62 0.4% Scottish61 0.4% Scotch-Irish55 0.3% Polish51 0.3% African49 0.3% Scandinavian47 0.3% British46 0.3% Cajun36 0.2% Hungarian31 0.2% Turkish26 0.2% Belizean25 0.1% Ukrainian21 0.1% Czechoslovakian21 0.1% U.S. Virgin Islander18 0.1% Dutch18 0.1% Bulgarian16 0.09% Norwegian15 0.09% Canadian13 0.08% Guyanese10 0.06% Northern European9 0.05% Belgian9 0.05% Greek4 0.02% Dutch West Indian
Geographical mobility in Cibolo Same house 1 year ago 13,077 81.8% White (Caucasian)4,817 84.5% Black or African American324 100.0% American Indian / Alaska Native1,393 95.7% Asian1,447 84.0% Other race7,308 88.3% Two or more races12,988 83.1% White alone, not Hispanic / Latino7,815 82.2% Hispanic or LatinoMoved within same county 802 5.0% White / Caucasian153 2.7% Black or African American32 0.4% Two or more races702 4.5% White alone, not Hispanic / Latino94 1.0% Hispanic or LatinoMoved within same state 1,056 6.6% White / Caucasian302 5.3% Black or African American436 5.3% Two or more races887 5.7% White alone, not Hispanic / Latino431 4.5% Hispanic or LatinoMoved from different state 625 3.9% White / Caucasian560 9.8% Black or African American56 3.2% Other race746 9.0% Two or more races508 3.3% White alone, not Hispanic / Latino622 6.5% Hispanic or LatinoMoved from abroad 315 2.0% White60 4.1% Asian83 1.0% Two or more races162 1.0% White alone, not Hispanic / Latino
Children Nativity (place of birth) in Cibolo
Children under 6 years - Living with two parents Both parents native 1,899 100.0% NativeBoth parents foreign-born 95 100.0% NativeOne native, one foreign-born parent 179 100.0% NativeChildren under 6 years - Living with one parent Native parent 505 100.0% NativeForeign-born parent 103 100.0% NativeChildren 6 to 17 years - Living with two parents Both parents native 3,954 99.7% Native12 0.3% Foreign-bornBoth parents foreign-born 429 100.0% NativeOne native, one foreign-born parent 519 94.9% Native28 5.1% Foreign-bornChildren 6 to 17 years - Living with one parent Native parent 954 100.0% NativeForeign-born parent 146 54.2% Native124 45.8% Foreign-born
Grandparents responsible for own grandchildren in Cibolo
Grandparents (30 to 59 years) White / Caucasian 64 66.8% Responsible for grandchildren32 33.2% Not responsible for grandchildrenBlack or African American 66 100.0% Not responsible for grandchildrenTwo or more races 172 39.7% Responsible for grandchildren260 60.3% Not responsible for grandchildrenWhite alone, not Hispanic / Latino 11 13.2% Responsible for grandchildren75 86.8% Not responsible for grandchildrenHispanic or Latino 152 49.9% Responsible for grandchildren153 50.1% Not responsible for grandchildrenGrandparents (60 years and over) White / Caucasian 49 20.7% Responsible for grandchildren186 79.3% Not responsible for grandchildrenBlack or African American 39 100.0% Responsible for grandchildrenTwo or more races 11 100.0% Not responsible for grandchildrenWhite alone, not Hispanic / Latino 22 23.8% Responsible for grandchildren69 76.2% Not responsible for grandchildrenHispanic or Latino 123 45.2% Responsible for grandchildren149 54.8% Not responsible for grandchildren