Races in Cloverleaf, Texas (TX) Detailed Stats
Data:
Races - White alone (%)
Races - White alone (% change since 2000)
Races - Black alone (%)
Races - Black alone (% change since 2000)
Races - American Indian alone (%)
Races - American Indian alone (% change since 2000)
Races - Asian alone (%)
Races - Asian alone (% change since 2000)
Races - Hispanic (%)
Races - Hispanic (% change since 2000)
Races - Native Hawaiian and Other Pacific Islander alone (%)
Races - Native Hawaiian and Other Pacific Islander alone (% change since 2000)
Races - Two or more races(%)
Races - Two or more races(% change since 2000)
Races - Other race alone (%)
Races - Other race alone (% change since 2000)
Racial diversity
Place of birth - Born in state of residence (%)
Place of birth - Born in state of residence (%) - White
Place of birth - Born in state of residence (%) - Black or African American
Place of birth - Born in state of residence (%) - Asian
Place of birth - Born in state of residence (%) - Hispanic or Latino
Place of birth - Born in state of residence (%) - American Indian and Alaska Native
Place of birth - Born in state of residence (%) - Multirace
Place of birth - Born in state of residence (%) - Other Race
Place of birth - Born in other state (%)
Place of birth - Born in other state (%) - White
Place of birth - Born in other state (%) - Black or African American
Place of birth - Born in other state (%) - Asian
Place of birth - Born in other state (%) - Hispanic or Latino
Place of birth - Born in other state (%) - American Indian and Alaska Native
Place of birth - Born in other state (%) - Multirace
Place of birth - Born in other state (%) - Other Race
Place of birth - Native, outside of US (%)
Place of birth - Native, outside of US (%) - White
Place of birth - Native, outside of US (%) - Black or African American
Place of birth - Native, outside of US (%) - Asian
Place of birth - Native, outside of US (%) - Hispanic or Latino
Place of birth - Native, outside of US (%) - American Indian and Alaska Native
Place of birth - Native, outside of US (%) - Multirace
Place of birth - Native, outside of US (%) - Other Race
Place of birth - Foreign born (%)
Place of birth - Foreign born (%) - White
Place of birth - Foreign born (%) - Black or African American
Place of birth - Foreign born (%) - Asian
Place of birth - Foreign born (%) - Hispanic or Latino
Place of birth - Foreign born (%) - American Indian and Alaska Native
Place of birth - Foreign born (%) - Multirace
Place of birth - Foreign born (%) - Other Race
Residents speaking English at home (%)
Residents speaking English at home - Born in the United States (%)
Residents speaking English at home - Native, born elsewhere (%)
Residents speaking English at home - Foreign born (%)
Residents speaking Spanish at home (%)
Residents speaking Spanish at home - Born in the United States (%)
Residents speaking Spanish at home - Native, born elsewhere (%)
Residents speaking Spanish at home - Foreign born (%)
Residents speaking other language at home (%)
Residents speaking other language at home - Born in the United States (%)
Residents speaking other language at home - Native, born elsewhere (%)
Residents speaking other language at home - Foreign born (%)
Marital status - Never married (%)
Marital status - Now married (%)
Marital status - Separated (%)
Marital status - Widowed (%)
Marital status - Divorced (%)
Ancestries Reported - Arab (%)
Ancestries Reported - Czech (%)
Ancestries Reported - Danish (%)
Ancestries Reported - Dutch (%)
Ancestries Reported - English (%)
Ancestries Reported - French (%)
Ancestries Reported - French Canadian (%)
Ancestries Reported - German (%)
Ancestries Reported - Greek (%)
Ancestries Reported - Hungarian (%)
Ancestries Reported - Irish (%)
Ancestries Reported - Italian (%)
Ancestries Reported - Lithuanian (%)
Ancestries Reported - Norwegian (%)
Ancestries Reported - Polish (%)
Ancestries Reported - Portuguese (%)
Ancestries Reported - Russian (%)
Ancestries Reported - Scotch-Irish (%)
Ancestries Reported - Scottish (%)
Ancestries Reported - Slovak (%)
Ancestries Reported - Subsaharan African (%)
Ancestries Reported - Swedish (%)
Ancestries Reported - Swiss (%)
Ancestries Reported - Ukrainian (%)
Ancestries Reported - United States (%)
Ancestries Reported - Welsh (%)
Ancestries Reported - West Indian (%)
Ancestries Reported - Other (%)
Geographical mobility - Same house 1 year ago (%)
Geographical mobility - Same house 1 year ago (%) - White
Geographical mobility - Same house 1 year ago (%) - Black or African American
Geographical mobility - Same house 1 year ago (%) - Asian
Geographical mobility - Same house 1 year ago (%) - Hispanic or Latino
Geographical mobility - Same house 1 year ago (%) - American Indian and Alaska Native
Geographical mobility - Same house 1 year ago (%) - Multirace
Geographical mobility - Same house 1 year ago (%) - Other Race
Geographical mobility - Moved within same county (%)
Geographical mobility - Moved within same county (%) - White
Geographical mobility - Moved within same county (%) - Black or African American
Geographical mobility - Moved within same county (%) - Asian
Geographical mobility - Moved within same county (%) - Hispanic or Latino
Geographical mobility - Moved within same county (%) - American Indian and Alaska Native
Geographical mobility - Moved within same county (%) - Multirace
Geographical mobility - Moved within same county (%) - Other Race
Geographical mobility - Moved from different county within same state (%)
Geographical mobility - Moved from different county within same state (%) - White
Geographical mobility - Moved from different county within same state (%) - Black or African American
Geographical mobility - Moved from different county within same state (%) - Asian
Geographical mobility - Moved from different county within same state (%) - Hispanic or Latino
Geographical mobility - Moved from different county within same state (%) - American Indian and Alaska Native
Geographical mobility - Moved from different county within same state (%) - Multirace
Geographical mobility - Moved from different county within same state (%) - Other Race
Geographical mobility - Moved from different state (%)
Geographical mobility - Moved from different state (%) - White
Geographical mobility - Moved from different state (%) - Black or African American
Geographical mobility - Moved from different state (%) - Asian
Geographical mobility - Moved from different state (%) - Hispanic or Latino
Geographical mobility - Moved from different state (%) - American Indian and Alaska Native
Geographical mobility - Moved from different state (%) - Multirace
Geographical mobility - Moved from different state (%) - Other Race
Geographical mobility - Moved from abroad (%)
Geographical mobility - Moved from abroad (%) - White
Geographical mobility - Moved from abroad (%) - Black or African American
Geographical mobility - Moved from abroad (%) - Asian
Geographical mobility - Moved from abroad (%) - Hispanic or Latino
Geographical mobility - Moved from abroad (%) - American Indian and Alaska Native
Geographical mobility - Moved from abroad (%) - Multirace
Geographical mobility - Moved from abroad (%) - Other Race
Place of birth for the foreign-born population - Ireland (%)
Place of birth for the foreign-born population - Denmark (%)
Place of birth for the foreign-born population - Norway (%)
Place of birth for the foreign-born population - Sweden (%)
Place of birth for the foreign-born population - United Kingdom (%)
Place of birth for the foreign-born population - England (%)
Place of birth for the foreign-born population - Scotland (%)
Place of birth for the foreign-born population - Other Northern Europe (%)
Place of birth for the foreign-born population - Austria (%)
Place of birth for the foreign-born population - Belgium (%)
Place of birth for the foreign-born population - France (%)
Place of birth for the foreign-born population - Germany (%)
Place of birth for the foreign-born population - Netherlands (%)
Place of birth for the foreign-born population - Switzerland (%)
Place of birth for the foreign-born population - Other Western Europe (%)
Place of birth for the foreign-born population - Greece (%)
Place of birth for the foreign-born population - Italy (%)
Place of birth for the foreign-born population - Portugal (%)
Place of birth for the foreign-born population - Spain (%)
Place of birth for the foreign-born population - Other Southern Europe (%)
Place of birth for the foreign-born population - Albania (%)
Place of birth for the foreign-born population - Belarus (%)
Place of birth for the foreign-born population - Bosnia and Herzegovina (%)
Place of birth for the foreign-born population - Bulgaria (%)
Place of birth for the foreign-born population - Croatia (%)
Place of birth for the foreign-born population - Czechoslovakia (%)
Place of birth for the foreign-born population - Hungary (%)
Place of birth for the foreign-born population - Latvia (%)
Place of birth for the foreign-born population - Lithuania (%)
Place of birth for the foreign-born population - North Macedonia (Macedonia) (%)
Place of birth for the foreign-born population - Moldova (%)
Place of birth for the foreign-born population - Poland (%)
Place of birth for the foreign-born population - Romania (%)
Place of birth for the foreign-born population - Russia (%)
Place of birth for the foreign-born population - Serbia (%)
Place of birth for the foreign-born population - Ukraine (%)
Place of birth for the foreign-born population - Other Eastern Europe (%)
Place of birth for the foreign-born population - China (%)
Place of birth for the foreign-born population - Hong Kong (%)
Place of birth for the foreign-born population - Taiwan (%)
Place of birth for the foreign-born population - Japan (%)
Place of birth for the foreign-born population - Korea (%)
Place of birth for the foreign-born population - Other Eastern Asia (%)
Place of birth for the foreign-born population - Afghanistan (%)
Place of birth for the foreign-born population - Bangladesh (%)
Place of birth for the foreign-born population - India (%)
Place of birth for the foreign-born population - Iran (%)
Place of birth for the foreign-born population - Kazakhstan (%)
Place of birth for the foreign-born population - Nepal (%)
Place of birth for the foreign-born population - Pakistan (%)
Place of birth for the foreign-born population - Sri Lanka (%)
Place of birth for the foreign-born population - Uzbekistan (%)
Place of birth for the foreign-born population - Other South Central Asia (%)
Place of birth for the foreign-born population - Burma (%)
Place of birth for the foreign-born population - Cambodia (%)
Place of birth for the foreign-born population - Indonesia (%)
Place of birth for the foreign-born population - Laos (%)
Place of birth for the foreign-born population - Malaysia (%)
Place of birth for the foreign-born population - Philippines (%)
Place of birth for the foreign-born population - Singapore (%)
Place of birth for the foreign-born population - Thailand (%)
Place of birth for the foreign-born population - Vietnam (%)
Place of birth for the foreign-born population - Other South Eastern Asia (%)
Place of birth for the foreign-born population - Armenia (%)
Place of birth for the foreign-born population - Iraq (%)
Place of birth for the foreign-born population - Israel (%)
Place of birth for the foreign-born population - Jordan (%)
Place of birth for the foreign-born population - Kuwait (%)
Place of birth for the foreign-born population - Lebanon (%)
Place of birth for the foreign-born population - Saudi Arabia (%)
Place of birth for the foreign-born population - Syria (%)
Place of birth for the foreign-born population - Turkey (%)
Place of birth for the foreign-born population - Yemen (%)
Place of birth for the foreign-born population - Other Western Asia (%)
Place of birth for the foreign-born population - Eritrea (%)
Place of birth for the foreign-born population - Ethiopia (%)
Place of birth for the foreign-born population - Kenya (%)
Place of birth for the foreign-born population - Somalia (%)
Place of birth for the foreign-born population - Uganda (%)
Place of birth for the foreign-born population - Zimbabwe (%)
Place of birth for the foreign-born population - Other Eastern Africa (%)
Place of birth for the foreign-born population - Cameroon (%)
Place of birth for the foreign-born population - Congo (%)
Place of birth for the foreign-born population - Democratic Republic of Congo (Zaire) (%)
Place of birth for the foreign-born population - Other Middle Africa (%)
Place of birth for the foreign-born population - Egypt (%)
Place of birth for the foreign-born population - Morocco (%)
Place of birth for the foreign-born population - Sudan (%)
Place of birth for the foreign-born population - Other Northern Africa (%)
Place of birth for the foreign-born population - South Africa (%)
Place of birth for the foreign-born population - Other Southern Africa (%)
Place of birth for the foreign-born population - Cabo Verde (%)
Place of birth for the foreign-born population - Ghana (%)
Place of birth for the foreign-born population - Liberia (%)
Place of birth for the foreign-born population - Nigeria (%)
Place of birth for the foreign-born population - Senegal (%)
Place of birth for the foreign-born population - Sierra Leone (%)
Place of birth for the foreign-born population - Other Western Africa (%)
Place of birth for the foreign-born population - Australia (%)
Place of birth for the foreign-born population - New Zealand (%)
Place of birth for the foreign-born population - Fiji (%)
Place of birth for the foreign-born population - Micronesia (%)
Place of birth for the foreign-born population - Bahamas (%)
Place of birth for the foreign-born population - Barbados (%)
Place of birth for the foreign-born population - Cuba (%)
Place of birth for the foreign-born population - Dominica (%)
Place of birth for the foreign-born population - Dominican Republic (%)
Place of birth for the foreign-born population - Grenada (%)
Place of birth for the foreign-born population - Haiti (%)
Place of birth for the foreign-born population - Jamaica (%)
Place of birth for the foreign-born population - St. Vincent and the Grenadines (%)
Place of birth for the foreign-born population - Trinidad and Tobago (%)
Place of birth for the foreign-born population - West Indies (%)
Place of birth for the foreign-born population - Other Caribbean (%)
Place of birth for the foreign-born population - Belize (%)
Place of birth for the foreign-born population - Costa Rica (%)
Place of birth for the foreign-born population - El Salvador (%)
Place of birth for the foreign-born population - Guatemala (%)
Place of birth for the foreign-born population - Honduras (%)
Place of birth for the foreign-born population - Mexico (%)
Place of birth for the foreign-born population - Nicaragua (%)
Place of birth for the foreign-born population - Panama (%)
Place of birth for the foreign-born population - Other Central America (%)
Place of birth for the foreign-born population - Argentina (%)
Place of birth for the foreign-born population - Bolivia (%)
Place of birth for the foreign-born population - Brazil (%)
Place of birth for the foreign-born population - Chile (%)
Place of birth for the foreign-born population - Colombia (%)
Place of birth for the foreign-born population - Ecuador (%)
Place of birth for the foreign-born population - Guyana (%)
Place of birth for the foreign-born population - Peru (%)
Place of birth for the foreign-born population - Uruguay (%)
Place of birth for the foreign-born population - Venezuela (%)
Place of birth for the foreign-born population - Other South America (%)
Place of birth for the foreign-born population - Canada (%)
Place of birth for the foreign-born population - Other Northern America (%)
Place of birth for the foreign-born population - Other (%)
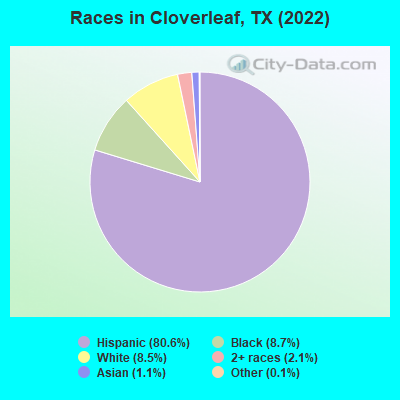
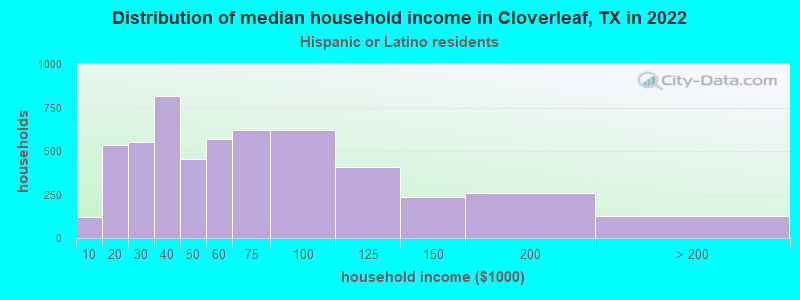
According to 2022 data, the most numerous races in Cloverleaf, TX are Hispanic (20,162 residents), White alone (2,115 residents), and Black alone (2,180 residents). 27.8% of Cloverleaf residents speak English at home. 32.9% of Cloverleaf, TX residents are foreign-born (31.4% born in Latin America), which is 48.3% greater than the foreign-born rate of 17.0% across the entire state of Texas.
Race distribution in Cloverleaf
2000 2022
10,933,313 52.4% White alone 6,669,666 32.0% Hispanic 2,364,255 11.3% Black alone 554,445 2.7% Asian alone 230,567 1.1% Two or more races 68,859 0.3% American Indian alone 19,958 0.10% Other race alone 10,757 0.05% Native Hawaiian and Other
12,070,642 40.2% Hispanic 11,683,430 38.9% White alone 3,508,706 11.7% Black alone 1,608,173 5.4% Asian alone 956,560 3.2% Two or more races 125,763 0.4% Other race alone 47,023 0.2% American Indian alone 29,275 0.10% Native Hawaiian and Other
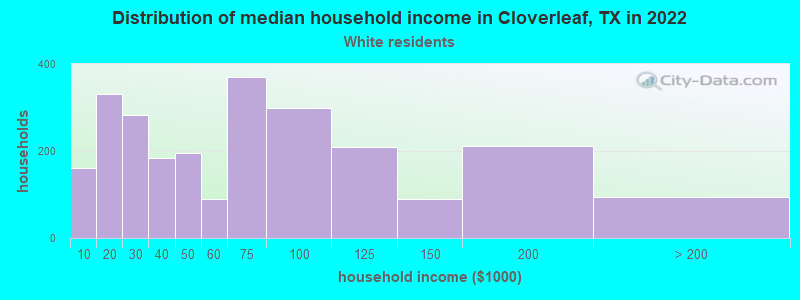
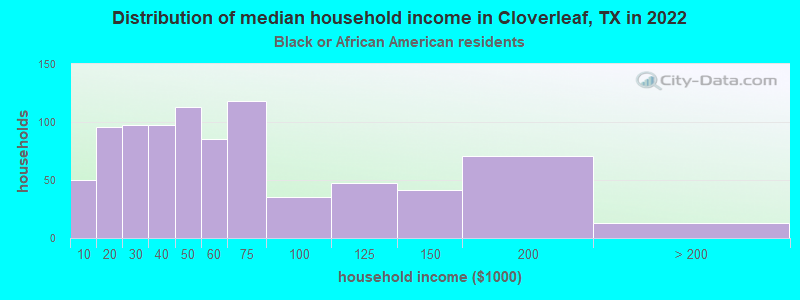
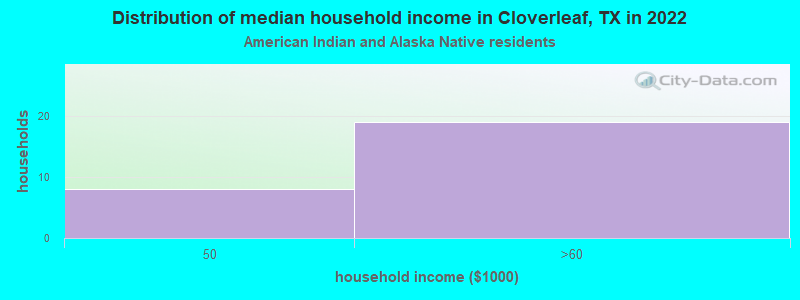
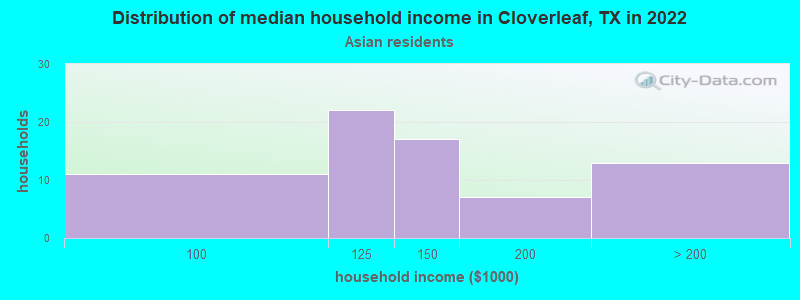
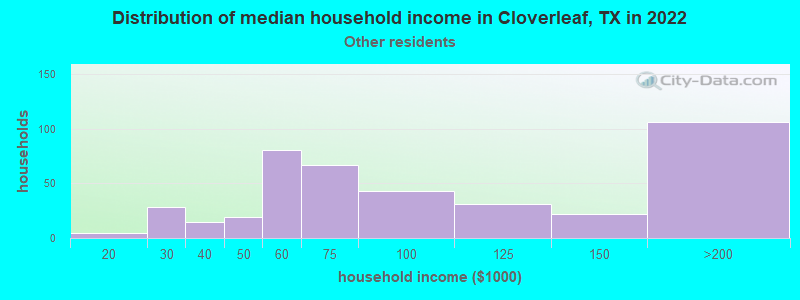
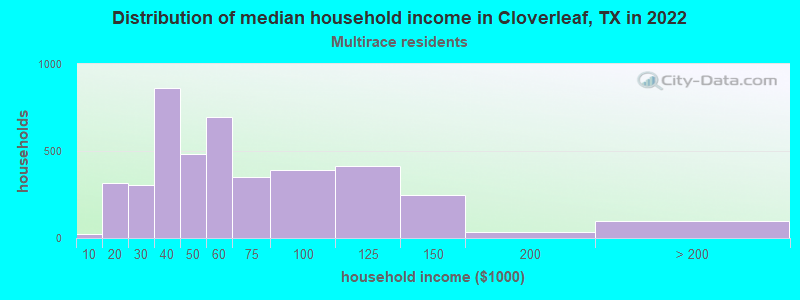
Income and house value in Cloverleaf Median household income in 2022 $48,802 White non-Hispanic householders$45,844 Black householders$153,890 Asian householders$72,124 Some other race householders$50,092 Two or more races householders$52,760 Hispanic or Latino race householdersMedian 2022 house value $182,422 White Non-Hispanic householders$209,928 Black or African American householders$130,710 American Indian or Alaska Native householders $224,672 Asian householders$115,746 Some other race householders$127,629 Two or more races householders$163,278 Hispanic or Latino householders
Median age by race in Cloverleaf
33.3 Median age for White residents33.4 32.5 39.4 Median age for Black or African American residents43.2 37.6 43.0 Median age for American Indian / Alaska Native residents-598,187,310.6 45.5 47.6 Median age for Asian residents31.7 54.8 -782,795,698.1 Median age for Native Hawaiian / Pacific Islander residents-633,771,929.2 -816,367,264.7 31.9 Median age for Other race residents32.0 31.7 27.6 Median age for Two or more races residents27.4 27.6 59.1 Median age for White alone residents57.7 61.0 26.4 Median age for Hispanic or Latino residents27.0 25.8
Owner/renter occupied households by race in Cloverleaf
House owners and renters - White residents 1,664 65.3% Owner occupied886 34.7% Renter occupiedHouse owners and renters - Black or African American residents 605 69.3% Owner occupied268 30.7% Renter occupiedHouse owners and renters - American Indian / Alaska Native residents 8 36.0% Owner occupied15 64.0% Renter occupiedHouse owners and renters - Asian residents 68 100.0% Owner occupiedHouse owners and renters - Other race residents 327 80.5% Owner occupied79 19.5% Renter occupiedHouse owners and renters - Two or more races residents 2,376 55.9% Owner occupied1,873 44.1% Renter occupiedHouse owners and renters - White alone residents 847 81.3% Owner occupied195 18.7% Renter occupiedHouse owners and renters - Hispanic or Latino residents 2,998 56.2% Owner occupied2,338 43.8% Renter occupied
Language usage in Cloverleaf
English speakers - Total 27.8% of residents of Cloverleaf speak English at home.
71.9% of residents speak Spanish at home 9,489 56.9% Speak English very well7,174 43.1% Speak English less than very well0.9% of residents speak other language at home 147 69.0% Speak English very well66 31.0% Speak English less than very well
English speakers - Born in the United States 46.9% of residents of Cloverleaf speak English at home.
50.7% of residents speak Spanish at home 938 91.2% Speak English very well90 8.8% Speak English less than very well
English speakers - Native, born elsewhere 19.9% of residents of Cloverleaf speak English at home.
76.1% of residents speak Spanish at home 77 57.5% Speak English very well57 42.5% Speak English less than very well
English speakers - Foreign-born 2.5% of residents of Cloverleaf speak English at home.
97.5% of residents speak Spanish at home 1,699 21.4% Speak English very well6,242 78.6% Speak English less than very well2.3% of residents speak other language at home 137 73.7% Speak English very well49 26.3% Speak English less than very well
White (Caucasian) - Speak only English Native:
49.1% (2,727)Foreign-born:
6.0% (88)
White (Caucasian) - Speak another language Native:
34.1% (1,895)Foreign-born:
85.1% (1,247)
American Indian / Alaska Native - Speak another language Native:
74.0% (31)Foreign-born:
98.9% (14)
Asian - Speak only English Native:
59.0% (16)Foreign-born:
16.1% (36)
Asian - Speak another language Native:
41.3% (11)Foreign-born:
84.0% (189)
Other race - Speak only English Native:
27.8% (223)Foreign-born:
1.9% (15)
Other race - Speak another language Native:
72.4% (581)Foreign-born:
98.4% (753)
Two or more races - Speak only English Native:
18.8% (1,547)Foreign-born:
1.1% (68)
Two or more races - Speak another language Native:
85.0% (7,011)Foreign-born:
99.0% (6,030)
White alone - Speak only English Native:
92.6% (1,894)Foreign-born:
100.0% (28)
Hispanic or Latino - Speak only English Native:
18.1% (1,894)Foreign-born:
1.9% (153)
Hispanic or Latino - Speak another language Native:
82.4% (8,617)Foreign-born:
98.0% (7,968)
Foreign-born residents in Cloverleaf 8,232 residents are foreign born (31.4% Latin America ).
This city:
32.9%Texas:
17.1%
Marital status for residents in Cloverleaf Marital status - White (Caucasian) population 15 years and over
Males 41.1% Never married44.7% Now married3.4% Separated5.2% Widowed5.7% DivorcedFemales 37.0% Never married41.7% Now married2.7% Separated8.3% Widowed10.3% DivorcedWomen who gave birth in the past 12 months Now married:
19.7% (26)Unmarried:
80.3% (107)
Women who did not give birth in the past 12 months Now married:
42.7% (692)Unmarried:
57.3% (930)
Marital status - Black or African American population 15 years and over
Males 45.5% Never married32.0% Now married3.9% Separated1.2% Widowed17.3% DivorcedFemales 44.5% Never married26.2% Now married5.4% Separated12.3% Widowed11.6% DivorcedWomen who gave birth in the past 12 months Now married:
39.8% (43)Unmarried:
60.2% (65)
Women who did not give birth in the past 12 months Now married:
14.7% (60)Unmarried:
85.3% (351)
Marital status - American Indian / Alaska Native population 15 years and over
Males 55.6% Never married44.4% Now married0.0% Separated0.0% Widowed0.0% DivorcedFemales 0.0% Never married100.0% Now married0.0% Separated0.0% Widowed0.0% DivorcedWomen who did not give birth in the past 12 months Now married:
100.0% (7)Unmarried:
0.0% (0)
Marital status - Asian population 15 years and over
Males 44.5% Never married45.3% Now married0.0% Separated0.0% Widowed10.2% DivorcedFemales 19.8% Never married80.2% Now married0.0% Separated0.0% Widowed0.0% DivorcedWomen who did not give birth in the past 12 months Now married:
100.0% (45)Unmarried:
0.0% (0)
Marital status - Other race population 15 years and over
Males 39.2% Never married49.0% Now married3.8% Separated1.3% Widowed6.7% DivorcedFemales 31.9% Never married55.7% Now married1.2% Separated8.1% Widowed3.1% DivorcedWomen who gave birth in the past 12 months Now married:
55.6% (14)Unmarried:
44.4% (12)
Women who did not give birth in the past 12 months Now married:
47.8% (172)Unmarried:
52.2% (188)
Marital status - Two or more races population 15 years and over
Males 49.6% Never married42.5% Now married2.8% Separated0.7% Widowed4.4% DivorcedFemales 37.8% Never married45.0% Now married6.5% Separated6.2% Widowed4.5% DivorcedWomen who gave birth in the past 12 months Now married:
45.6% (123)Unmarried:
54.4% (146)
Women who did not give birth in the past 12 months Now married:
46.4% (1,499)Unmarried:
53.6% (1,733)
Marital status - White alone, not Hispanic / Latino population 15 years and over
Males 23.9% Never married47.7% Now married2.9% Separated14.2% Widowed11.4% DivorcedFemales 17.3% Never married44.7% Now married3.0% Separated19.6% Widowed15.4% DivorcedWomen who gave birth in the past 12 months Now married:
100.0% (12)Unmarried:
0.0% (0)
Women who did not give birth in the past 12 months Now married:
53.0% (177)Unmarried:
47.0% (157)
Marital status - Hispanic or Latino population 15 years and over
Males 47.2% Never married44.2% Now married3.2% Separated1.4% Widowed3.9% DivorcedFemales 39.9% Never married44.4% Now married4.6% Separated5.6% Widowed5.5% DivorcedWomen who gave birth in the past 12 months Now married:
31.4% (121)Unmarried:
68.6% (265)
Women who did not give birth in the past 12 months Now married:
44.9% (1,967)Unmarried:
55.1% (2,416)
Ancestries in Cloverleaf
241 1.2% American230 1.1% Irish224 1.1% English115 0.6% Scotch-Irish103 0.5% Italian101 0.5% German56 0.3% African34 0.2% Eastern European28 0.1% Polish22 0.1% Czech22 0.1% Scottish17 0.08% Swedish11 0.05% French9 0.04% Palestinian8 0.04% French Canadian7 0.03% European
Geographical mobility in Cloverleaf Same house 1 year ago 7,193 92.6% White (Caucasian)2,084 95.7% Black or African American58 88.7% American Indian / Alaska Native267 99.0% Asian1,374 80.8% Other race13,488 90.3% Two or more races1,914 90.9% White alone, not Hispanic / Latino17,958 91.0% Hispanic or LatinoMoved within same county 361 4.7% White / Caucasian77 3.5% Black or African American274 16.1% Other race1,195 8.0% Two or more races146 6.9% White alone, not Hispanic / Latino1,269 6.4% Hispanic or LatinoMoved within same state 13 0.2% White / Caucasian22 1.0% Black or African American44 2.6% Other race24 0.2% Two or more races14 0.7% White alone, not Hispanic / Latino52 0.3% Hispanic or LatinoMoved from different state 6 9.7% American Indian / Alaska Native22 0.2% Two or more races29 0.1% Hispanic or LatinoMoved from abroad 120 1.5% White267 1.8% Two or more races21 1.0% White alone, not Hispanic / Latino441 2.2% Hispanic or Latino
Children Nativity (place of birth) in Cloverleaf
Children under 6 years - Living with two parents Both parents native 283 100.0% NativeBoth parents foreign-born 264 86.8% Native40 13.2% Foreign-bornOne native, one foreign-born parent 285 100.0% NativeChildren under 6 years - Living with one parent Native parent 801 99.7% Native2 0.3% Foreign-bornForeign-born parent 616 89.9% Native69 10.1% Foreign-bornChildren 6 to 17 years - Living with two parents Both parents native 632 100.0% NativeBoth parents foreign-born 1,783 92.0% Native155 8.0% Foreign-bornOne native, one foreign-born parent 694 86.8% Native106 13.2% Foreign-bornChildren 6 to 17 years - Living with one parent Native parent 450 100.0% NativeForeign-born parent 1,874 55.0% Native1,532 45.0% Foreign-born
Grandparents responsible for own grandchildren in Cloverleaf
Grandparents (30 to 59 years) White / Caucasian 99 45.9% Responsible for grandchildren117 54.1% Not responsible for grandchildrenBlack or African American 8 100.0% Not responsible for grandchildrenOther race 38 100.0% Not responsible for grandchildrenTwo or more races 25 14.8% Responsible for grandchildren144 85.2% Not responsible for grandchildrenHispanic or Latino 179 32.4% Responsible for grandchildren373 67.6% Not responsible for grandchildrenGrandparents (60 years and over) White / Caucasian 22 22.7% Responsible for grandchildren75 77.3% Not responsible for grandchildrenBlack or African American 17 58.0% Responsible for grandchildren12 42.0% Not responsible for grandchildrenOther race 13 15.9% Responsible for grandchildren69 84.1% Not responsible for grandchildrenTwo or more races 189 100.0% Not responsible for grandchildrenHispanic or Latino 23 9.5% Responsible for grandchildren214 90.5% Not responsible for grandchildren