Races in Colony, Texas (TX) Detailed Stats
Ancestries, Foreign-born residents, place of birth
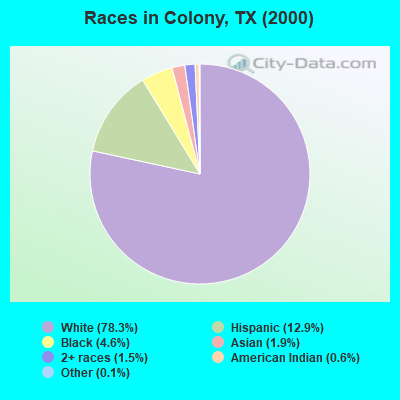
Race distribution in Colony

- 24,83678.3%White alone
- 4,10012.9%Hispanic
- 1,4524.6%Black alone
- 5921.9%Asian alone
- 4801.5%Two or more races
- 1970.6%American Indian alone
- 320.1%Other race alone
- 110.03%Native Hawaiian and Other
Pacific Islander alone
2000
2022
-
- 10,933,31352.4%White alone
- 6,669,66632.0%Hispanic
- 2,364,25511.3%Black alone
- 554,4452.7%Asian alone
- 230,5671.1%Two or more races
- 68,8590.3%American Indian alone
- 19,9580.10%Other race alone
- 10,7570.05%Native Hawaiian and Other
Pacific Islander alone

-
- 12,070,64240.2%Hispanic
- 11,683,43038.9%White alone
- 3,508,70611.7%Black alone
- 1,608,1735.4%Asian alone
- 956,5603.2%Two or more races
- 125,7630.4%Other race alone
- 47,0230.2%American Indian alone
- 29,2750.10%Native Hawaiian and Other
Pacific Islander alone

Income and house value in Colony
- Median household income in 2022
- $124,489White non-Hispanic householders
- $107,164Black householders
- $58,401American Indian and Alaska Native householders
- $170,575Asian householders
- $119,696Some other race householders
- $125,985Two or more races householders
- $105,025Hispanic or Latino race householders
- Median 2022 house value
- $347,105White Non-Hispanic householders
- $357,562Black or African American householders
- $296,844American Indian or Alaska Native householders
- $454,036Asian householders
- $758,976Native Hawaiian and other Pacific Islander householders
- $311,011Some other race householders
- $337,322Two or more races householders
- $313,710Hispanic or Latino householders
Household income for White non-Hispanic householders

Household income for Black householders

Household income for American Indian and Alaska Native householders

Household income for Asian householders

Household income for Native Hawaiian and other Pacific Islander householders

Household income for Two or more races householders

Household income for Hispanic or Latino race householders

Zip code: 75056