Races in Coppell, Texas (TX) Detailed Stats
Data:
Races - White alone (%)
Races - White alone (% change since 2000)
Races - Black alone (%)
Races - Black alone (% change since 2000)
Races - American Indian alone (%)
Races - American Indian alone (% change since 2000)
Races - Asian alone (%)
Races - Asian alone (% change since 2000)
Races - Hispanic (%)
Races - Hispanic (% change since 2000)
Races - Native Hawaiian and Other Pacific Islander alone (%)
Races - Native Hawaiian and Other Pacific Islander alone (% change since 2000)
Races - Two or more races(%)
Races - Two or more races(% change since 2000)
Races - Other race alone (%)
Races - Other race alone (% change since 2000)
Racial diversity
Place of birth - Born in state of residence (%)
Place of birth - Born in state of residence (%) - White
Place of birth - Born in state of residence (%) - Black or African American
Place of birth - Born in state of residence (%) - Asian
Place of birth - Born in state of residence (%) - Hispanic or Latino
Place of birth - Born in state of residence (%) - American Indian and Alaska Native
Place of birth - Born in state of residence (%) - Multirace
Place of birth - Born in state of residence (%) - Other Race
Place of birth - Born in other state (%)
Place of birth - Born in other state (%) - White
Place of birth - Born in other state (%) - Black or African American
Place of birth - Born in other state (%) - Asian
Place of birth - Born in other state (%) - Hispanic or Latino
Place of birth - Born in other state (%) - American Indian and Alaska Native
Place of birth - Born in other state (%) - Multirace
Place of birth - Born in other state (%) - Other Race
Place of birth - Native, outside of US (%)
Place of birth - Native, outside of US (%) - White
Place of birth - Native, outside of US (%) - Black or African American
Place of birth - Native, outside of US (%) - Asian
Place of birth - Native, outside of US (%) - Hispanic or Latino
Place of birth - Native, outside of US (%) - American Indian and Alaska Native
Place of birth - Native, outside of US (%) - Multirace
Place of birth - Native, outside of US (%) - Other Race
Place of birth - Foreign born (%)
Place of birth - Foreign born (%) - White
Place of birth - Foreign born (%) - Black or African American
Place of birth - Foreign born (%) - Asian
Place of birth - Foreign born (%) - Hispanic or Latino
Place of birth - Foreign born (%) - American Indian and Alaska Native
Place of birth - Foreign born (%) - Multirace
Place of birth - Foreign born (%) - Other Race
Residents speaking English at home (%)
Residents speaking English at home - Born in the United States (%)
Residents speaking English at home - Native, born elsewhere (%)
Residents speaking English at home - Foreign born (%)
Residents speaking Spanish at home (%)
Residents speaking Spanish at home - Born in the United States (%)
Residents speaking Spanish at home - Native, born elsewhere (%)
Residents speaking Spanish at home - Foreign born (%)
Residents speaking other language at home (%)
Residents speaking other language at home - Born in the United States (%)
Residents speaking other language at home - Native, born elsewhere (%)
Residents speaking other language at home - Foreign born (%)
Marital status - Never married (%)
Marital status - Now married (%)
Marital status - Separated (%)
Marital status - Widowed (%)
Marital status - Divorced (%)
Ancestries Reported - Arab (%)
Ancestries Reported - Czech (%)
Ancestries Reported - Danish (%)
Ancestries Reported - Dutch (%)
Ancestries Reported - English (%)
Ancestries Reported - French (%)
Ancestries Reported - French Canadian (%)
Ancestries Reported - German (%)
Ancestries Reported - Greek (%)
Ancestries Reported - Hungarian (%)
Ancestries Reported - Irish (%)
Ancestries Reported - Italian (%)
Ancestries Reported - Lithuanian (%)
Ancestries Reported - Norwegian (%)
Ancestries Reported - Polish (%)
Ancestries Reported - Portuguese (%)
Ancestries Reported - Russian (%)
Ancestries Reported - Scotch-Irish (%)
Ancestries Reported - Scottish (%)
Ancestries Reported - Slovak (%)
Ancestries Reported - Subsaharan African (%)
Ancestries Reported - Swedish (%)
Ancestries Reported - Swiss (%)
Ancestries Reported - Ukrainian (%)
Ancestries Reported - United States (%)
Ancestries Reported - Welsh (%)
Ancestries Reported - West Indian (%)
Ancestries Reported - Other (%)
Geographical mobility - Same house 1 year ago (%)
Geographical mobility - Same house 1 year ago (%) - White
Geographical mobility - Same house 1 year ago (%) - Black or African American
Geographical mobility - Same house 1 year ago (%) - Asian
Geographical mobility - Same house 1 year ago (%) - Hispanic or Latino
Geographical mobility - Same house 1 year ago (%) - American Indian and Alaska Native
Geographical mobility - Same house 1 year ago (%) - Multirace
Geographical mobility - Same house 1 year ago (%) - Other Race
Geographical mobility - Moved within same county (%)
Geographical mobility - Moved within same county (%) - White
Geographical mobility - Moved within same county (%) - Black or African American
Geographical mobility - Moved within same county (%) - Asian
Geographical mobility - Moved within same county (%) - Hispanic or Latino
Geographical mobility - Moved within same county (%) - American Indian and Alaska Native
Geographical mobility - Moved within same county (%) - Multirace
Geographical mobility - Moved within same county (%) - Other Race
Geographical mobility - Moved from different county within same state (%)
Geographical mobility - Moved from different county within same state (%) - White
Geographical mobility - Moved from different county within same state (%) - Black or African American
Geographical mobility - Moved from different county within same state (%) - Asian
Geographical mobility - Moved from different county within same state (%) - Hispanic or Latino
Geographical mobility - Moved from different county within same state (%) - American Indian and Alaska Native
Geographical mobility - Moved from different county within same state (%) - Multirace
Geographical mobility - Moved from different county within same state (%) - Other Race
Geographical mobility - Moved from different state (%)
Geographical mobility - Moved from different state (%) - White
Geographical mobility - Moved from different state (%) - Black or African American
Geographical mobility - Moved from different state (%) - Asian
Geographical mobility - Moved from different state (%) - Hispanic or Latino
Geographical mobility - Moved from different state (%) - American Indian and Alaska Native
Geographical mobility - Moved from different state (%) - Multirace
Geographical mobility - Moved from different state (%) - Other Race
Geographical mobility - Moved from abroad (%)
Geographical mobility - Moved from abroad (%) - White
Geographical mobility - Moved from abroad (%) - Black or African American
Geographical mobility - Moved from abroad (%) - Asian
Geographical mobility - Moved from abroad (%) - Hispanic or Latino
Geographical mobility - Moved from abroad (%) - American Indian and Alaska Native
Geographical mobility - Moved from abroad (%) - Multirace
Geographical mobility - Moved from abroad (%) - Other Race
Place of birth for the foreign-born population - Ireland (%)
Place of birth for the foreign-born population - Denmark (%)
Place of birth for the foreign-born population - Norway (%)
Place of birth for the foreign-born population - Sweden (%)
Place of birth for the foreign-born population - United Kingdom (%)
Place of birth for the foreign-born population - England (%)
Place of birth for the foreign-born population - Scotland (%)
Place of birth for the foreign-born population - Other Northern Europe (%)
Place of birth for the foreign-born population - Austria (%)
Place of birth for the foreign-born population - Belgium (%)
Place of birth for the foreign-born population - France (%)
Place of birth for the foreign-born population - Germany (%)
Place of birth for the foreign-born population - Netherlands (%)
Place of birth for the foreign-born population - Switzerland (%)
Place of birth for the foreign-born population - Other Western Europe (%)
Place of birth for the foreign-born population - Greece (%)
Place of birth for the foreign-born population - Italy (%)
Place of birth for the foreign-born population - Portugal (%)
Place of birth for the foreign-born population - Spain (%)
Place of birth for the foreign-born population - Other Southern Europe (%)
Place of birth for the foreign-born population - Albania (%)
Place of birth for the foreign-born population - Belarus (%)
Place of birth for the foreign-born population - Bosnia and Herzegovina (%)
Place of birth for the foreign-born population - Bulgaria (%)
Place of birth for the foreign-born population - Croatia (%)
Place of birth for the foreign-born population - Czechoslovakia (%)
Place of birth for the foreign-born population - Hungary (%)
Place of birth for the foreign-born population - Latvia (%)
Place of birth for the foreign-born population - Lithuania (%)
Place of birth for the foreign-born population - North Macedonia (Macedonia) (%)
Place of birth for the foreign-born population - Moldova (%)
Place of birth for the foreign-born population - Poland (%)
Place of birth for the foreign-born population - Romania (%)
Place of birth for the foreign-born population - Russia (%)
Place of birth for the foreign-born population - Serbia (%)
Place of birth for the foreign-born population - Ukraine (%)
Place of birth for the foreign-born population - Other Eastern Europe (%)
Place of birth for the foreign-born population - China (%)
Place of birth for the foreign-born population - Hong Kong (%)
Place of birth for the foreign-born population - Taiwan (%)
Place of birth for the foreign-born population - Japan (%)
Place of birth for the foreign-born population - Korea (%)
Place of birth for the foreign-born population - Other Eastern Asia (%)
Place of birth for the foreign-born population - Afghanistan (%)
Place of birth for the foreign-born population - Bangladesh (%)
Place of birth for the foreign-born population - India (%)
Place of birth for the foreign-born population - Iran (%)
Place of birth for the foreign-born population - Kazakhstan (%)
Place of birth for the foreign-born population - Nepal (%)
Place of birth for the foreign-born population - Pakistan (%)
Place of birth for the foreign-born population - Sri Lanka (%)
Place of birth for the foreign-born population - Uzbekistan (%)
Place of birth for the foreign-born population - Other South Central Asia (%)
Place of birth for the foreign-born population - Burma (%)
Place of birth for the foreign-born population - Cambodia (%)
Place of birth for the foreign-born population - Indonesia (%)
Place of birth for the foreign-born population - Laos (%)
Place of birth for the foreign-born population - Malaysia (%)
Place of birth for the foreign-born population - Philippines (%)
Place of birth for the foreign-born population - Singapore (%)
Place of birth for the foreign-born population - Thailand (%)
Place of birth for the foreign-born population - Vietnam (%)
Place of birth for the foreign-born population - Other South Eastern Asia (%)
Place of birth for the foreign-born population - Armenia (%)
Place of birth for the foreign-born population - Iraq (%)
Place of birth for the foreign-born population - Israel (%)
Place of birth for the foreign-born population - Jordan (%)
Place of birth for the foreign-born population - Kuwait (%)
Place of birth for the foreign-born population - Lebanon (%)
Place of birth for the foreign-born population - Saudi Arabia (%)
Place of birth for the foreign-born population - Syria (%)
Place of birth for the foreign-born population - Turkey (%)
Place of birth for the foreign-born population - Yemen (%)
Place of birth for the foreign-born population - Other Western Asia (%)
Place of birth for the foreign-born population - Eritrea (%)
Place of birth for the foreign-born population - Ethiopia (%)
Place of birth for the foreign-born population - Kenya (%)
Place of birth for the foreign-born population - Somalia (%)
Place of birth for the foreign-born population - Uganda (%)
Place of birth for the foreign-born population - Zimbabwe (%)
Place of birth for the foreign-born population - Other Eastern Africa (%)
Place of birth for the foreign-born population - Cameroon (%)
Place of birth for the foreign-born population - Congo (%)
Place of birth for the foreign-born population - Democratic Republic of Congo (Zaire) (%)
Place of birth for the foreign-born population - Other Middle Africa (%)
Place of birth for the foreign-born population - Egypt (%)
Place of birth for the foreign-born population - Morocco (%)
Place of birth for the foreign-born population - Sudan (%)
Place of birth for the foreign-born population - Other Northern Africa (%)
Place of birth for the foreign-born population - South Africa (%)
Place of birth for the foreign-born population - Other Southern Africa (%)
Place of birth for the foreign-born population - Cabo Verde (%)
Place of birth for the foreign-born population - Ghana (%)
Place of birth for the foreign-born population - Liberia (%)
Place of birth for the foreign-born population - Nigeria (%)
Place of birth for the foreign-born population - Senegal (%)
Place of birth for the foreign-born population - Sierra Leone (%)
Place of birth for the foreign-born population - Other Western Africa (%)
Place of birth for the foreign-born population - Australia (%)
Place of birth for the foreign-born population - New Zealand (%)
Place of birth for the foreign-born population - Fiji (%)
Place of birth for the foreign-born population - Micronesia (%)
Place of birth for the foreign-born population - Bahamas (%)
Place of birth for the foreign-born population - Barbados (%)
Place of birth for the foreign-born population - Cuba (%)
Place of birth for the foreign-born population - Dominica (%)
Place of birth for the foreign-born population - Dominican Republic (%)
Place of birth for the foreign-born population - Grenada (%)
Place of birth for the foreign-born population - Haiti (%)
Place of birth for the foreign-born population - Jamaica (%)
Place of birth for the foreign-born population - St. Vincent and the Grenadines (%)
Place of birth for the foreign-born population - Trinidad and Tobago (%)
Place of birth for the foreign-born population - West Indies (%)
Place of birth for the foreign-born population - Other Caribbean (%)
Place of birth for the foreign-born population - Belize (%)
Place of birth for the foreign-born population - Costa Rica (%)
Place of birth for the foreign-born population - El Salvador (%)
Place of birth for the foreign-born population - Guatemala (%)
Place of birth for the foreign-born population - Honduras (%)
Place of birth for the foreign-born population - Mexico (%)
Place of birth for the foreign-born population - Nicaragua (%)
Place of birth for the foreign-born population - Panama (%)
Place of birth for the foreign-born population - Other Central America (%)
Place of birth for the foreign-born population - Argentina (%)
Place of birth for the foreign-born population - Bolivia (%)
Place of birth for the foreign-born population - Brazil (%)
Place of birth for the foreign-born population - Chile (%)
Place of birth for the foreign-born population - Colombia (%)
Place of birth for the foreign-born population - Ecuador (%)
Place of birth for the foreign-born population - Guyana (%)
Place of birth for the foreign-born population - Peru (%)
Place of birth for the foreign-born population - Uruguay (%)
Place of birth for the foreign-born population - Venezuela (%)
Place of birth for the foreign-born population - Other South America (%)
Place of birth for the foreign-born population - Canada (%)
Place of birth for the foreign-born population - Other Northern America (%)
Place of birth for the foreign-born population - Other (%)
Latest news about races in Coppell, TX collected exclusively by city-data.com from local newspapers, TV, and radio stations
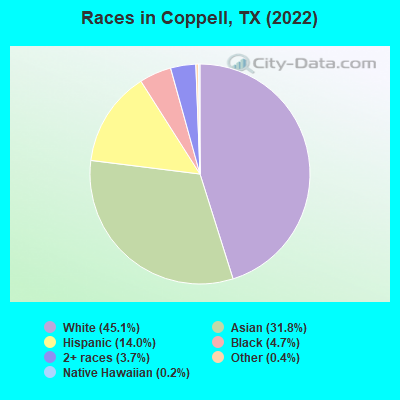
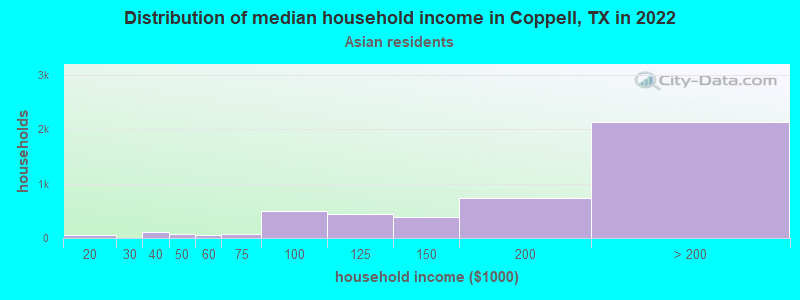
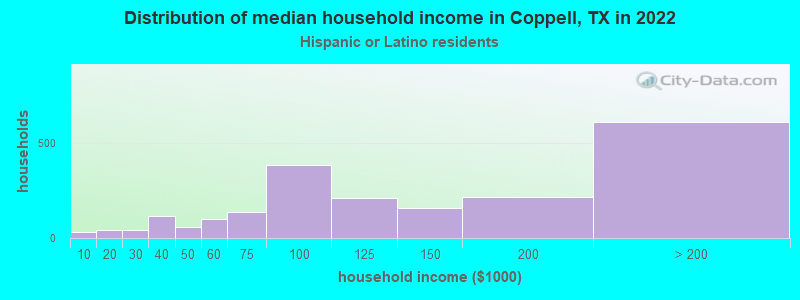
According to 2022 data, the most numerous races in Coppell, TX are Hispanic (5,926 residents), White alone (19,137 residents), and Black alone (2,005 residents). 61.3% of Coppell residents speak English at home. 30.3% of Coppell, TX residents are foreign-born (20.7% born in Asia, 4.0% born in Latin America), which is 43.9% greater than the foreign-born rate of 17.0% across the entire state of Texas.
Race distribution in Coppell
2000 2022
10,933,313 52.4% White alone 6,669,666 32.0% Hispanic 2,364,255 11.3% Black alone 554,445 2.7% Asian alone 230,567 1.1% Two or more races 68,859 0.3% American Indian alone 19,958 0.10% Other race alone 10,757 0.05% Native Hawaiian and Other
12,070,642 40.2% Hispanic 11,683,430 38.9% White alone 3,508,706 11.7% Black alone 1,608,173 5.4% Asian alone 956,560 3.2% Two or more races 125,763 0.4% Other race alone 47,023 0.2% American Indian alone 29,275 0.10% Native Hawaiian and Other
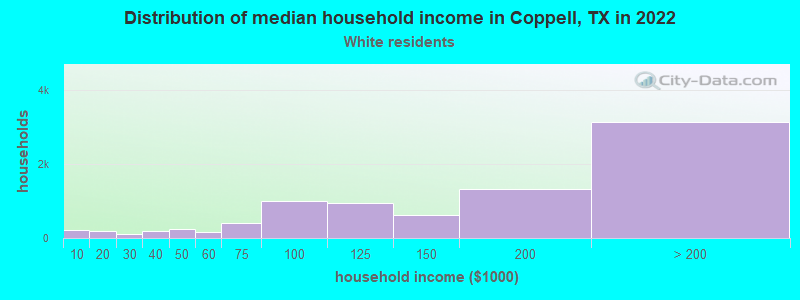
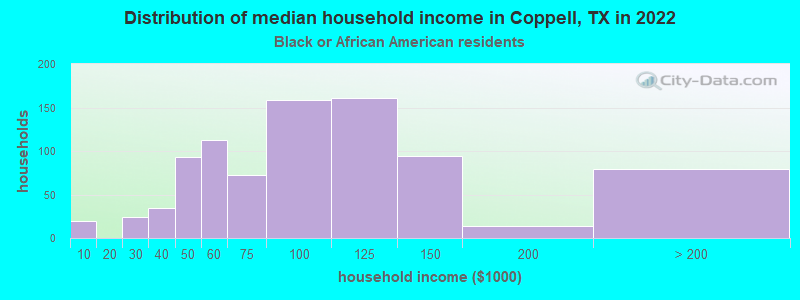
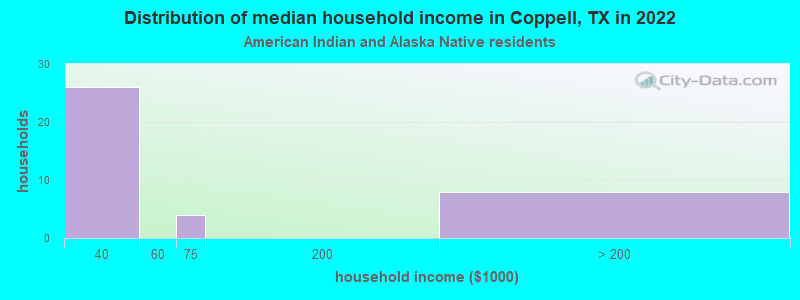
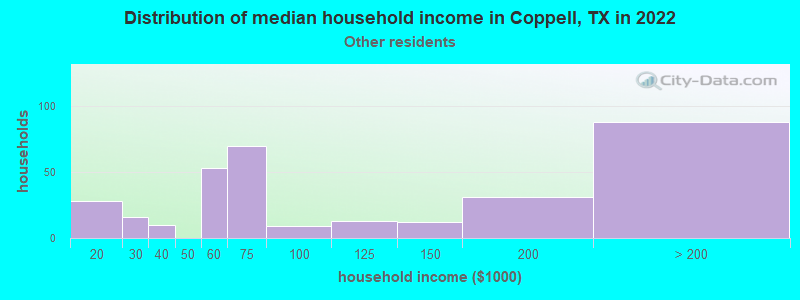
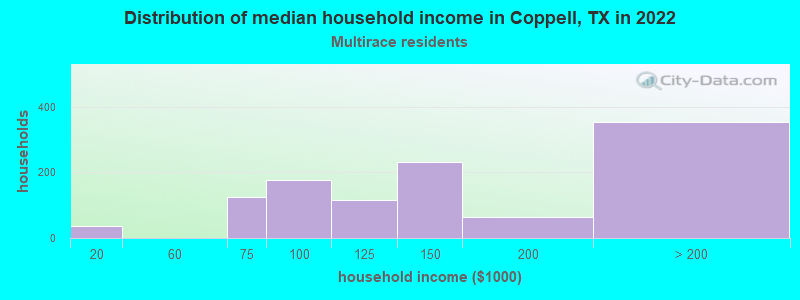
Income and house value in Coppell Median household income in 2022 $146,816 White non-Hispanic householders$86,471 Black householders$32,556 American Indian and Alaska Native householders$199,961 Asian householders$71,342 Some other race householders$135,429 Two or more races householders$119,735 Hispanic or Latino race householdersMedian 2022 house value $597,085 White Non-Hispanic householders$631,316 Black or African American householders$604,380 American Indian or Alaska Native householders $594,840 Asian householders$238,497 Native Hawaiian and other Pacific Islander householders$498,319 Some other race householders$384,120 Two or more races householders$499,160 Hispanic or Latino householders
Median age by race in Coppell
46.4 Median age for White residents46.6 46.3 33.5 Median age for Black or African American residents32.2 39.4 24.1 Median age for American Indian / Alaska Native residents22.1 19.3 39.3 Median age for Asian residents38.7 39.8 -711,469,533.3 Median age for Native Hawaiian / Pacific Islander residents-815,813,116.9 -464,594,127.3 34.6 Median age for Other race residents29.1 43.2 23.8 Median age for Two or more races residents23.8 22.9 44.9 Median age for White alone residents45.1 44.6 35.0 Median age for Hispanic or Latino residents36.4 34.1
Owner/renter occupied households by race in Coppell
House owners and renters - White residents 6,010 74.2% Owner occupied2,089 25.8% Renter occupiedHouse owners and renters - Black or African American residents 172 18.5% Owner occupied759 81.5% Renter occupiedHouse owners and renters - American Indian / Alaska Native residents 10 23.9% Owner occupied33 76.1% Renter occupiedHouse owners and renters - Asian residents 3,415 79.1% Owner occupied902 20.9% Renter occupiedHouse owners and renters - Native Hawaiian / Pacific Islander residents 9 100.0% Owner occupiedHouse owners and renters - Other race residents 173 54.8% Owner occupied142 45.2% Renter occupiedHouse owners and renters - Two or more races residents 718 60.9% Owner occupied462 39.1% Renter occupiedHouse owners and renters - White alone residents 6,397 75.6% Owner occupied2,060 24.4% Renter occupiedHouse owners and renters - Hispanic or Latino residents 1,157 58.1% Owner occupied835 41.9% Renter occupied
Language usage in Coppell
English speakers - Total 61.3% of residents of Coppell speak English at home.
10.7% of residents speak Spanish at home 3,312 77.8% Speak English very well946 22.2% Speak English less than very well29.2% of residents speak other language at home 9,941 85.3% Speak English very well1,718 14.7% Speak English less than very well
English speakers - Born in the United States 84.5% of residents of Coppell speak English at home.
5.6% of residents speak Spanish at home 470 63.9% Speak English very well265 36.1% Speak English less than very well9.6% of residents speak other language at home 1,219 95.9% Speak English very well52 4.1% Speak English less than very well
English speakers - Native, born elsewhere 66.2% of residents of Coppell speak English at home.
26.6% of residents speak Spanish at home 128 70.7% Speak English very well53 29.3% Speak English less than very well6.2% of residents speak other language at home 42 100.0% Speak English very well
English speakers - Foreign-born 12.8% of residents of Coppell speak English at home.
13.8% of residents speak Spanish at home 1,105 66.0% Speak English very well569 34.0% Speak English less than very well76.7% of residents speak other language at home 7,694 83.0% Speak English very well1,572 17.0% Speak English less than very well
White (Caucasian) - Speak only English Native:
100.0% (16,030)Foreign-born:
34.1% (359)
White (Caucasian) - Speak another language Native:
5.6% (892)Foreign-born:
69.7% (733)
Black or African American - Speak only English Native:
97.1% (1,542)Foreign-born:
29.1% (89)
Black or African American - Speak another language Native:
2.9% (46)Foreign-born:
70.3% (215)
American Indian / Alaska Native - Speak another language Native:
100.0% (4)Foreign-born:
94.3% (160)
Asian - Speak only English Native:
49.9% (2,128)Foreign-born:
9.6% (818)
Asian - Speak another language Native:
49.5% (2,112)Foreign-born:
90.4% (7,668)
Native Hawaiian / Pacific Islander - Speak only English Native:
98.9% (8)Foreign-born:
51.5% (32)
Other race - Speak only English Native:
46.1% (289)Foreign-born:
4.9% (19)
Other race - Speak another language Native:
54.3% (341)Foreign-born:
95.1% (376)
Two or more races - Speak only English Native:
61.3% (2,015)Foreign-born:
2.0% (24)
Two or more races - Speak another language Native:
35.1% (1,155)Foreign-born:
97.5% (1,169)
White alone - Speak only English Native:
96.3% (16,112)Foreign-born:
30.8% (381)
White alone - Speak another language Native:
3.7% (619)Foreign-born:
68.6% (848)
Hispanic or Latino - Speak only English Native:
48.9% (1,993)Foreign-born:
4.3% (70)
Hispanic or Latino - Speak another language Native:
52.1% (2,122)Foreign-born:
95.7% (1,582)
Foreign-born residents in Coppell 12,865 residents are foreign born (20.7% Asia , 4.0% Latin America ).
This city:
30.3%Texas:
17.1%
Marital status for residents in Coppell Marital status - White (Caucasian) population 15 years and over
Males 21.1% Never married67.4% Now married1.0% Separated1.5% Widowed9.0% DivorcedFemales 21.7% Never married57.9% Now married0.7% Separated5.8% Widowed13.8% DivorcedWomen who gave birth in the past 12 months Now married:
100.0% (285)Unmarried:
0.0% (0)
Women who did not give birth in the past 12 months Now married:
47.4% (1,613)Unmarried:
52.6% (1,791)
Marital status - Black or African American population 15 years and over
Males 44.8% Never married38.3% Now married0.0% Separated0.0% Widowed16.9% DivorcedFemales 39.1% Never married30.9% Now married0.0% Separated2.1% Widowed27.8% DivorcedWomen who did not give birth in the past 12 months Now married:
19.9% (107)Unmarried:
80.1% (430)
Marital status - American Indian / Alaska Native population 15 years and over
Males 45.9% Never married50.0% Now married0.0% Separated4.1% Widowed0.0% DivorcedFemales 38.0% Never married62.0% Now married0.0% Separated0.0% Widowed0.0% DivorcedWomen who did not give birth in the past 12 months Now married:
62.0% (30)Unmarried:
38.0% (18)
Marital status - Asian population 15 years and over
Males 16.7% Never married81.5% Now married0.0% Separated0.6% Widowed1.2% DivorcedFemales 17.4% Never married75.0% Now married0.3% Separated5.3% Widowed2.0% DivorcedWomen who gave birth in the past 12 months Now married:
100.0% (168)Unmarried:
0.0% (0)
Women who did not give birth in the past 12 months Now married:
74.1% (2,585)Unmarried:
25.9% (904)
Marital status - Native Hawaiian / Pacific Islander population 15 years and over
Males 0.0% Never married100.0% Now married0.0% Separated0.0% Widowed0.0% DivorcedFemales 0.0% Never married100.0% Now married0.0% Separated0.0% Widowed0.0% DivorcedWomen who did not give birth in the past 12 months Now married:
100.0% (64)Unmarried:
0.0% (0)
Marital status - Other race population 15 years and over
Males 50.0% Never married50.0% Now married0.0% Separated0.0% Widowed0.0% DivorcedFemales 23.2% Never married62.3% Now married3.9% Separated0.0% Widowed10.5% DivorcedWomen who did not give birth in the past 12 months Now married:
62.4% (187)Unmarried:
37.6% (113)
Marital status - Two or more races population 15 years and over
Males 38.1% Never married55.8% Now married0.7% Separated0.0% Widowed5.4% DivorcedFemales 30.6% Never married62.0% Now married0.0% Separated3.8% Widowed3.6% DivorcedWomen who gave birth in the past 12 months Now married:
100.0% (27)Unmarried:
0.0% (0)
Women who did not give birth in the past 12 months Now married:
55.5% (510)Unmarried:
44.5% (410)
Marital status - White alone, not Hispanic / Latino population 15 years and over
Males 20.6% Never married68.6% Now married1.2% Separated1.7% Widowed7.9% DivorcedFemales 18.5% Never married59.2% Now married0.3% Separated6.8% Widowed15.2% DivorcedWomen who gave birth in the past 12 months Now married:
100.0% (287)Unmarried:
0.0% (0)
Women who did not give birth in the past 12 months Now married:
49.8% (1,909)Unmarried:
50.2% (1,926)
Marital status - Hispanic or Latino population 15 years and over
Males 31.1% Never married59.4% Now married0.0% Separated0.1% Widowed9.4% DivorcedFemales 34.3% Never married57.8% Now married2.1% Separated1.5% Widowed4.4% DivorcedWomen who gave birth in the past 12 months Now married:
100.0% (118)Unmarried:
0.0% (0)
Women who did not give birth in the past 12 months Now married:
46.9% (682)Unmarried:
53.1% (771)
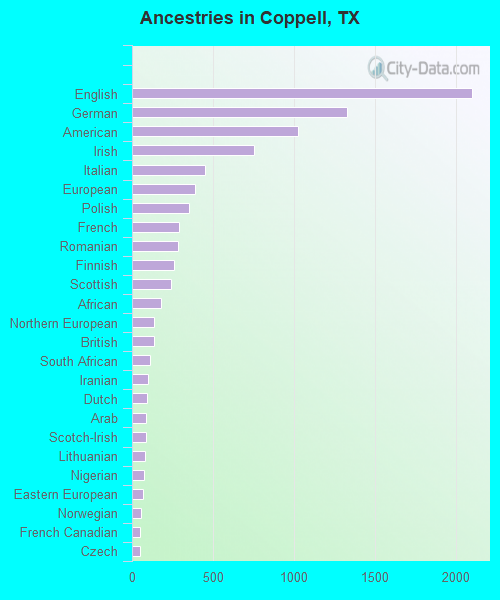
Ancestries in Coppell
2,101 8.4% English1,326 5.3% German1,023 4.1% American752 3.0% Irish452 1.8% Italian391 1.6% European352 1.4% Polish293 1.2% French284 1.1% Romanian257 1.0% Finnish238 1.0% Scottish179 0.7% African136 0.5% Northern European133 0.5% British113 0.5% South African100 0.4% Iranian92 0.4% Dutch89 0.4% Arab88 0.4% Scotch-Irish80 0.3% Lithuanian73 0.3% Nigerian68 0.3% Eastern European58 0.2% Norwegian51 0.2% French Canadian47 0.2% Czech46 0.2% Welsh43 0.2% Armenian42 0.2% Russian42 0.2% Turkish41 0.2% Scandinavian34 0.1% Macedonian32 0.1% Slovene30 0.1% Ukrainian27 0.1% Syrian26 0.1% Canadian26 0.1% Belgian16 0.06% Swedish16 0.06% Greek14 0.06% Egyptian12 0.05% Lebanese12 0.05% Swiss11 0.04% Slovak11 0.04% West Indian9 0.04% Danish7 0.03% Luxembourger6 0.02% Jordanian6 0.02% Hungarian5 0.02% Czechoslovakian4 0.02% Yugoslavian
Geographical mobility in Coppell Same house 1 year ago 14,185 85.8% White (Caucasian)1,754 87.1% Black or African American187 100.0% American Indian / Alaska Native11,618 87.1% Asian74 98.2% Native Hawaiian / Pacific Islander887 87.1% Other race4,520 94.7% Two or more races16,563 87.5% White alone, not Hispanic / Latino5,074 87.7% Hispanic or LatinoMoved within same county 1,224 7.4% White / Caucasian206 10.2% Black or African American603 4.5% Asian2 0.2% Other race67 1.4% Two or more races1,135 6.0% White alone, not Hispanic / Latino424 7.3% Hispanic or LatinoMoved within same state 698 4.2% White / Caucasian25 1.2% Black or African American266 2.0% Asian37 3.6% Other race56 1.2% Two or more races748 3.9% White alone, not Hispanic / Latino92 1.6% Hispanic or LatinoMoved from different state 381 2.3% White / Caucasian18 0.9% Black or African American358 2.7% Asian101 9.9% Other race72 1.5% Two or more races421 2.2% White alone, not Hispanic / Latino141 2.4% Hispanic or LatinoMoved from abroad 49 0.3% White358 2.7% Asian27 2.6% Other race63 1.3% Two or more races87 0.5% White alone, not Hispanic / Latino49 0.8% Hispanic or Latino
Children Nativity (place of birth) in Coppell
Children under 6 years - Living with two parents Both parents native 1,456 100.0% NativeBoth parents foreign-born 942 79.6% Native242 20.4% Foreign-bornOne native, one foreign-born parent 249 100.0% NativeChildren under 6 years - Living with one parent Native parent 232 100.0% NativeForeign-born parent 43 100.0% NativeChildren 6 to 17 years - Living with two parents Both parents native 2,204 98.3% Native37 1.7% Foreign-bornBoth parents foreign-born 2,561 69.2% Native1,142 30.8% Foreign-bornOne native, one foreign-born parent 728 100.0% NativeChildren 6 to 17 years - Living with one parent Native parent 1,193 100.0% NativeForeign-born parent 369 54.1% Native313 45.9% Foreign-born
Grandparents responsible for own grandchildren in Coppell
Grandparents (30 to 59 years) White / Caucasian 10 100.0% Not responsible for grandchildrenBlack or African American 38 100.0% Not responsible for grandchildrenAsian 9 100.0% Not responsible for grandchildrenOther race 40 100.0% Responsible for grandchildrenWhite alone, not Hispanic / Latino 13 100.0% Not responsible for grandchildrenHispanic or Latino 30 100.0% Responsible for grandchildrenGrandparents (60 years and over) White / Caucasian 64 68.0% Responsible for grandchildren30 32.0% Not responsible for grandchildrenBlack or African American 18 74.7% Responsible for grandchildren6 25.3% Not responsible for grandchildrenAsian 197 74.7% Responsible for grandchildren66 25.3% Not responsible for grandchildrenOther race 52 100.0% Responsible for grandchildrenWhite alone, not Hispanic / Latino 58 100.0% Not responsible for grandchildrenHispanic or Latino 99 85.0% Responsible for grandchildren18 15.0% Not responsible for grandchildren