Races in Covington, Washington (WA) Detailed Stats
Data:
Races - White alone (%)
Races - White alone (% change since 2000)
Races - Black alone (%)
Races - Black alone (% change since 2000)
Races - American Indian alone (%)
Races - American Indian alone (% change since 2000)
Races - Asian alone (%)
Races - Asian alone (% change since 2000)
Races - Hispanic (%)
Races - Hispanic (% change since 2000)
Races - Native Hawaiian and Other Pacific Islander alone (%)
Races - Native Hawaiian and Other Pacific Islander alone (% change since 2000)
Races - Two or more races(%)
Races - Two or more races(% change since 2000)
Races - Other race alone (%)
Races - Other race alone (% change since 2000)
Racial diversity
Place of birth - Born in state of residence (%)
Place of birth - Born in state of residence (%) - White
Place of birth - Born in state of residence (%) - Black or African American
Place of birth - Born in state of residence (%) - Asian
Place of birth - Born in state of residence (%) - Hispanic or Latino
Place of birth - Born in state of residence (%) - American Indian and Alaska Native
Place of birth - Born in state of residence (%) - Multirace
Place of birth - Born in state of residence (%) - Other Race
Place of birth - Born in other state (%)
Place of birth - Born in other state (%) - White
Place of birth - Born in other state (%) - Black or African American
Place of birth - Born in other state (%) - Asian
Place of birth - Born in other state (%) - Hispanic or Latino
Place of birth - Born in other state (%) - American Indian and Alaska Native
Place of birth - Born in other state (%) - Multirace
Place of birth - Born in other state (%) - Other Race
Place of birth - Native, outside of US (%)
Place of birth - Native, outside of US (%) - White
Place of birth - Native, outside of US (%) - Black or African American
Place of birth - Native, outside of US (%) - Asian
Place of birth - Native, outside of US (%) - Hispanic or Latino
Place of birth - Native, outside of US (%) - American Indian and Alaska Native
Place of birth - Native, outside of US (%) - Multirace
Place of birth - Native, outside of US (%) - Other Race
Place of birth - Foreign born (%)
Place of birth - Foreign born (%) - White
Place of birth - Foreign born (%) - Black or African American
Place of birth - Foreign born (%) - Asian
Place of birth - Foreign born (%) - Hispanic or Latino
Place of birth - Foreign born (%) - American Indian and Alaska Native
Place of birth - Foreign born (%) - Multirace
Place of birth - Foreign born (%) - Other Race
Residents speaking English at home (%)
Residents speaking English at home - Born in the United States (%)
Residents speaking English at home - Native, born elsewhere (%)
Residents speaking English at home - Foreign born (%)
Residents speaking Spanish at home (%)
Residents speaking Spanish at home - Born in the United States (%)
Residents speaking Spanish at home - Native, born elsewhere (%)
Residents speaking Spanish at home - Foreign born (%)
Residents speaking other language at home (%)
Residents speaking other language at home - Born in the United States (%)
Residents speaking other language at home - Native, born elsewhere (%)
Residents speaking other language at home - Foreign born (%)
Marital status - Never married (%)
Marital status - Now married (%)
Marital status - Separated (%)
Marital status - Widowed (%)
Marital status - Divorced (%)
Ancestries Reported - Arab (%)
Ancestries Reported - Czech (%)
Ancestries Reported - Danish (%)
Ancestries Reported - Dutch (%)
Ancestries Reported - English (%)
Ancestries Reported - French (%)
Ancestries Reported - French Canadian (%)
Ancestries Reported - German (%)
Ancestries Reported - Greek (%)
Ancestries Reported - Hungarian (%)
Ancestries Reported - Irish (%)
Ancestries Reported - Italian (%)
Ancestries Reported - Lithuanian (%)
Ancestries Reported - Norwegian (%)
Ancestries Reported - Polish (%)
Ancestries Reported - Portuguese (%)
Ancestries Reported - Russian (%)
Ancestries Reported - Scotch-Irish (%)
Ancestries Reported - Scottish (%)
Ancestries Reported - Slovak (%)
Ancestries Reported - Subsaharan African (%)
Ancestries Reported - Swedish (%)
Ancestries Reported - Swiss (%)
Ancestries Reported - Ukrainian (%)
Ancestries Reported - United States (%)
Ancestries Reported - Welsh (%)
Ancestries Reported - West Indian (%)
Ancestries Reported - Other (%)
Geographical mobility - Same house 1 year ago (%)
Geographical mobility - Same house 1 year ago (%) - White
Geographical mobility - Same house 1 year ago (%) - Black or African American
Geographical mobility - Same house 1 year ago (%) - Asian
Geographical mobility - Same house 1 year ago (%) - Hispanic or Latino
Geographical mobility - Same house 1 year ago (%) - American Indian and Alaska Native
Geographical mobility - Same house 1 year ago (%) - Multirace
Geographical mobility - Same house 1 year ago (%) - Other Race
Geographical mobility - Moved within same county (%)
Geographical mobility - Moved within same county (%) - White
Geographical mobility - Moved within same county (%) - Black or African American
Geographical mobility - Moved within same county (%) - Asian
Geographical mobility - Moved within same county (%) - Hispanic or Latino
Geographical mobility - Moved within same county (%) - American Indian and Alaska Native
Geographical mobility - Moved within same county (%) - Multirace
Geographical mobility - Moved within same county (%) - Other Race
Geographical mobility - Moved from different county within same state (%)
Geographical mobility - Moved from different county within same state (%) - White
Geographical mobility - Moved from different county within same state (%) - Black or African American
Geographical mobility - Moved from different county within same state (%) - Asian
Geographical mobility - Moved from different county within same state (%) - Hispanic or Latino
Geographical mobility - Moved from different county within same state (%) - American Indian and Alaska Native
Geographical mobility - Moved from different county within same state (%) - Multirace
Geographical mobility - Moved from different county within same state (%) - Other Race
Geographical mobility - Moved from different state (%)
Geographical mobility - Moved from different state (%) - White
Geographical mobility - Moved from different state (%) - Black or African American
Geographical mobility - Moved from different state (%) - Asian
Geographical mobility - Moved from different state (%) - Hispanic or Latino
Geographical mobility - Moved from different state (%) - American Indian and Alaska Native
Geographical mobility - Moved from different state (%) - Multirace
Geographical mobility - Moved from different state (%) - Other Race
Geographical mobility - Moved from abroad (%)
Geographical mobility - Moved from abroad (%) - White
Geographical mobility - Moved from abroad (%) - Black or African American
Geographical mobility - Moved from abroad (%) - Asian
Geographical mobility - Moved from abroad (%) - Hispanic or Latino
Geographical mobility - Moved from abroad (%) - American Indian and Alaska Native
Geographical mobility - Moved from abroad (%) - Multirace
Geographical mobility - Moved from abroad (%) - Other Race
Place of birth for the foreign-born population - Ireland (%)
Place of birth for the foreign-born population - Denmark (%)
Place of birth for the foreign-born population - Norway (%)
Place of birth for the foreign-born population - Sweden (%)
Place of birth for the foreign-born population - United Kingdom (%)
Place of birth for the foreign-born population - England (%)
Place of birth for the foreign-born population - Scotland (%)
Place of birth for the foreign-born population - Other Northern Europe (%)
Place of birth for the foreign-born population - Austria (%)
Place of birth for the foreign-born population - Belgium (%)
Place of birth for the foreign-born population - France (%)
Place of birth for the foreign-born population - Germany (%)
Place of birth for the foreign-born population - Netherlands (%)
Place of birth for the foreign-born population - Switzerland (%)
Place of birth for the foreign-born population - Other Western Europe (%)
Place of birth for the foreign-born population - Greece (%)
Place of birth for the foreign-born population - Italy (%)
Place of birth for the foreign-born population - Portugal (%)
Place of birth for the foreign-born population - Spain (%)
Place of birth for the foreign-born population - Other Southern Europe (%)
Place of birth for the foreign-born population - Albania (%)
Place of birth for the foreign-born population - Belarus (%)
Place of birth for the foreign-born population - Bosnia and Herzegovina (%)
Place of birth for the foreign-born population - Bulgaria (%)
Place of birth for the foreign-born population - Croatia (%)
Place of birth for the foreign-born population - Czechoslovakia (%)
Place of birth for the foreign-born population - Hungary (%)
Place of birth for the foreign-born population - Latvia (%)
Place of birth for the foreign-born population - Lithuania (%)
Place of birth for the foreign-born population - North Macedonia (Macedonia) (%)
Place of birth for the foreign-born population - Moldova (%)
Place of birth for the foreign-born population - Poland (%)
Place of birth for the foreign-born population - Romania (%)
Place of birth for the foreign-born population - Russia (%)
Place of birth for the foreign-born population - Serbia (%)
Place of birth for the foreign-born population - Ukraine (%)
Place of birth for the foreign-born population - Other Eastern Europe (%)
Place of birth for the foreign-born population - China (%)
Place of birth for the foreign-born population - Hong Kong (%)
Place of birth for the foreign-born population - Taiwan (%)
Place of birth for the foreign-born population - Japan (%)
Place of birth for the foreign-born population - Korea (%)
Place of birth for the foreign-born population - Other Eastern Asia (%)
Place of birth for the foreign-born population - Afghanistan (%)
Place of birth for the foreign-born population - Bangladesh (%)
Place of birth for the foreign-born population - India (%)
Place of birth for the foreign-born population - Iran (%)
Place of birth for the foreign-born population - Kazakhstan (%)
Place of birth for the foreign-born population - Nepal (%)
Place of birth for the foreign-born population - Pakistan (%)
Place of birth for the foreign-born population - Sri Lanka (%)
Place of birth for the foreign-born population - Uzbekistan (%)
Place of birth for the foreign-born population - Other South Central Asia (%)
Place of birth for the foreign-born population - Burma (%)
Place of birth for the foreign-born population - Cambodia (%)
Place of birth for the foreign-born population - Indonesia (%)
Place of birth for the foreign-born population - Laos (%)
Place of birth for the foreign-born population - Malaysia (%)
Place of birth for the foreign-born population - Philippines (%)
Place of birth for the foreign-born population - Singapore (%)
Place of birth for the foreign-born population - Thailand (%)
Place of birth for the foreign-born population - Vietnam (%)
Place of birth for the foreign-born population - Other South Eastern Asia (%)
Place of birth for the foreign-born population - Armenia (%)
Place of birth for the foreign-born population - Iraq (%)
Place of birth for the foreign-born population - Israel (%)
Place of birth for the foreign-born population - Jordan (%)
Place of birth for the foreign-born population - Kuwait (%)
Place of birth for the foreign-born population - Lebanon (%)
Place of birth for the foreign-born population - Saudi Arabia (%)
Place of birth for the foreign-born population - Syria (%)
Place of birth for the foreign-born population - Turkey (%)
Place of birth for the foreign-born population - Yemen (%)
Place of birth for the foreign-born population - Other Western Asia (%)
Place of birth for the foreign-born population - Eritrea (%)
Place of birth for the foreign-born population - Ethiopia (%)
Place of birth for the foreign-born population - Kenya (%)
Place of birth for the foreign-born population - Somalia (%)
Place of birth for the foreign-born population - Uganda (%)
Place of birth for the foreign-born population - Zimbabwe (%)
Place of birth for the foreign-born population - Other Eastern Africa (%)
Place of birth for the foreign-born population - Cameroon (%)
Place of birth for the foreign-born population - Congo (%)
Place of birth for the foreign-born population - Democratic Republic of Congo (Zaire) (%)
Place of birth for the foreign-born population - Other Middle Africa (%)
Place of birth for the foreign-born population - Egypt (%)
Place of birth for the foreign-born population - Morocco (%)
Place of birth for the foreign-born population - Sudan (%)
Place of birth for the foreign-born population - Other Northern Africa (%)
Place of birth for the foreign-born population - South Africa (%)
Place of birth for the foreign-born population - Other Southern Africa (%)
Place of birth for the foreign-born population - Cabo Verde (%)
Place of birth for the foreign-born population - Ghana (%)
Place of birth for the foreign-born population - Liberia (%)
Place of birth for the foreign-born population - Nigeria (%)
Place of birth for the foreign-born population - Senegal (%)
Place of birth for the foreign-born population - Sierra Leone (%)
Place of birth for the foreign-born population - Other Western Africa (%)
Place of birth for the foreign-born population - Australia (%)
Place of birth for the foreign-born population - New Zealand (%)
Place of birth for the foreign-born population - Fiji (%)
Place of birth for the foreign-born population - Micronesia (%)
Place of birth for the foreign-born population - Bahamas (%)
Place of birth for the foreign-born population - Barbados (%)
Place of birth for the foreign-born population - Cuba (%)
Place of birth for the foreign-born population - Dominica (%)
Place of birth for the foreign-born population - Dominican Republic (%)
Place of birth for the foreign-born population - Grenada (%)
Place of birth for the foreign-born population - Haiti (%)
Place of birth for the foreign-born population - Jamaica (%)
Place of birth for the foreign-born population - St. Vincent and the Grenadines (%)
Place of birth for the foreign-born population - Trinidad and Tobago (%)
Place of birth for the foreign-born population - West Indies (%)
Place of birth for the foreign-born population - Other Caribbean (%)
Place of birth for the foreign-born population - Belize (%)
Place of birth for the foreign-born population - Costa Rica (%)
Place of birth for the foreign-born population - El Salvador (%)
Place of birth for the foreign-born population - Guatemala (%)
Place of birth for the foreign-born population - Honduras (%)
Place of birth for the foreign-born population - Mexico (%)
Place of birth for the foreign-born population - Nicaragua (%)
Place of birth for the foreign-born population - Panama (%)
Place of birth for the foreign-born population - Other Central America (%)
Place of birth for the foreign-born population - Argentina (%)
Place of birth for the foreign-born population - Bolivia (%)
Place of birth for the foreign-born population - Brazil (%)
Place of birth for the foreign-born population - Chile (%)
Place of birth for the foreign-born population - Colombia (%)
Place of birth for the foreign-born population - Ecuador (%)
Place of birth for the foreign-born population - Guyana (%)
Place of birth for the foreign-born population - Peru (%)
Place of birth for the foreign-born population - Uruguay (%)
Place of birth for the foreign-born population - Venezuela (%)
Place of birth for the foreign-born population - Other South America (%)
Place of birth for the foreign-born population - Canada (%)
Place of birth for the foreign-born population - Other Northern America (%)
Place of birth for the foreign-born population - Other (%)
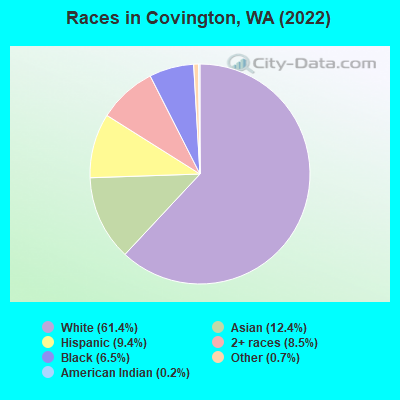
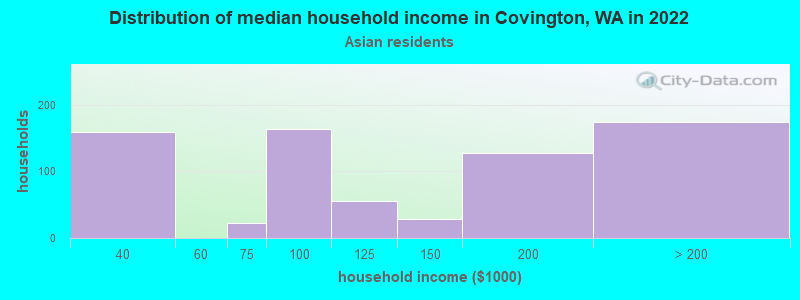
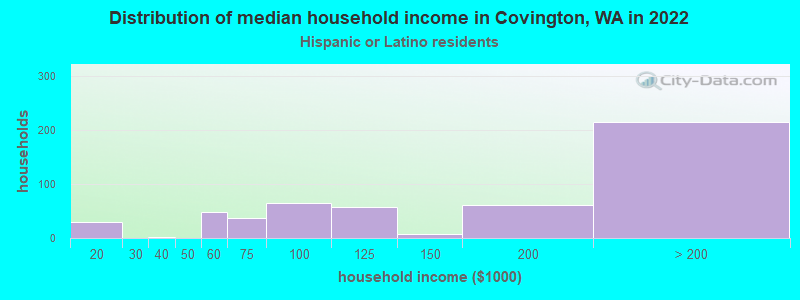
According to 2022 data, the most numerous races in Covington, WA are White alone (12,841 residents), Hispanic (1,969 residents), and Asian alone (2,587 residents). 74.7% of Covington residents speak English at home. 17.3% of Covington, WA residents are foreign-born (9.1% born in Asia, 3.6% born in Europe), which is 13.3% greater than the foreign-born rate of 15.0% across the entire state of Washington.
Race distribution in Covington
2000 2022
4,652,490 78.9% White alone 441,509 7.5% Hispanic 319,401 5.4% Asian alone 184,631 3.1% Black alone 175,926 3.0% Two or more races 85,396 1.4% American Indian alone 22,779 0.4% Native Hawaiian and Other 11,989 0.2% Other race alone
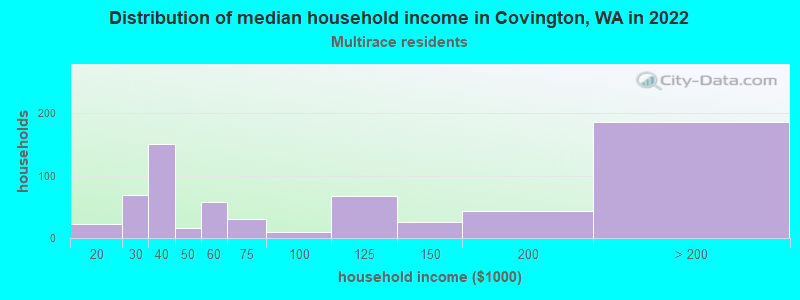
4,941,456 63.5% White alone 1,093,313 14.0% Hispanic 755,832 9.7% Asian alone 523,448 6.7% Two or more races 299,537 3.8% Black alone 69,024 0.9% American Indian alone 52,231 0.7% Native Hawaiian and Other 50,945 0.7% Other race alone
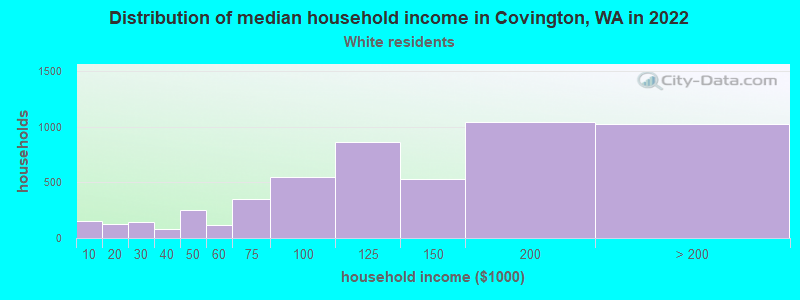
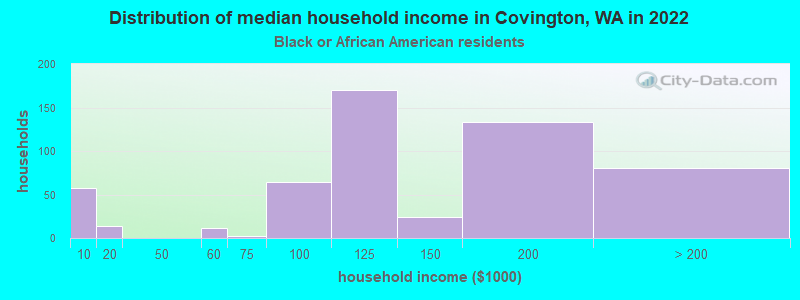
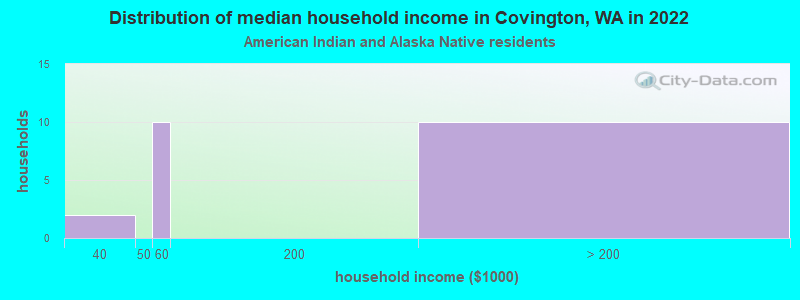
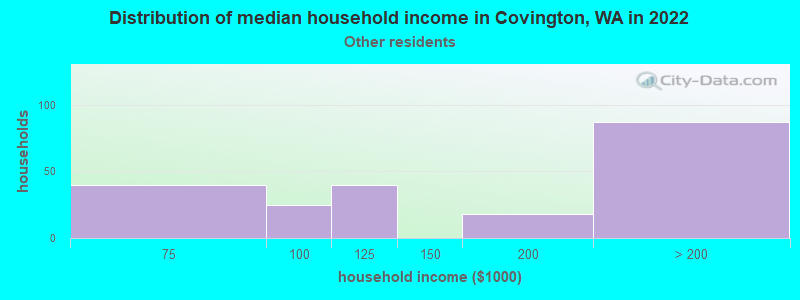
Income and house value in Covington Median household income in 2022 $124,206 White non-Hispanic householders$122,427 Black householders$123,613 Asian householders$100,304 Two or more races householders$163,154 Hispanic or Latino race householdersMedian 2022 house value $618,695 White Non-Hispanic householders$565,490 Black or African American householders$828,094 American Indian or Alaska Native householders $720,544 Asian householders$565,110 Some other race householders$600,454 Two or more races householders$619,455 Hispanic or Latino householders
Median age by race in Covington
40.2 Median age for White residents39.1 40.9 32.8 Median age for Black or African American residents31.8 40.1 29.8 Median age for American Indian / Alaska Native residents0.0 29.5 42.0 Median age for Asian residents40.2 47.9 -653,927,812.5 Median age for Native Hawaiian / Pacific Islander residents-664,509,168.7 -651,945,320.1 39.8 Median age for Other race residents39.2 45.1 28.6 Median age for Two or more races residents32.0 25.4 40.7 Median age for White alone residents40.3 40.8 27.9 Median age for Hispanic or Latino residents32.1 23.6
Owner/renter occupied households by race in Covington
House owners and renters - White residents 4,314 81.2% Owner occupied999 18.8% Renter occupiedHouse owners and renters - Black or African American residents 369 70.1% Owner occupied157 29.9% Renter occupiedHouse owners and renters - American Indian / Alaska Native residents 17 100.0% Owner occupiedHouse owners and renters - Asian residents 660 94.8% Owner occupied36 5.2% Renter occupiedHouse owners and renters - Native Hawaiian / Pacific Islander residents 52 100.0% Owner occupiedHouse owners and renters - Other race residents 125 69.5% Owner occupied55 30.5% Renter occupiedHouse owners and renters - Two or more races residents 476 75.1% Owner occupied158 24.9% Renter occupiedHouse owners and renters - White alone residents 4,271 81.4% Owner occupied976 18.6% Renter occupiedHouse owners and renters - Hispanic or Latino residents 398 79.4% Owner occupied103 20.6% Renter occupied
Language usage in Covington
English speakers - Total 74.7% of residents of Covington speak English at home.
4.4% of residents speak Spanish at home 675 77.0% Speak English very well202 23.0% Speak English less than very well20.3% of residents speak other language at home 2,726 68.0% Speak English very well1,281 32.0% Speak English less than very well
English speakers - Born in the United States 93.5% of residents of Covington speak English at home.
4.7% of residents speak Spanish at home 186 63.7% Speak English very well106 36.3% Speak English less than very well2.0% of residents speak other language at home 128 100.0% Speak English very well
English speakers - Native, born elsewhere 29.0% of residents of Covington speak English at home.
77.7% of residents speak other language at home 304 96.8% Speak English very well10 3.2% Speak English less than very well
English speakers - Foreign-born 12.0% of residents of Covington speak English at home.
9.6% of residents speak Spanish at home 222 64.9% Speak English very well120 35.1% Speak English less than very well79.1% of residents speak other language at home 1,745 61.9% Speak English very well1,076 38.1% Speak English less than very well
White (Caucasian) - Speak only English Native:
94.6% (11,038)Foreign-born:
18.6% (156)
White (Caucasian) - Speak another language Native:
5.4% (632)Foreign-born:
81.9% (686)
Black or African American - Speak another language Native:
23.3% (184)Foreign-born:
97.3% (316)
Asian - Speak only English Native:
78.0% (503)Foreign-born:
13.8% (251)
Asian - Speak another language Native:
18.7% (120)Foreign-born:
86.2% (1,568)
Other race - Speak another language Native:
49.2% (207)Foreign-born:
100.0% (116)
Two or more races - Speak only English Native:
77.4% (1,797)Foreign-born:
4.3% (19)
Two or more races - Speak another language Native:
23.8% (553)Foreign-born:
96.0% (424)
White alone - Speak only English Native:
93.8% (10,610)Foreign-born:
17.2% (159)
White alone - Speak another language Native:
6.5% (731)Foreign-born:
85.4% (789)
Hispanic or Latino - Speak another language Native:
33.5% (480)Foreign-born:
100.0% (364)
Foreign-born residents in Covington 3,623 residents are foreign born (9.1% Asia , 3.6% Europe ).
This city:
17.3%Washington:
14.9%
Marital status for residents in Covington Marital status - White (Caucasian) population 15 years and over
Males 31.4% Never married58.5% Now married0.4% Separated2.1% Widowed7.6% DivorcedFemales 19.7% Never married52.6% Now married0.1% Separated7.5% Widowed20.2% DivorcedWomen who gave birth in the past 12 months Now married:
62.9% (61)Unmarried:
37.1% (36)
Women who did not give birth in the past 12 months Now married:
52.0% (1,580)Unmarried:
48.0% (1,459)
Marital status - Black or African American population 15 years and over
Males 14.6% Never married53.9% Now married0.0% Separated3.0% Widowed28.5% DivorcedFemales 29.7% Never married59.9% Now married0.0% Separated0.0% Widowed10.4% DivorcedWomen who gave birth in the past 12 months Now married:
91.3% (117)Unmarried:
8.7% (11)
Women who did not give birth in the past 12 months Now married:
43.8% (98)Unmarried:
56.2% (126)
Marital status - American Indian / Alaska Native population 15 years and over
Males 0.0% Never married91.3% Now married0.0% Separated0.0% Widowed8.7% DivorcedFemales 26.2% Never married73.8% Now married0.0% Separated0.0% Widowed0.0% DivorcedWomen who gave birth in the past 12 months Now married:
100.0% (26)Unmarried:
0.0% (0)
Women who did not give birth in the past 12 months Now married:
0.0% (0)Unmarried:
100.0% (13)
Marital status - Asian population 15 years and over
Males 33.5% Never married53.4% Now married0.0% Separated0.0% Widowed13.1% DivorcedFemales 21.8% Never married67.3% Now married0.0% Separated2.2% Widowed8.7% DivorcedWomen who gave birth in the past 12 months Now married:
100.0% (73)Unmarried:
0.0% (0)
Women who did not give birth in the past 12 months Now married:
47.3% (275)Unmarried:
52.7% (307)
Marital status - Other race population 15 years and over
Males 7.6% Never married92.4% Now married0.0% Separated0.0% Widowed0.0% DivorcedFemales 17.4% Never married75.8% Now married0.0% Separated6.7% Widowed0.0% DivorcedWomen who did not give birth in the past 12 months Now married:
63.1% (65)Unmarried:
36.9% (38)
Marital status - Two or more races population 15 years and over
Males 34.0% Never married55.1% Now married0.0% Separated0.0% Widowed10.9% DivorcedFemales 33.9% Never married56.2% Now married1.2% Separated0.0% Widowed8.7% DivorcedWomen who gave birth in the past 12 months Now married:
60.4% (33)Unmarried:
39.6% (22)
Women who did not give birth in the past 12 months Now married:
55.3% (343)Unmarried:
44.7% (277)
Marital status - White alone, not Hispanic / Latino population 15 years and over
Males 30.6% Never married58.8% Now married0.5% Separated2.1% Widowed7.9% DivorcedFemales 19.2% Never married53.0% Now married0.1% Separated7.6% Widowed20.2% DivorcedWomen who gave birth in the past 12 months Now married:
62.9% (63)Unmarried:
37.1% (37)
Women who did not give birth in the past 12 months Now married:
52.8% (1,607)Unmarried:
47.2% (1,439)
Marital status - Hispanic or Latino population 15 years and over
Males 31.7% Never married63.9% Now married0.0% Separated0.0% Widowed4.4% DivorcedFemales 26.1% Never married61.5% Now married0.0% Separated2.8% Widowed9.6% DivorcedWomen who gave birth in the past 12 months Now married:
67.2% (41)Unmarried:
32.8% (20)
Women who did not give birth in the past 12 months Now married:
46.0% (103)Unmarried:
54.0% (121)
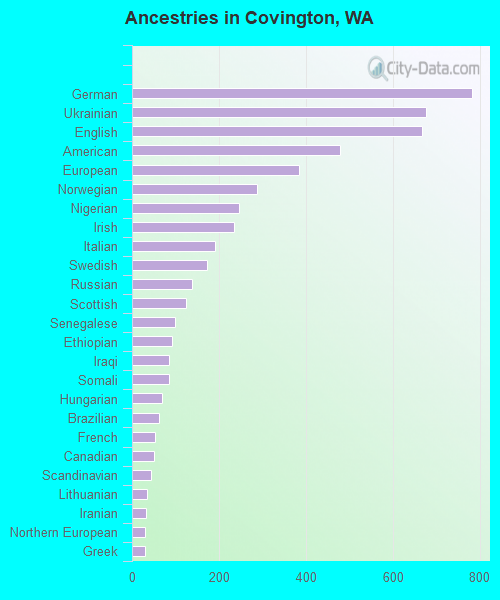
Ancestries in Covington
782 8.0% German676 6.9% Ukrainian666 6.8% English479 4.9% American383 3.9% European288 3.0% Norwegian245 2.5% Nigerian235 2.4% Irish191 2.0% Italian173 1.8% Swedish138 1.4% Russian125 1.3% Scottish99 1.0% Senegalese92 0.9% Ethiopian86 0.9% Iraqi85 0.9% Somali69 0.7% Hungarian61 0.6% Brazilian53 0.5% French51 0.5% Canadian43 0.4% Scandinavian35 0.4% Lithuanian33 0.3% Iranian31 0.3% Northern European30 0.3% Greek29 0.3% Scotch-Irish25 0.3% Polish25 0.3% African22 0.2% Dutch22 0.2% Danish19 0.2% Croatian19 0.2% Welsh18 0.2% Eastern European13 0.1% British9 0.09% Finnish8 0.08% French Canadian6 0.06% Estonian4 0.04% Lebanese
Geographical mobility in Covington Same house 1 year ago 11,691 89.6% White (Caucasian)1,048 79.7% Black or African American30 36.4% American Indian / Alaska Native1,845 70.6% Asian34 100.0% Native Hawaiian / Pacific Islander357 62.3% Other race2,427 86.4% Two or more races11,505 90.4% White alone, not Hispanic / Latino1,277 65.8% Hispanic or LatinoMoved within same county 1,086 8.3% White / Caucasian143 10.9% Black or African American60 73.0% American Indian / Alaska Native702 26.9% Asian185 32.4% Other race343 12.2% Two or more races946 7.4% White alone, not Hispanic / Latino593 30.5% Hispanic or LatinoMoved within same state 200 1.5% White / Caucasian17 1.3% Black or African American48 1.7% Two or more races206 1.6% White alone, not Hispanic / Latino30 1.5% Hispanic or LatinoMoved from different state 124 1.0% White / Caucasian39 6.8% Other race128 1.0% White alone, not Hispanic / Latino23 1.2% Hispanic or LatinoMoved from abroad 229 17.4% Black or African American68 2.6% Asian
Children Nativity (place of birth) in Covington
Children under 6 years - Living with two parents Both parents native 708 100.0% NativeBoth parents foreign-born 452 88.2% Native60 11.8% Foreign-bornOne native, one foreign-born parent 79 100.0% NativeChildren under 6 years - Living with one parent Native parent 184 100.0% NativeForeign-born parent 71 100.0% NativeChildren 6 to 17 years - Living with two parents Both parents native 1,594 100.0% NativeBoth parents foreign-born 501 94.7% Native28 5.3% Foreign-bornOne native, one foreign-born parent 133 100.0% NativeChildren 6 to 17 years - Living with one parent Native parent 772 100.0% NativeForeign-born parent 181 50.9% Native174 49.1% Foreign-born
Grandparents responsible for own grandchildren in Covington
Grandparents (30 to 59 years) White / Caucasian 46 59.1% Responsible for grandchildren32 40.9% Not responsible for grandchildrenAsian 55 100.0% Responsible for grandchildrenWhite alone, not Hispanic / Latino 46 56.6% Responsible for grandchildren35 43.4% Not responsible for grandchildrenGrandparents (60 years and over) White / Caucasian 80 33.2% Responsible for grandchildren162 66.8% Not responsible for grandchildrenAsian 38 100.0% Not responsible for grandchildrenWhite alone, not Hispanic / Latino 80 32.6% Responsible for grandchildren165 67.4% Not responsible for grandchildren