Races in Cumberland Hill, Rhode Island (RI) Detailed Stats
Data:
Races - White alone (%)
Races - White alone (% change since 2000)
Races - Black alone (%)
Races - Black alone (% change since 2000)
Races - American Indian alone (%)
Races - American Indian alone (% change since 2000)
Races - Asian alone (%)
Races - Asian alone (% change since 2000)
Races - Hispanic (%)
Races - Hispanic (% change since 2000)
Races - Native Hawaiian and Other Pacific Islander alone (%)
Races - Native Hawaiian and Other Pacific Islander alone (% change since 2000)
Races - Two or more races(%)
Races - Two or more races(% change since 2000)
Races - Other race alone (%)
Races - Other race alone (% change since 2000)
Racial diversity
Place of birth - Born in state of residence (%)
Place of birth - Born in state of residence (%) - White
Place of birth - Born in state of residence (%) - Black or African American
Place of birth - Born in state of residence (%) - Asian
Place of birth - Born in state of residence (%) - Hispanic or Latino
Place of birth - Born in state of residence (%) - American Indian and Alaska Native
Place of birth - Born in state of residence (%) - Multirace
Place of birth - Born in state of residence (%) - Other Race
Place of birth - Born in other state (%)
Place of birth - Born in other state (%) - White
Place of birth - Born in other state (%) - Black or African American
Place of birth - Born in other state (%) - Asian
Place of birth - Born in other state (%) - Hispanic or Latino
Place of birth - Born in other state (%) - American Indian and Alaska Native
Place of birth - Born in other state (%) - Multirace
Place of birth - Born in other state (%) - Other Race
Place of birth - Native, outside of US (%)
Place of birth - Native, outside of US (%) - White
Place of birth - Native, outside of US (%) - Black or African American
Place of birth - Native, outside of US (%) - Asian
Place of birth - Native, outside of US (%) - Hispanic or Latino
Place of birth - Native, outside of US (%) - American Indian and Alaska Native
Place of birth - Native, outside of US (%) - Multirace
Place of birth - Native, outside of US (%) - Other Race
Place of birth - Foreign born (%)
Place of birth - Foreign born (%) - White
Place of birth - Foreign born (%) - Black or African American
Place of birth - Foreign born (%) - Asian
Place of birth - Foreign born (%) - Hispanic or Latino
Place of birth - Foreign born (%) - American Indian and Alaska Native
Place of birth - Foreign born (%) - Multirace
Place of birth - Foreign born (%) - Other Race
Residents speaking English at home (%)
Residents speaking English at home - Born in the United States (%)
Residents speaking English at home - Native, born elsewhere (%)
Residents speaking English at home - Foreign born (%)
Residents speaking Spanish at home (%)
Residents speaking Spanish at home - Born in the United States (%)
Residents speaking Spanish at home - Native, born elsewhere (%)
Residents speaking Spanish at home - Foreign born (%)
Residents speaking other language at home (%)
Residents speaking other language at home - Born in the United States (%)
Residents speaking other language at home - Native, born elsewhere (%)
Residents speaking other language at home - Foreign born (%)
Marital status - Never married (%)
Marital status - Now married (%)
Marital status - Separated (%)
Marital status - Widowed (%)
Marital status - Divorced (%)
Ancestries Reported - Arab (%)
Ancestries Reported - Czech (%)
Ancestries Reported - Danish (%)
Ancestries Reported - Dutch (%)
Ancestries Reported - English (%)
Ancestries Reported - French (%)
Ancestries Reported - French Canadian (%)
Ancestries Reported - German (%)
Ancestries Reported - Greek (%)
Ancestries Reported - Hungarian (%)
Ancestries Reported - Irish (%)
Ancestries Reported - Italian (%)
Ancestries Reported - Lithuanian (%)
Ancestries Reported - Norwegian (%)
Ancestries Reported - Polish (%)
Ancestries Reported - Portuguese (%)
Ancestries Reported - Russian (%)
Ancestries Reported - Scotch-Irish (%)
Ancestries Reported - Scottish (%)
Ancestries Reported - Slovak (%)
Ancestries Reported - Subsaharan African (%)
Ancestries Reported - Swedish (%)
Ancestries Reported - Swiss (%)
Ancestries Reported - Ukrainian (%)
Ancestries Reported - United States (%)
Ancestries Reported - Welsh (%)
Ancestries Reported - West Indian (%)
Ancestries Reported - Other (%)
Geographical mobility - Same house 1 year ago (%)
Geographical mobility - Same house 1 year ago (%) - White
Geographical mobility - Same house 1 year ago (%) - Black or African American
Geographical mobility - Same house 1 year ago (%) - Asian
Geographical mobility - Same house 1 year ago (%) - Hispanic or Latino
Geographical mobility - Same house 1 year ago (%) - American Indian and Alaska Native
Geographical mobility - Same house 1 year ago (%) - Multirace
Geographical mobility - Same house 1 year ago (%) - Other Race
Geographical mobility - Moved within same county (%)
Geographical mobility - Moved within same county (%) - White
Geographical mobility - Moved within same county (%) - Black or African American
Geographical mobility - Moved within same county (%) - Asian
Geographical mobility - Moved within same county (%) - Hispanic or Latino
Geographical mobility - Moved within same county (%) - American Indian and Alaska Native
Geographical mobility - Moved within same county (%) - Multirace
Geographical mobility - Moved within same county (%) - Other Race
Geographical mobility - Moved from different county within same state (%)
Geographical mobility - Moved from different county within same state (%) - White
Geographical mobility - Moved from different county within same state (%) - Black or African American
Geographical mobility - Moved from different county within same state (%) - Asian
Geographical mobility - Moved from different county within same state (%) - Hispanic or Latino
Geographical mobility - Moved from different county within same state (%) - American Indian and Alaska Native
Geographical mobility - Moved from different county within same state (%) - Multirace
Geographical mobility - Moved from different county within same state (%) - Other Race
Geographical mobility - Moved from different state (%)
Geographical mobility - Moved from different state (%) - White
Geographical mobility - Moved from different state (%) - Black or African American
Geographical mobility - Moved from different state (%) - Asian
Geographical mobility - Moved from different state (%) - Hispanic or Latino
Geographical mobility - Moved from different state (%) - American Indian and Alaska Native
Geographical mobility - Moved from different state (%) - Multirace
Geographical mobility - Moved from different state (%) - Other Race
Geographical mobility - Moved from abroad (%)
Geographical mobility - Moved from abroad (%) - White
Geographical mobility - Moved from abroad (%) - Black or African American
Geographical mobility - Moved from abroad (%) - Asian
Geographical mobility - Moved from abroad (%) - Hispanic or Latino
Geographical mobility - Moved from abroad (%) - American Indian and Alaska Native
Geographical mobility - Moved from abroad (%) - Multirace
Geographical mobility - Moved from abroad (%) - Other Race
Place of birth for the foreign-born population - Ireland (%)
Place of birth for the foreign-born population - Denmark (%)
Place of birth for the foreign-born population - Norway (%)
Place of birth for the foreign-born population - Sweden (%)
Place of birth for the foreign-born population - United Kingdom (%)
Place of birth for the foreign-born population - England (%)
Place of birth for the foreign-born population - Scotland (%)
Place of birth for the foreign-born population - Other Northern Europe (%)
Place of birth for the foreign-born population - Austria (%)
Place of birth for the foreign-born population - Belgium (%)
Place of birth for the foreign-born population - France (%)
Place of birth for the foreign-born population - Germany (%)
Place of birth for the foreign-born population - Netherlands (%)
Place of birth for the foreign-born population - Switzerland (%)
Place of birth for the foreign-born population - Other Western Europe (%)
Place of birth for the foreign-born population - Greece (%)
Place of birth for the foreign-born population - Italy (%)
Place of birth for the foreign-born population - Portugal (%)
Place of birth for the foreign-born population - Spain (%)
Place of birth for the foreign-born population - Other Southern Europe (%)
Place of birth for the foreign-born population - Albania (%)
Place of birth for the foreign-born population - Belarus (%)
Place of birth for the foreign-born population - Bosnia and Herzegovina (%)
Place of birth for the foreign-born population - Bulgaria (%)
Place of birth for the foreign-born population - Croatia (%)
Place of birth for the foreign-born population - Czechoslovakia (%)
Place of birth for the foreign-born population - Hungary (%)
Place of birth for the foreign-born population - Latvia (%)
Place of birth for the foreign-born population - Lithuania (%)
Place of birth for the foreign-born population - North Macedonia (Macedonia) (%)
Place of birth for the foreign-born population - Moldova (%)
Place of birth for the foreign-born population - Poland (%)
Place of birth for the foreign-born population - Romania (%)
Place of birth for the foreign-born population - Russia (%)
Place of birth for the foreign-born population - Serbia (%)
Place of birth for the foreign-born population - Ukraine (%)
Place of birth for the foreign-born population - Other Eastern Europe (%)
Place of birth for the foreign-born population - China (%)
Place of birth for the foreign-born population - Hong Kong (%)
Place of birth for the foreign-born population - Taiwan (%)
Place of birth for the foreign-born population - Japan (%)
Place of birth for the foreign-born population - Korea (%)
Place of birth for the foreign-born population - Other Eastern Asia (%)
Place of birth for the foreign-born population - Afghanistan (%)
Place of birth for the foreign-born population - Bangladesh (%)
Place of birth for the foreign-born population - India (%)
Place of birth for the foreign-born population - Iran (%)
Place of birth for the foreign-born population - Kazakhstan (%)
Place of birth for the foreign-born population - Nepal (%)
Place of birth for the foreign-born population - Pakistan (%)
Place of birth for the foreign-born population - Sri Lanka (%)
Place of birth for the foreign-born population - Uzbekistan (%)
Place of birth for the foreign-born population - Other South Central Asia (%)
Place of birth for the foreign-born population - Burma (%)
Place of birth for the foreign-born population - Cambodia (%)
Place of birth for the foreign-born population - Indonesia (%)
Place of birth for the foreign-born population - Laos (%)
Place of birth for the foreign-born population - Malaysia (%)
Place of birth for the foreign-born population - Philippines (%)
Place of birth for the foreign-born population - Singapore (%)
Place of birth for the foreign-born population - Thailand (%)
Place of birth for the foreign-born population - Vietnam (%)
Place of birth for the foreign-born population - Other South Eastern Asia (%)
Place of birth for the foreign-born population - Armenia (%)
Place of birth for the foreign-born population - Iraq (%)
Place of birth for the foreign-born population - Israel (%)
Place of birth for the foreign-born population - Jordan (%)
Place of birth for the foreign-born population - Kuwait (%)
Place of birth for the foreign-born population - Lebanon (%)
Place of birth for the foreign-born population - Saudi Arabia (%)
Place of birth for the foreign-born population - Syria (%)
Place of birth for the foreign-born population - Turkey (%)
Place of birth for the foreign-born population - Yemen (%)
Place of birth for the foreign-born population - Other Western Asia (%)
Place of birth for the foreign-born population - Eritrea (%)
Place of birth for the foreign-born population - Ethiopia (%)
Place of birth for the foreign-born population - Kenya (%)
Place of birth for the foreign-born population - Somalia (%)
Place of birth for the foreign-born population - Uganda (%)
Place of birth for the foreign-born population - Zimbabwe (%)
Place of birth for the foreign-born population - Other Eastern Africa (%)
Place of birth for the foreign-born population - Cameroon (%)
Place of birth for the foreign-born population - Congo (%)
Place of birth for the foreign-born population - Democratic Republic of Congo (Zaire) (%)
Place of birth for the foreign-born population - Other Middle Africa (%)
Place of birth for the foreign-born population - Egypt (%)
Place of birth for the foreign-born population - Morocco (%)
Place of birth for the foreign-born population - Sudan (%)
Place of birth for the foreign-born population - Other Northern Africa (%)
Place of birth for the foreign-born population - South Africa (%)
Place of birth for the foreign-born population - Other Southern Africa (%)
Place of birth for the foreign-born population - Cabo Verde (%)
Place of birth for the foreign-born population - Ghana (%)
Place of birth for the foreign-born population - Liberia (%)
Place of birth for the foreign-born population - Nigeria (%)
Place of birth for the foreign-born population - Senegal (%)
Place of birth for the foreign-born population - Sierra Leone (%)
Place of birth for the foreign-born population - Other Western Africa (%)
Place of birth for the foreign-born population - Australia (%)
Place of birth for the foreign-born population - New Zealand (%)
Place of birth for the foreign-born population - Fiji (%)
Place of birth for the foreign-born population - Micronesia (%)
Place of birth for the foreign-born population - Bahamas (%)
Place of birth for the foreign-born population - Barbados (%)
Place of birth for the foreign-born population - Cuba (%)
Place of birth for the foreign-born population - Dominica (%)
Place of birth for the foreign-born population - Dominican Republic (%)
Place of birth for the foreign-born population - Grenada (%)
Place of birth for the foreign-born population - Haiti (%)
Place of birth for the foreign-born population - Jamaica (%)
Place of birth for the foreign-born population - St. Vincent and the Grenadines (%)
Place of birth for the foreign-born population - Trinidad and Tobago (%)
Place of birth for the foreign-born population - West Indies (%)
Place of birth for the foreign-born population - Other Caribbean (%)
Place of birth for the foreign-born population - Belize (%)
Place of birth for the foreign-born population - Costa Rica (%)
Place of birth for the foreign-born population - El Salvador (%)
Place of birth for the foreign-born population - Guatemala (%)
Place of birth for the foreign-born population - Honduras (%)
Place of birth for the foreign-born population - Mexico (%)
Place of birth for the foreign-born population - Nicaragua (%)
Place of birth for the foreign-born population - Panama (%)
Place of birth for the foreign-born population - Other Central America (%)
Place of birth for the foreign-born population - Argentina (%)
Place of birth for the foreign-born population - Bolivia (%)
Place of birth for the foreign-born population - Brazil (%)
Place of birth for the foreign-born population - Chile (%)
Place of birth for the foreign-born population - Colombia (%)
Place of birth for the foreign-born population - Ecuador (%)
Place of birth for the foreign-born population - Guyana (%)
Place of birth for the foreign-born population - Peru (%)
Place of birth for the foreign-born population - Uruguay (%)
Place of birth for the foreign-born population - Venezuela (%)
Place of birth for the foreign-born population - Other South America (%)
Place of birth for the foreign-born population - Canada (%)
Place of birth for the foreign-born population - Other Northern America (%)
Place of birth for the foreign-born population - Other (%)
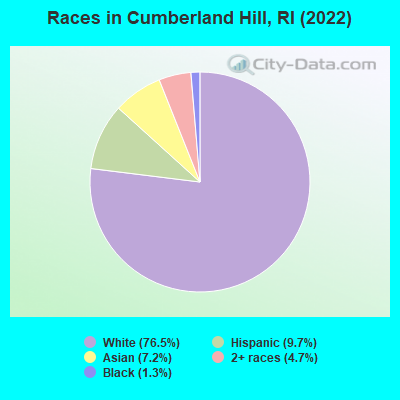
According to 2022 data, the most numerous races in Cumberland Hill, RI are White alone (6,774 residents), Hispanic (857 residents), and Two or more races (415 residents). 82.0% of Cumberland Hill residents speak English at home. 10.5% of Cumberland Hill, RI residents are foreign-born (4.2% born in Asia, 2.6% born in Latin America, 1.9% born in Europe), which is 32.9% less than the foreign-born rate of 14.0% across the entire state of Rhode Island.
Race distribution in Cumberland Hill
2000 2022
858,433 81.9% White alone 90,820 8.7% Hispanic 41,922 4.0% Black alone 23,416 2.2% Asian alone 20,816 2.0% Two or more races 8,411 0.8% Other race alone 4,181 0.4% American Indian alone 320 0.03% Native Hawaiian and Other
745,825 68.2% White alone 191,979 17.6% Hispanic 56,738 5.2% Two or more races 51,326 4.7% Black alone 37,234 3.4% Asian alone 9,514 0.9% Other race alone 978 0.09% American Indian alone 140 0.01% Native Hawaiian and Other
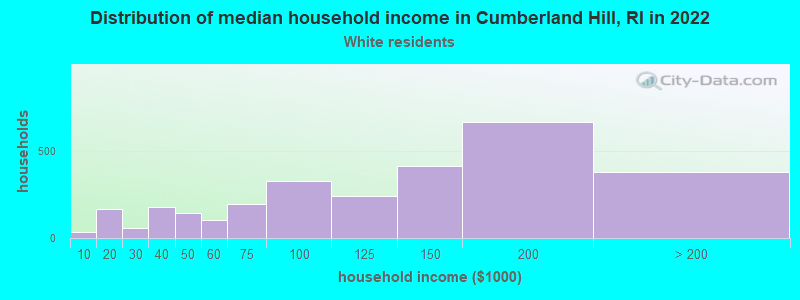
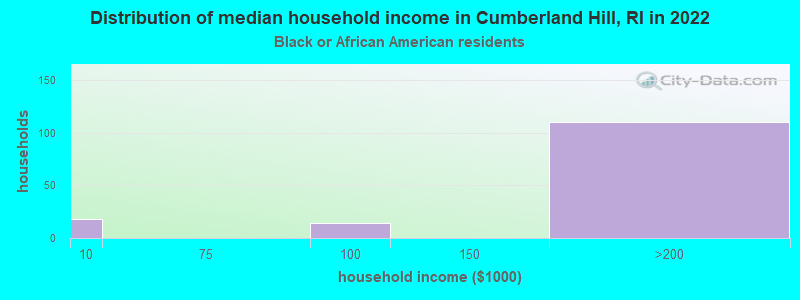
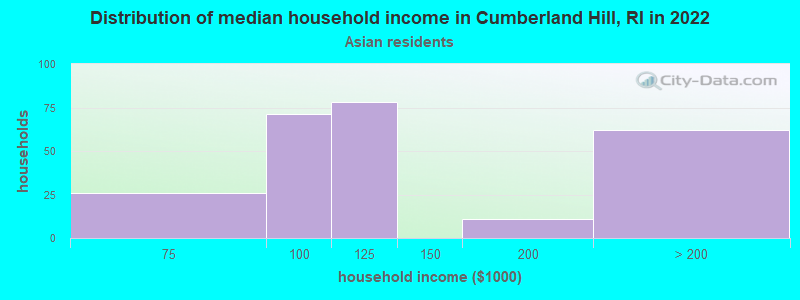
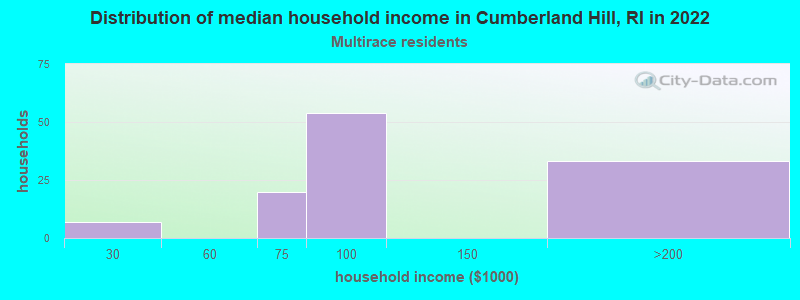
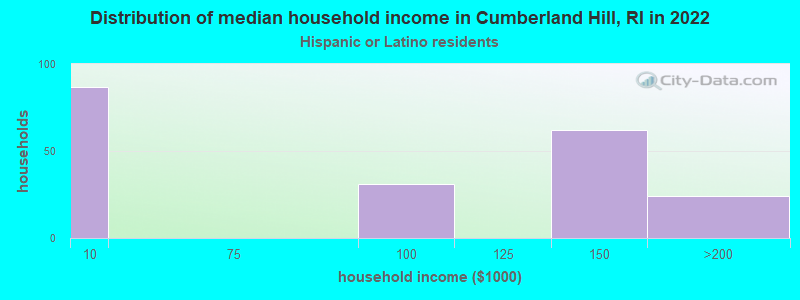
Income and house value in Cumberland Hill Median household income in 2022 $115,116 White non-Hispanic householders$110,359 Asian householders$78,691 Two or more races householdersMedian 2022 house value $405,979 White Non-Hispanic householders$394,782 Black or African American householders $367,219 Asian householders$402,821 Some other race householders
Median age by race in Cumberland Hill
48.9 Median age for White residents47.6 50.9 33.4 Median age for Black or African American residents-679,324,893.8 30.8 -628,930,817.0 Median age for American Indian / Alaska Native residents-743,837,083.9 -606,811,144.9 37.8 Median age for Asian residents40.1 34.3 -713,991,768.8 Median age for Native Hawaiian / Pacific Islander residents-668,724,279.2 -670,599,802.7 18.5 Median age for Other race residents18.5 11.0 14.8 Median age for Two or more races residents10.9 24.9 47.3 Median age for White alone residents46.3 49.8 23.8 Median age for Hispanic or Latino residents32.5 23.8
Owner/renter occupied households by race in Cumberland Hill
House owners and renters - White residents 2,448 85.3% Owner occupied423 14.7% Renter occupiedHouse owners and renters - Black or African American residents 92 100.0% Owner occupiedHouse owners and renters - Asian residents 241 92.6% Owner occupied19 7.4% Renter occupiedHouse owners and renters - Other race residents 60 100.0% Owner occupiedHouse owners and renters - Two or more races residents 79 66.2% Owner occupied40 33.8% Renter occupiedHouse owners and renters - White alone residents 2,460 84.2% Owner occupied461 15.8% Renter occupiedHouse owners and renters - Hispanic or Latino residents 165 100.0% Owner occupied
Language usage in Cumberland Hill
English speakers - Total 82.0% of residents of Cumberland Hill speak English at home.
4.1% of residents speak Spanish at home 322 94.7% Speak English very well18 5.3% Speak English less than very well13.3% of residents speak other language at home 913 82.5% Speak English very well193 17.5% Speak English less than very well
English speakers - Born in the United States 87.9% of residents of Cumberland Hill speak English at home.
5.9% of residents speak Spanish at home 155 100.0% Speak English very well6.1% of residents speak other language at home 161 100.0% Speak English very well
English speakers - Native, born elsewhere 52.8% of residents of Cumberland Hill speak English at home.
38.9% of residents speak Spanish at home 14 100.0% Speak English very well
English speakers - Foreign-born 13.4% of residents of Cumberland Hill speak English at home.
15.9% of residents speak Spanish at home 132 89.2% Speak English very well16 10.8% Speak English less than very well62.0% of residents speak other language at home 421 73.0% Speak English very well156 27.0% Speak English less than very well
White (Caucasian) - Speak only English Native:
96.2% (6,006)Foreign-born:
27.5% (63)
White (Caucasian) - Speak another language Native:
4.8% (297)Foreign-born:
70.7% (163)
Asian - Speak only English Native:
23.8% (34)Foreign-born:
3.1% (12)
Asian - Speak another language Native:
69.7% (99)Foreign-born:
100.0% (395)
Two or more races - Speak another language Native:
13.3% (57)Foreign-born:
97.2% (25)
White alone - Speak only English Native:
94.1% (6,030)Foreign-born:
21.3% (40)
White alone - Speak another language Native:
5.8% (371)Foreign-born:
78.2% (147)
Hispanic or Latino - Speak only English Native:
67.7% (363)Foreign-born:
23.1% (54)
Hispanic or Latino - Speak another language Native:
36.7% (197)Foreign-born:
77.9% (180)
Foreign-born residents in Cumberland Hill 933 residents are foreign born (4.2% Asia , 2.6% Latin America , 1.9% Europe ).
This city:
10.5%Rhode Island:
14.4%
Marital status for residents in Cumberland Hill Marital status - White (Caucasian) population 15 years and over
Males 35.6% Never married57.2% Now married0.0% Separated0.7% Widowed6.5% DivorcedFemales 19.8% Never married57.9% Now married0.8% Separated8.8% Widowed12.8% DivorcedWomen who gave birth in the past 12 months Now married:
32.8% (35)Unmarried:
67.2% (71)
Women who did not give birth in the past 12 months Now married:
55.5% (751)Unmarried:
44.5% (602)
Marital status - Black or African American population 15 years and over
Males 0.0% Never married100.0% Now married0.0% Separated0.0% Widowed0.0% DivorcedFemales 15.0% Never married64.6% Now married0.0% Separated0.0% Widowed20.4% DivorcedWomen who gave birth in the past 12 months Now married:
100.0% (59)Unmarried:
0.0% (0)
Women who did not give birth in the past 12 months Now married:
0.0% (0)Unmarried:
100.0% (17)
Marital status - Asian population 15 years and over
Males 5.9% Never married94.1% Now married0.0% Separated0.0% Widowed0.0% DivorcedFemales 8.7% Never married91.3% Now married0.0% Separated0.0% Widowed0.0% DivorcedWomen who did not give birth in the past 12 months Now married:
89.7% (150)Unmarried:
10.3% (17)
Marital status - Other race population 15 years and over
Males 75.8% Never married24.2% Now married0.0% Separated0.0% Widowed0.0% DivorcedFemales 100.0% Never married0.0% Now married0.0% Separated0.0% Widowed0.0% DivorcedWomen who did not give birth in the past 12 months Now married:
0.0% (0)Unmarried:
100.0% (142)
Marital status - Two or more races population 15 years and over
Males 42.9% Never married30.6% Now married0.0% Separated0.0% Widowed26.5% DivorcedFemales 68.7% Never married17.4% Now married0.0% Separated0.0% Widowed13.9% DivorcedWomen who did not give birth in the past 12 months Now married:
20.2% (28)Unmarried:
79.8% (110)
Marital status - White alone, not Hispanic / Latino population 15 years and over
Males 36.1% Never married56.5% Now married0.0% Separated0.7% Widowed6.7% DivorcedFemales 18.5% Never married58.3% Now married0.8% Separated9.1% Widowed13.2% DivorcedWomen who gave birth in the past 12 months Now married:
32.8% (38)Unmarried:
67.2% (78)
Women who did not give birth in the past 12 months Now married:
58.2% (818)Unmarried:
41.8% (588)
Marital status - Hispanic or Latino population 15 years and over
Males 53.1% Never married46.9% Now married0.0% Separated0.0% Widowed0.0% DivorcedFemales 63.5% Never married36.5% Now married0.0% Separated0.0% Widowed0.0% DivorcedWomen who gave birth in the past 12 months Now married:
100.0% (61)Unmarried:
0.0% (0)
Women who did not give birth in the past 12 months Now married:
7.0% (21)Unmarried:
93.0% (272)
Ancestries in Cumberland Hill
638 15.1% Irish564 13.3% French Canadian458 10.8% French370 8.7% Polish360 8.5% Portuguese297 7.0% English163 3.8% Italian72 1.7% Canadian56 1.3% African52 1.2% American46 1.1% Nigerian37 0.9% Scottish37 0.9% Cape Verdean35 0.8% European34 0.8% Lebanese21 0.5% Greek20 0.5% Armenian15 0.4% Czech12 0.3% Swedish
Children Nativity (place of birth) in Cumberland Hill
Children under 6 years - Living with two parents Both parents native 295 99.4% Native2 0.6% Foreign-bornBoth parents foreign-born 187 83.9% Native36 16.1% Foreign-bornChildren under 6 years - Living with one parent Native parent 103 100.0% NativeChildren 6 to 17 years - Living with two parents Both parents native 750 100.0% NativeBoth parents foreign-born 74 100.0% NativeOne native, one foreign-born parent 46 100.0% NativeChildren 6 to 17 years - Living with one parent Native parent 176 100.0% NativeForeign-born parent 95 60.9% Native61 39.1% Foreign-born
Grandparents responsible for own grandchildren in Cumberland Hill
Grandparents (30 to 59 years) White / Caucasian 17 100.0% Responsible for grandchildrenWhite alone, not Hispanic / Latino 27 100.0% Responsible for grandchildren
Grandparents (60 years and over) White / Caucasian 28 100.0% Not responsible for grandchildrenWhite alone, not Hispanic / Latino 30 100.0% Not responsible for grandchildren