Races in Dalhart, Texas (TX) Detailed Stats
Data:
Races - White alone (%)
Races - White alone (% change since 2000)
Races - Black alone (%)
Races - Black alone (% change since 2000)
Races - American Indian alone (%)
Races - American Indian alone (% change since 2000)
Races - Asian alone (%)
Races - Asian alone (% change since 2000)
Races - Hispanic (%)
Races - Hispanic (% change since 2000)
Races - Native Hawaiian and Other Pacific Islander alone (%)
Races - Native Hawaiian and Other Pacific Islander alone (% change since 2000)
Races - Two or more races(%)
Races - Two or more races(% change since 2000)
Races - Other race alone (%)
Races - Other race alone (% change since 2000)
Racial diversity
Place of birth - Born in state of residence (%)
Place of birth - Born in state of residence (%) - White
Place of birth - Born in state of residence (%) - Black or African American
Place of birth - Born in state of residence (%) - Asian
Place of birth - Born in state of residence (%) - Hispanic or Latino
Place of birth - Born in state of residence (%) - American Indian and Alaska Native
Place of birth - Born in state of residence (%) - Multirace
Place of birth - Born in state of residence (%) - Other Race
Place of birth - Born in other state (%)
Place of birth - Born in other state (%) - White
Place of birth - Born in other state (%) - Black or African American
Place of birth - Born in other state (%) - Asian
Place of birth - Born in other state (%) - Hispanic or Latino
Place of birth - Born in other state (%) - American Indian and Alaska Native
Place of birth - Born in other state (%) - Multirace
Place of birth - Born in other state (%) - Other Race
Place of birth - Native, outside of US (%)
Place of birth - Native, outside of US (%) - White
Place of birth - Native, outside of US (%) - Black or African American
Place of birth - Native, outside of US (%) - Asian
Place of birth - Native, outside of US (%) - Hispanic or Latino
Place of birth - Native, outside of US (%) - American Indian and Alaska Native
Place of birth - Native, outside of US (%) - Multirace
Place of birth - Native, outside of US (%) - Other Race
Place of birth - Foreign born (%)
Place of birth - Foreign born (%) - White
Place of birth - Foreign born (%) - Black or African American
Place of birth - Foreign born (%) - Asian
Place of birth - Foreign born (%) - Hispanic or Latino
Place of birth - Foreign born (%) - American Indian and Alaska Native
Place of birth - Foreign born (%) - Multirace
Place of birth - Foreign born (%) - Other Race
Residents speaking English at home (%)
Residents speaking English at home - Born in the United States (%)
Residents speaking English at home - Native, born elsewhere (%)
Residents speaking English at home - Foreign born (%)
Residents speaking Spanish at home (%)
Residents speaking Spanish at home - Born in the United States (%)
Residents speaking Spanish at home - Native, born elsewhere (%)
Residents speaking Spanish at home - Foreign born (%)
Residents speaking other language at home (%)
Residents speaking other language at home - Born in the United States (%)
Residents speaking other language at home - Native, born elsewhere (%)
Residents speaking other language at home - Foreign born (%)
Marital status - Never married (%)
Marital status - Now married (%)
Marital status - Separated (%)
Marital status - Widowed (%)
Marital status - Divorced (%)
Ancestries Reported - Arab (%)
Ancestries Reported - Czech (%)
Ancestries Reported - Danish (%)
Ancestries Reported - Dutch (%)
Ancestries Reported - English (%)
Ancestries Reported - French (%)
Ancestries Reported - French Canadian (%)
Ancestries Reported - German (%)
Ancestries Reported - Greek (%)
Ancestries Reported - Hungarian (%)
Ancestries Reported - Irish (%)
Ancestries Reported - Italian (%)
Ancestries Reported - Lithuanian (%)
Ancestries Reported - Norwegian (%)
Ancestries Reported - Polish (%)
Ancestries Reported - Portuguese (%)
Ancestries Reported - Russian (%)
Ancestries Reported - Scotch-Irish (%)
Ancestries Reported - Scottish (%)
Ancestries Reported - Slovak (%)
Ancestries Reported - Subsaharan African (%)
Ancestries Reported - Swedish (%)
Ancestries Reported - Swiss (%)
Ancestries Reported - Ukrainian (%)
Ancestries Reported - United States (%)
Ancestries Reported - Welsh (%)
Ancestries Reported - West Indian (%)
Ancestries Reported - Other (%)
Geographical mobility - Same house 1 year ago (%)
Geographical mobility - Same house 1 year ago (%) - White
Geographical mobility - Same house 1 year ago (%) - Black or African American
Geographical mobility - Same house 1 year ago (%) - Asian
Geographical mobility - Same house 1 year ago (%) - Hispanic or Latino
Geographical mobility - Same house 1 year ago (%) - American Indian and Alaska Native
Geographical mobility - Same house 1 year ago (%) - Multirace
Geographical mobility - Same house 1 year ago (%) - Other Race
Geographical mobility - Moved within same county (%)
Geographical mobility - Moved within same county (%) - White
Geographical mobility - Moved within same county (%) - Black or African American
Geographical mobility - Moved within same county (%) - Asian
Geographical mobility - Moved within same county (%) - Hispanic or Latino
Geographical mobility - Moved within same county (%) - American Indian and Alaska Native
Geographical mobility - Moved within same county (%) - Multirace
Geographical mobility - Moved within same county (%) - Other Race
Geographical mobility - Moved from different county within same state (%)
Geographical mobility - Moved from different county within same state (%) - White
Geographical mobility - Moved from different county within same state (%) - Black or African American
Geographical mobility - Moved from different county within same state (%) - Asian
Geographical mobility - Moved from different county within same state (%) - Hispanic or Latino
Geographical mobility - Moved from different county within same state (%) - American Indian and Alaska Native
Geographical mobility - Moved from different county within same state (%) - Multirace
Geographical mobility - Moved from different county within same state (%) - Other Race
Geographical mobility - Moved from different state (%)
Geographical mobility - Moved from different state (%) - White
Geographical mobility - Moved from different state (%) - Black or African American
Geographical mobility - Moved from different state (%) - Asian
Geographical mobility - Moved from different state (%) - Hispanic or Latino
Geographical mobility - Moved from different state (%) - American Indian and Alaska Native
Geographical mobility - Moved from different state (%) - Multirace
Geographical mobility - Moved from different state (%) - Other Race
Geographical mobility - Moved from abroad (%)
Geographical mobility - Moved from abroad (%) - White
Geographical mobility - Moved from abroad (%) - Black or African American
Geographical mobility - Moved from abroad (%) - Asian
Geographical mobility - Moved from abroad (%) - Hispanic or Latino
Geographical mobility - Moved from abroad (%) - American Indian and Alaska Native
Geographical mobility - Moved from abroad (%) - Multirace
Geographical mobility - Moved from abroad (%) - Other Race
Place of birth for the foreign-born population - Ireland (%)
Place of birth for the foreign-born population - Denmark (%)
Place of birth for the foreign-born population - Norway (%)
Place of birth for the foreign-born population - Sweden (%)
Place of birth for the foreign-born population - United Kingdom (%)
Place of birth for the foreign-born population - England (%)
Place of birth for the foreign-born population - Scotland (%)
Place of birth for the foreign-born population - Other Northern Europe (%)
Place of birth for the foreign-born population - Austria (%)
Place of birth for the foreign-born population - Belgium (%)
Place of birth for the foreign-born population - France (%)
Place of birth for the foreign-born population - Germany (%)
Place of birth for the foreign-born population - Netherlands (%)
Place of birth for the foreign-born population - Switzerland (%)
Place of birth for the foreign-born population - Other Western Europe (%)
Place of birth for the foreign-born population - Greece (%)
Place of birth for the foreign-born population - Italy (%)
Place of birth for the foreign-born population - Portugal (%)
Place of birth for the foreign-born population - Spain (%)
Place of birth for the foreign-born population - Other Southern Europe (%)
Place of birth for the foreign-born population - Albania (%)
Place of birth for the foreign-born population - Belarus (%)
Place of birth for the foreign-born population - Bosnia and Herzegovina (%)
Place of birth for the foreign-born population - Bulgaria (%)
Place of birth for the foreign-born population - Croatia (%)
Place of birth for the foreign-born population - Czechoslovakia (%)
Place of birth for the foreign-born population - Hungary (%)
Place of birth for the foreign-born population - Latvia (%)
Place of birth for the foreign-born population - Lithuania (%)
Place of birth for the foreign-born population - North Macedonia (Macedonia) (%)
Place of birth for the foreign-born population - Moldova (%)
Place of birth for the foreign-born population - Poland (%)
Place of birth for the foreign-born population - Romania (%)
Place of birth for the foreign-born population - Russia (%)
Place of birth for the foreign-born population - Serbia (%)
Place of birth for the foreign-born population - Ukraine (%)
Place of birth for the foreign-born population - Other Eastern Europe (%)
Place of birth for the foreign-born population - China (%)
Place of birth for the foreign-born population - Hong Kong (%)
Place of birth for the foreign-born population - Taiwan (%)
Place of birth for the foreign-born population - Japan (%)
Place of birth for the foreign-born population - Korea (%)
Place of birth for the foreign-born population - Other Eastern Asia (%)
Place of birth for the foreign-born population - Afghanistan (%)
Place of birth for the foreign-born population - Bangladesh (%)
Place of birth for the foreign-born population - India (%)
Place of birth for the foreign-born population - Iran (%)
Place of birth for the foreign-born population - Kazakhstan (%)
Place of birth for the foreign-born population - Nepal (%)
Place of birth for the foreign-born population - Pakistan (%)
Place of birth for the foreign-born population - Sri Lanka (%)
Place of birth for the foreign-born population - Uzbekistan (%)
Place of birth for the foreign-born population - Other South Central Asia (%)
Place of birth for the foreign-born population - Burma (%)
Place of birth for the foreign-born population - Cambodia (%)
Place of birth for the foreign-born population - Indonesia (%)
Place of birth for the foreign-born population - Laos (%)
Place of birth for the foreign-born population - Malaysia (%)
Place of birth for the foreign-born population - Philippines (%)
Place of birth for the foreign-born population - Singapore (%)
Place of birth for the foreign-born population - Thailand (%)
Place of birth for the foreign-born population - Vietnam (%)
Place of birth for the foreign-born population - Other South Eastern Asia (%)
Place of birth for the foreign-born population - Armenia (%)
Place of birth for the foreign-born population - Iraq (%)
Place of birth for the foreign-born population - Israel (%)
Place of birth for the foreign-born population - Jordan (%)
Place of birth for the foreign-born population - Kuwait (%)
Place of birth for the foreign-born population - Lebanon (%)
Place of birth for the foreign-born population - Saudi Arabia (%)
Place of birth for the foreign-born population - Syria (%)
Place of birth for the foreign-born population - Turkey (%)
Place of birth for the foreign-born population - Yemen (%)
Place of birth for the foreign-born population - Other Western Asia (%)
Place of birth for the foreign-born population - Eritrea (%)
Place of birth for the foreign-born population - Ethiopia (%)
Place of birth for the foreign-born population - Kenya (%)
Place of birth for the foreign-born population - Somalia (%)
Place of birth for the foreign-born population - Uganda (%)
Place of birth for the foreign-born population - Zimbabwe (%)
Place of birth for the foreign-born population - Other Eastern Africa (%)
Place of birth for the foreign-born population - Cameroon (%)
Place of birth for the foreign-born population - Congo (%)
Place of birth for the foreign-born population - Democratic Republic of Congo (Zaire) (%)
Place of birth for the foreign-born population - Other Middle Africa (%)
Place of birth for the foreign-born population - Egypt (%)
Place of birth for the foreign-born population - Morocco (%)
Place of birth for the foreign-born population - Sudan (%)
Place of birth for the foreign-born population - Other Northern Africa (%)
Place of birth for the foreign-born population - South Africa (%)
Place of birth for the foreign-born population - Other Southern Africa (%)
Place of birth for the foreign-born population - Cabo Verde (%)
Place of birth for the foreign-born population - Ghana (%)
Place of birth for the foreign-born population - Liberia (%)
Place of birth for the foreign-born population - Nigeria (%)
Place of birth for the foreign-born population - Senegal (%)
Place of birth for the foreign-born population - Sierra Leone (%)
Place of birth for the foreign-born population - Other Western Africa (%)
Place of birth for the foreign-born population - Australia (%)
Place of birth for the foreign-born population - New Zealand (%)
Place of birth for the foreign-born population - Fiji (%)
Place of birth for the foreign-born population - Micronesia (%)
Place of birth for the foreign-born population - Bahamas (%)
Place of birth for the foreign-born population - Barbados (%)
Place of birth for the foreign-born population - Cuba (%)
Place of birth for the foreign-born population - Dominica (%)
Place of birth for the foreign-born population - Dominican Republic (%)
Place of birth for the foreign-born population - Grenada (%)
Place of birth for the foreign-born population - Haiti (%)
Place of birth for the foreign-born population - Jamaica (%)
Place of birth for the foreign-born population - St. Vincent and the Grenadines (%)
Place of birth for the foreign-born population - Trinidad and Tobago (%)
Place of birth for the foreign-born population - West Indies (%)
Place of birth for the foreign-born population - Other Caribbean (%)
Place of birth for the foreign-born population - Belize (%)
Place of birth for the foreign-born population - Costa Rica (%)
Place of birth for the foreign-born population - El Salvador (%)
Place of birth for the foreign-born population - Guatemala (%)
Place of birth for the foreign-born population - Honduras (%)
Place of birth for the foreign-born population - Mexico (%)
Place of birth for the foreign-born population - Nicaragua (%)
Place of birth for the foreign-born population - Panama (%)
Place of birth for the foreign-born population - Other Central America (%)
Place of birth for the foreign-born population - Argentina (%)
Place of birth for the foreign-born population - Bolivia (%)
Place of birth for the foreign-born population - Brazil (%)
Place of birth for the foreign-born population - Chile (%)
Place of birth for the foreign-born population - Colombia (%)
Place of birth for the foreign-born population - Ecuador (%)
Place of birth for the foreign-born population - Guyana (%)
Place of birth for the foreign-born population - Peru (%)
Place of birth for the foreign-born population - Uruguay (%)
Place of birth for the foreign-born population - Venezuela (%)
Place of birth for the foreign-born population - Other South America (%)
Place of birth for the foreign-born population - Canada (%)
Place of birth for the foreign-born population - Other Northern America (%)
Place of birth for the foreign-born population - Other (%)
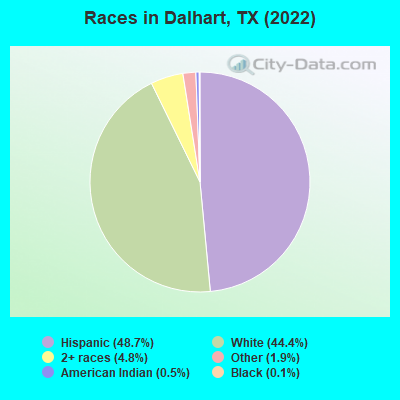
According to 2022 data, the most numerous races in Dalhart, TX are Hispanic (4,009 residents), White alone (3,650 residents), and Black alone (9 residents). 66.3% of Dalhart residents speak English at home. 23.0% of Dalhart, TX residents are foreign-born (21.5% born in Latin America), which is 26.1% greater than the foreign-born rate of 17.0% across the entire state of Texas.
Race distribution in Dalhart
2000 2022
10,933,313 52.4% White alone 6,669,666 32.0% Hispanic 2,364,255 11.3% Black alone 554,445 2.7% Asian alone 230,567 1.1% Two or more races 68,859 0.3% American Indian alone 19,958 0.10% Other race alone 10,757 0.05% Native Hawaiian and Other
12,070,642 40.2% Hispanic 11,683,430 38.9% White alone 3,508,706 11.7% Black alone 1,608,173 5.4% Asian alone 956,560 3.2% Two or more races 125,763 0.4% Other race alone 47,023 0.2% American Indian alone 29,275 0.10% Native Hawaiian and Other
Income and house value in Dalhart Median household income in 2022 $85,401 White non-Hispanic householders$80,958 American Indian and Alaska Native householders$60,477 Some other race householders$43,453 Two or more races householders$60,521 Hispanic or Latino race householdersMedian 2022 house value $198,414 White Non-Hispanic householders$94,295 American Indian or Alaska Native householders$114,782 Some other race householders$105,241 Two or more races householders$116,747 Hispanic or Latino householders
Median age by race in Dalhart
36.8 Median age for White residents40.0 33.5 35.9 Median age for Black or African American residents35.7 -676,245,210.1 22.4 Median age for American Indian / Alaska Native residents51.8 22.1 -681,278,538.1 Median age for Asian residents-683,426,442.5 -679,245,282.3 -581,560,283.1 Median age for Native Hawaiian / Pacific Islander residents-612,729,233.5 -577,777,777.2 36.5 Median age for Other race residents39.7 15.8 27.6 Median age for Two or more races residents26.4 37.5 42.4 Median age for White alone residents44.2 40.2 26.0 Median age for Hispanic or Latino residents26.8 20.9
Owner/renter occupied households by race in Dalhart
House owners and renters - White residents 1,510 81.4% Owner occupied345 18.6% Renter occupiedHouse owners and renters - American Indian / Alaska Native residents 38 57.3% Owner occupied29 42.7% Renter occupiedHouse owners and renters - Other race residents 137 43.2% Owner occupied180 56.8% Renter occupiedHouse owners and renters - Two or more races residents 701 87.7% Owner occupied98 12.3% Renter occupiedHouse owners and renters - White alone residents 1,316 81.3% Owner occupied303 18.7% Renter occupiedHouse owners and renters - Hispanic or Latino residents 819 85.1% Owner occupied144 14.9% Renter occupied
Language usage in Dalhart
English speakers - Total 66.3% of residents of Dalhart speak English at home.
31.3% of residents speak Spanish at home 1,316 55.6% Speak English very well1,053 44.4% Speak English less than very well2.2% of residents speak other language at home 168 99.4% Speak English very well1 0.6% Speak English less than very well
English speakers - Born in the United States 81.0% of residents of Dalhart speak English at home.
18.7% of residents speak Spanish at home 304 75.6% Speak English very well98 24.4% Speak English less than very well
English speakers - Native, born elsewhere 98.4% of residents of Dalhart speak English at home.
English speakers - Foreign-born 16.1% of residents of Dalhart speak English at home.
75.5% of residents speak Spanish at home 443 33.2% Speak English very well892 66.8% Speak English less than very well8.1% of residents speak other language at home 142 99.3% Speak English very well1 0.7% Speak English less than very well
White (Caucasian) - Speak only English Native:
96.6% (3,540)Foreign-born:
16.9% (75)
White (Caucasian) - Speak another language Native:
6.6% (240)Foreign-born:
79.9% (356)
Black or African American - Speak only English Native:
100.0% (6)Foreign-born:
90.7% (3)
American Indian / Alaska Native - Speak another language Native:
75.8% (132)Foreign-born:
98.9% (111)
Other race - Speak another language Native:
68.6% (579)Foreign-born:
99.5% (280)
Two or more races - Speak only English Native:
86.7% (978)Foreign-born:
37.3% (290)
Two or more races - Speak another language Native:
7.5% (85)Foreign-born:
61.0% (474)
White alone - Speak only English Native:
99.4% (3,307)Foreign-born:
17.2% (23)
White alone - Speak another language Native:
0.8% (25)Foreign-born:
82.7% (112)
Hispanic or Latino - Speak only English Native:
48.1% (961)Foreign-born:
13.6% (209)
Hispanic or Latino - Speak another language Native:
52.1% (1,041)Foreign-born:
87.0% (1,339)
Foreign-born residents in Dalhart 1,894 residents are foreign born (21.5% Latin America ).
This city:
23.0%Texas:
17.1%
Marital status for residents in Dalhart Marital status - White (Caucasian) population 15 years and over
Males 17.7% Never married68.6% Now married0.7% Separated2.8% Widowed10.2% DivorcedFemales 14.6% Never married68.1% Now married1.7% Separated9.0% Widowed6.6% DivorcedWomen who gave birth in the past 12 months Now married:
82.6% (77)Unmarried:
17.4% (16)
Women who did not give birth in the past 12 months Now married:
65.0% (557)Unmarried:
35.0% (300)
Marital status - American Indian / Alaska Native population 15 years and over
Males 31.6% Never married31.6% Now married0.0% Separated0.0% Widowed36.8% DivorcedFemales 71.4% Never married10.5% Now married0.0% Separated0.0% Widowed18.0% DivorcedWomen who did not give birth in the past 12 months Now married:
0.0% (0)Unmarried:
100.0% (136)
Marital status - Other race population 15 years and over
Males 40.0% Never married55.1% Now married0.0% Separated0.0% Widowed4.9% DivorcedFemales 44.7% Never married55.3% Now married0.0% Separated0.0% Widowed0.0% DivorcedWomen who did not give birth in the past 12 months Now married:
45.0% (81)Unmarried:
55.0% (99)
Marital status - Two or more races population 15 years and over
Males 17.9% Never married76.6% Now married0.0% Separated5.5% Widowed0.0% DivorcedFemales 6.0% Never married72.2% Now married0.0% Separated0.3% Widowed21.6% DivorcedWomen who did not give birth in the past 12 months Now married:
64.3% (323)Unmarried:
35.7% (179)
Marital status - White alone, not Hispanic / Latino population 15 years and over
Males 17.8% Never married61.9% Now married1.1% Separated4.2% Widowed15.0% DivorcedFemales 12.8% Never married65.7% Now married2.2% Separated10.1% Widowed9.2% DivorcedWomen who gave birth in the past 12 months Now married:
100.0% (30)Unmarried:
0.0% (0)
Women who did not give birth in the past 12 months Now married:
60.9% (426)Unmarried:
39.1% (274)
Marital status - Hispanic or Latino population 15 years and over
Males 21.5% Never married75.0% Now married0.0% Separated1.4% Widowed2.1% DivorcedFemales 27.2% Never married66.3% Now married0.3% Separated3.4% Widowed2.8% DivorcedWomen who gave birth in the past 12 months Now married:
76.5% (68)Unmarried:
23.5% (21)
Women who did not give birth in the past 12 months Now married:
61.6% (531)Unmarried:
38.4% (331)
Ancestries in Dalhart
352 8.1% American329 7.6% German245 5.7% English129 3.0% South African128 3.0% European69 1.6% Irish59 1.4% Norwegian55 1.3% Brazilian38 0.9% Pennsylvania German22 0.5% Scottish20 0.5% Welsh19 0.4% Dutch15 0.3% Celtic13 0.3% Scotch-Irish10 0.2% Dutch West Indian4 0.09% British3 0.07% Slovak1 0.02% Italian
Children Nativity (place of birth) in Dalhart
Children under 6 years - Living with two parents Both parents native 160 100.0% NativeBoth parents foreign-born 136 100.0% NativeOne native, one foreign-born parent 28 100.0% NativeChildren under 6 years - Living with one parent Native parent 220 100.0% NativeChildren 6 to 17 years - Living with two parents Both parents native 703 100.0% Native0 0.0% Foreign-bornBoth parents foreign-born 512 90.0% Native57 10.0% Foreign-bornChildren 6 to 17 years - Living with one parent Native parent 376 100.0% NativeForeign-born parent 64 58.9% Native45 41.1% Foreign-born
Grandparents responsible for own grandchildren in Dalhart
Grandparents (30 to 59 years) White / Caucasian 39 34.4% Responsible for grandchildren75 65.6% Not responsible for grandchildrenWhite alone, not Hispanic / Latino 28 39.1% Responsible for grandchildren44 60.9% Not responsible for grandchildrenHispanic or Latino 27 27.3% Responsible for grandchildren71 72.7% Not responsible for grandchildren
Grandparents (60 years and over)