Races in Edna-Cordele, Texas (TX) Detailed Stats
Ancestries, Foreign-born residents, place of birth
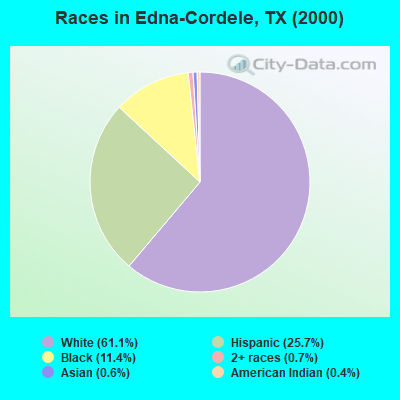
Race distribution in Edna-Cordele

- 4,85961.1%White alone
- 2,04525.7%Hispanic
- 90211.4%Black alone
- 590.7%Two or more races
- 460.6%Asian alone
- 280.4%American Indian alone
- 40.05%Other race alone
- 40.05%Native Hawaiian and Other
Pacific Islander alone
2000
2022
-
- 10,933,31352.4%White alone
- 6,669,66632.0%Hispanic
- 2,364,25511.3%Black alone
- 554,4452.7%Asian alone
- 230,5671.1%Two or more races
- 68,8590.3%American Indian alone
- 19,9580.10%Other race alone
- 10,7570.05%Native Hawaiian and Other
Pacific Islander alone

-
- 12,070,64240.2%Hispanic
- 11,683,43038.9%White alone
- 3,508,70611.7%Black alone
- 1,608,1735.4%Asian alone
- 956,5603.2%Two or more races
- 125,7630.4%Other race alone
- 47,0230.2%American Indian alone
- 29,2750.10%Native Hawaiian and Other
Pacific Islander alone

Income and house value in Edna-Cordele
- Median household income in 2022
- $73,480White non-Hispanic householders
- $36,447Black householders
- $54,466American Indian and Alaska Native householders
- $121,970Asian householders
- $42,410Some other race householders
- $48,253Two or more races householders
- $44,958Hispanic or Latino race householders
- Median 2022 house value
- $179,763White Non-Hispanic householders
- $93,613Black or African American householders
- $139,954American Indian or Alaska Native householders
- $295,459Asian householders
- $112,274Some other race householders
- $158,926Two or more races householders
- $113,829Hispanic or Latino householders
Household income for White non-Hispanic householders

Household income for Black householders

Household income for American Indian and Alaska Native householders

Household income for Asian householders

Household income for Two or more races householders

Household income for Hispanic or Latino race householders

Zip code: 77957