Races in Freeport, Illinois (IL) Detailed Stats
Data:
Races - White alone (%)
Races - White alone (% change since 2000)
Races - Black alone (%)
Races - Black alone (% change since 2000)
Races - American Indian alone (%)
Races - American Indian alone (% change since 2000)
Races - Asian alone (%)
Races - Asian alone (% change since 2000)
Races - Hispanic (%)
Races - Hispanic (% change since 2000)
Races - Native Hawaiian and Other Pacific Islander alone (%)
Races - Native Hawaiian and Other Pacific Islander alone (% change since 2000)
Races - Two or more races(%)
Races - Two or more races(% change since 2000)
Races - Other race alone (%)
Races - Other race alone (% change since 2000)
Racial diversity
Place of birth - Born in state of residence (%)
Place of birth - Born in state of residence (%) - White
Place of birth - Born in state of residence (%) - Black or African American
Place of birth - Born in state of residence (%) - Asian
Place of birth - Born in state of residence (%) - Hispanic or Latino
Place of birth - Born in state of residence (%) - American Indian and Alaska Native
Place of birth - Born in state of residence (%) - Multirace
Place of birth - Born in state of residence (%) - Other Race
Place of birth - Born in other state (%)
Place of birth - Born in other state (%) - White
Place of birth - Born in other state (%) - Black or African American
Place of birth - Born in other state (%) - Asian
Place of birth - Born in other state (%) - Hispanic or Latino
Place of birth - Born in other state (%) - American Indian and Alaska Native
Place of birth - Born in other state (%) - Multirace
Place of birth - Born in other state (%) - Other Race
Place of birth - Native, outside of US (%)
Place of birth - Native, outside of US (%) - White
Place of birth - Native, outside of US (%) - Black or African American
Place of birth - Native, outside of US (%) - Asian
Place of birth - Native, outside of US (%) - Hispanic or Latino
Place of birth - Native, outside of US (%) - American Indian and Alaska Native
Place of birth - Native, outside of US (%) - Multirace
Place of birth - Native, outside of US (%) - Other Race
Place of birth - Foreign born (%)
Place of birth - Foreign born (%) - White
Place of birth - Foreign born (%) - Black or African American
Place of birth - Foreign born (%) - Asian
Place of birth - Foreign born (%) - Hispanic or Latino
Place of birth - Foreign born (%) - American Indian and Alaska Native
Place of birth - Foreign born (%) - Multirace
Place of birth - Foreign born (%) - Other Race
Residents speaking English at home (%)
Residents speaking English at home - Born in the United States (%)
Residents speaking English at home - Native, born elsewhere (%)
Residents speaking English at home - Foreign born (%)
Residents speaking Spanish at home (%)
Residents speaking Spanish at home - Born in the United States (%)
Residents speaking Spanish at home - Native, born elsewhere (%)
Residents speaking Spanish at home - Foreign born (%)
Residents speaking other language at home (%)
Residents speaking other language at home - Born in the United States (%)
Residents speaking other language at home - Native, born elsewhere (%)
Residents speaking other language at home - Foreign born (%)
Marital status - Never married (%)
Marital status - Now married (%)
Marital status - Separated (%)
Marital status - Widowed (%)
Marital status - Divorced (%)
Ancestries Reported - Arab (%)
Ancestries Reported - Czech (%)
Ancestries Reported - Danish (%)
Ancestries Reported - Dutch (%)
Ancestries Reported - English (%)
Ancestries Reported - French (%)
Ancestries Reported - French Canadian (%)
Ancestries Reported - German (%)
Ancestries Reported - Greek (%)
Ancestries Reported - Hungarian (%)
Ancestries Reported - Irish (%)
Ancestries Reported - Italian (%)
Ancestries Reported - Lithuanian (%)
Ancestries Reported - Norwegian (%)
Ancestries Reported - Polish (%)
Ancestries Reported - Portuguese (%)
Ancestries Reported - Russian (%)
Ancestries Reported - Scotch-Irish (%)
Ancestries Reported - Scottish (%)
Ancestries Reported - Slovak (%)
Ancestries Reported - Subsaharan African (%)
Ancestries Reported - Swedish (%)
Ancestries Reported - Swiss (%)
Ancestries Reported - Ukrainian (%)
Ancestries Reported - United States (%)
Ancestries Reported - Welsh (%)
Ancestries Reported - West Indian (%)
Ancestries Reported - Other (%)
Geographical mobility - Same house 1 year ago (%)
Geographical mobility - Same house 1 year ago (%) - White
Geographical mobility - Same house 1 year ago (%) - Black or African American
Geographical mobility - Same house 1 year ago (%) - Asian
Geographical mobility - Same house 1 year ago (%) - Hispanic or Latino
Geographical mobility - Same house 1 year ago (%) - American Indian and Alaska Native
Geographical mobility - Same house 1 year ago (%) - Multirace
Geographical mobility - Same house 1 year ago (%) - Other Race
Geographical mobility - Moved within same county (%)
Geographical mobility - Moved within same county (%) - White
Geographical mobility - Moved within same county (%) - Black or African American
Geographical mobility - Moved within same county (%) - Asian
Geographical mobility - Moved within same county (%) - Hispanic or Latino
Geographical mobility - Moved within same county (%) - American Indian and Alaska Native
Geographical mobility - Moved within same county (%) - Multirace
Geographical mobility - Moved within same county (%) - Other Race
Geographical mobility - Moved from different county within same state (%)
Geographical mobility - Moved from different county within same state (%) - White
Geographical mobility - Moved from different county within same state (%) - Black or African American
Geographical mobility - Moved from different county within same state (%) - Asian
Geographical mobility - Moved from different county within same state (%) - Hispanic or Latino
Geographical mobility - Moved from different county within same state (%) - American Indian and Alaska Native
Geographical mobility - Moved from different county within same state (%) - Multirace
Geographical mobility - Moved from different county within same state (%) - Other Race
Geographical mobility - Moved from different state (%)
Geographical mobility - Moved from different state (%) - White
Geographical mobility - Moved from different state (%) - Black or African American
Geographical mobility - Moved from different state (%) - Asian
Geographical mobility - Moved from different state (%) - Hispanic or Latino
Geographical mobility - Moved from different state (%) - American Indian and Alaska Native
Geographical mobility - Moved from different state (%) - Multirace
Geographical mobility - Moved from different state (%) - Other Race
Geographical mobility - Moved from abroad (%)
Geographical mobility - Moved from abroad (%) - White
Geographical mobility - Moved from abroad (%) - Black or African American
Geographical mobility - Moved from abroad (%) - Asian
Geographical mobility - Moved from abroad (%) - Hispanic or Latino
Geographical mobility - Moved from abroad (%) - American Indian and Alaska Native
Geographical mobility - Moved from abroad (%) - Multirace
Geographical mobility - Moved from abroad (%) - Other Race
Place of birth for the foreign-born population - Ireland (%)
Place of birth for the foreign-born population - Denmark (%)
Place of birth for the foreign-born population - Norway (%)
Place of birth for the foreign-born population - Sweden (%)
Place of birth for the foreign-born population - United Kingdom (%)
Place of birth for the foreign-born population - England (%)
Place of birth for the foreign-born population - Scotland (%)
Place of birth for the foreign-born population - Other Northern Europe (%)
Place of birth for the foreign-born population - Austria (%)
Place of birth for the foreign-born population - Belgium (%)
Place of birth for the foreign-born population - France (%)
Place of birth for the foreign-born population - Germany (%)
Place of birth for the foreign-born population - Netherlands (%)
Place of birth for the foreign-born population - Switzerland (%)
Place of birth for the foreign-born population - Other Western Europe (%)
Place of birth for the foreign-born population - Greece (%)
Place of birth for the foreign-born population - Italy (%)
Place of birth for the foreign-born population - Portugal (%)
Place of birth for the foreign-born population - Spain (%)
Place of birth for the foreign-born population - Other Southern Europe (%)
Place of birth for the foreign-born population - Albania (%)
Place of birth for the foreign-born population - Belarus (%)
Place of birth for the foreign-born population - Bosnia and Herzegovina (%)
Place of birth for the foreign-born population - Bulgaria (%)
Place of birth for the foreign-born population - Croatia (%)
Place of birth for the foreign-born population - Czechoslovakia (%)
Place of birth for the foreign-born population - Hungary (%)
Place of birth for the foreign-born population - Latvia (%)
Place of birth for the foreign-born population - Lithuania (%)
Place of birth for the foreign-born population - North Macedonia (Macedonia) (%)
Place of birth for the foreign-born population - Moldova (%)
Place of birth for the foreign-born population - Poland (%)
Place of birth for the foreign-born population - Romania (%)
Place of birth for the foreign-born population - Russia (%)
Place of birth for the foreign-born population - Serbia (%)
Place of birth for the foreign-born population - Ukraine (%)
Place of birth for the foreign-born population - Other Eastern Europe (%)
Place of birth for the foreign-born population - China (%)
Place of birth for the foreign-born population - Hong Kong (%)
Place of birth for the foreign-born population - Taiwan (%)
Place of birth for the foreign-born population - Japan (%)
Place of birth for the foreign-born population - Korea (%)
Place of birth for the foreign-born population - Other Eastern Asia (%)
Place of birth for the foreign-born population - Afghanistan (%)
Place of birth for the foreign-born population - Bangladesh (%)
Place of birth for the foreign-born population - India (%)
Place of birth for the foreign-born population - Iran (%)
Place of birth for the foreign-born population - Kazakhstan (%)
Place of birth for the foreign-born population - Nepal (%)
Place of birth for the foreign-born population - Pakistan (%)
Place of birth for the foreign-born population - Sri Lanka (%)
Place of birth for the foreign-born population - Uzbekistan (%)
Place of birth for the foreign-born population - Other South Central Asia (%)
Place of birth for the foreign-born population - Burma (%)
Place of birth for the foreign-born population - Cambodia (%)
Place of birth for the foreign-born population - Indonesia (%)
Place of birth for the foreign-born population - Laos (%)
Place of birth for the foreign-born population - Malaysia (%)
Place of birth for the foreign-born population - Philippines (%)
Place of birth for the foreign-born population - Singapore (%)
Place of birth for the foreign-born population - Thailand (%)
Place of birth for the foreign-born population - Vietnam (%)
Place of birth for the foreign-born population - Other South Eastern Asia (%)
Place of birth for the foreign-born population - Armenia (%)
Place of birth for the foreign-born population - Iraq (%)
Place of birth for the foreign-born population - Israel (%)
Place of birth for the foreign-born population - Jordan (%)
Place of birth for the foreign-born population - Kuwait (%)
Place of birth for the foreign-born population - Lebanon (%)
Place of birth for the foreign-born population - Saudi Arabia (%)
Place of birth for the foreign-born population - Syria (%)
Place of birth for the foreign-born population - Turkey (%)
Place of birth for the foreign-born population - Yemen (%)
Place of birth for the foreign-born population - Other Western Asia (%)
Place of birth for the foreign-born population - Eritrea (%)
Place of birth for the foreign-born population - Ethiopia (%)
Place of birth for the foreign-born population - Kenya (%)
Place of birth for the foreign-born population - Somalia (%)
Place of birth for the foreign-born population - Uganda (%)
Place of birth for the foreign-born population - Zimbabwe (%)
Place of birth for the foreign-born population - Other Eastern Africa (%)
Place of birth for the foreign-born population - Cameroon (%)
Place of birth for the foreign-born population - Congo (%)
Place of birth for the foreign-born population - Democratic Republic of Congo (Zaire) (%)
Place of birth for the foreign-born population - Other Middle Africa (%)
Place of birth for the foreign-born population - Egypt (%)
Place of birth for the foreign-born population - Morocco (%)
Place of birth for the foreign-born population - Sudan (%)
Place of birth for the foreign-born population - Other Northern Africa (%)
Place of birth for the foreign-born population - South Africa (%)
Place of birth for the foreign-born population - Other Southern Africa (%)
Place of birth for the foreign-born population - Cabo Verde (%)
Place of birth for the foreign-born population - Ghana (%)
Place of birth for the foreign-born population - Liberia (%)
Place of birth for the foreign-born population - Nigeria (%)
Place of birth for the foreign-born population - Senegal (%)
Place of birth for the foreign-born population - Sierra Leone (%)
Place of birth for the foreign-born population - Other Western Africa (%)
Place of birth for the foreign-born population - Australia (%)
Place of birth for the foreign-born population - New Zealand (%)
Place of birth for the foreign-born population - Fiji (%)
Place of birth for the foreign-born population - Micronesia (%)
Place of birth for the foreign-born population - Bahamas (%)
Place of birth for the foreign-born population - Barbados (%)
Place of birth for the foreign-born population - Cuba (%)
Place of birth for the foreign-born population - Dominica (%)
Place of birth for the foreign-born population - Dominican Republic (%)
Place of birth for the foreign-born population - Grenada (%)
Place of birth for the foreign-born population - Haiti (%)
Place of birth for the foreign-born population - Jamaica (%)
Place of birth for the foreign-born population - St. Vincent and the Grenadines (%)
Place of birth for the foreign-born population - Trinidad and Tobago (%)
Place of birth for the foreign-born population - West Indies (%)
Place of birth for the foreign-born population - Other Caribbean (%)
Place of birth for the foreign-born population - Belize (%)
Place of birth for the foreign-born population - Costa Rica (%)
Place of birth for the foreign-born population - El Salvador (%)
Place of birth for the foreign-born population - Guatemala (%)
Place of birth for the foreign-born population - Honduras (%)
Place of birth for the foreign-born population - Mexico (%)
Place of birth for the foreign-born population - Nicaragua (%)
Place of birth for the foreign-born population - Panama (%)
Place of birth for the foreign-born population - Other Central America (%)
Place of birth for the foreign-born population - Argentina (%)
Place of birth for the foreign-born population - Bolivia (%)
Place of birth for the foreign-born population - Brazil (%)
Place of birth for the foreign-born population - Chile (%)
Place of birth for the foreign-born population - Colombia (%)
Place of birth for the foreign-born population - Ecuador (%)
Place of birth for the foreign-born population - Guyana (%)
Place of birth for the foreign-born population - Peru (%)
Place of birth for the foreign-born population - Uruguay (%)
Place of birth for the foreign-born population - Venezuela (%)
Place of birth for the foreign-born population - Other South America (%)
Place of birth for the foreign-born population - Canada (%)
Place of birth for the foreign-born population - Other Northern America (%)
Place of birth for the foreign-born population - Other (%)
Latest news about races in Freeport, IL collected exclusively by city-data.com from local newspapers, TV, and radio stations
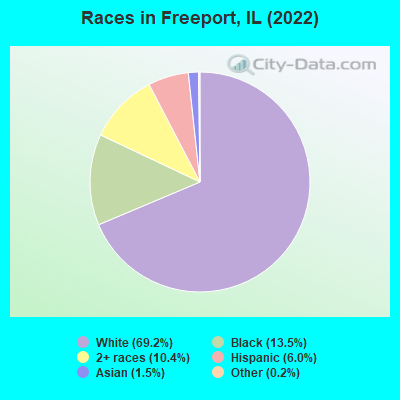
According to 2022 data, the most numerous races in Freeport, IL are White alone (16,302 residents), Hispanic (1,410 residents), and Black alone (3,187 residents). 95.4% of Freeport residents speak English at home. 3.1% of Freeport, IL residents are foreign-born (1.1% born in Latin America, 1.0% born in Asia, 0.7% born in Europe), which is 346.8% less than the foreign-born rate of 14.0% across the entire state of Illinois.
Race distribution in Freeport
2000 2022
8,424,140 67.8% White alone 1,856,152 14.9% Black alone 1,530,262 12.3% Hispanic 419,916 3.4% Asian alone 153,996 1.2% Two or more races 13,479 0.1% Other race alone 18,232 0.1% American Indian alone 3,116 0.03% Native Hawaiian and Other
7,356,301 58.5% White alone 2,299,726 18.3% Hispanic 1,660,423 13.2% Black alone 747,296 5.9% Asian alone 458,599 3.6% Two or more races 45,386 0.4% Other race alone 10,405 0.08% American Indian alone 3,896 0.03% Native Hawaiian and Other
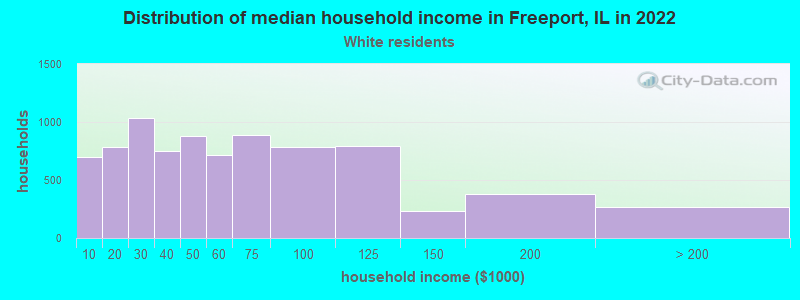
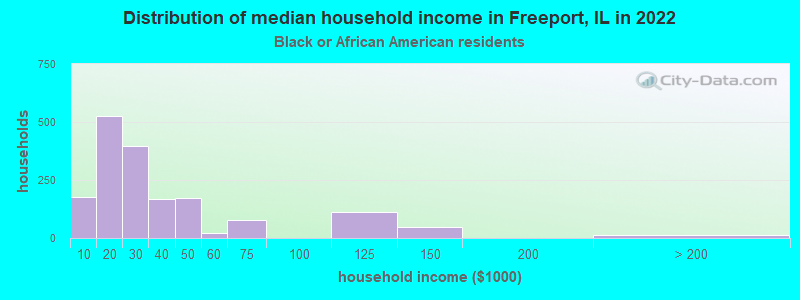
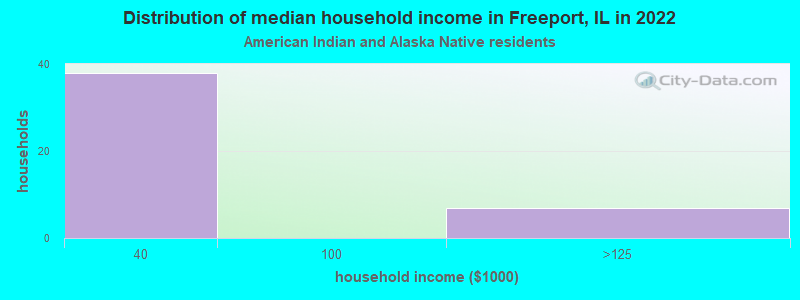
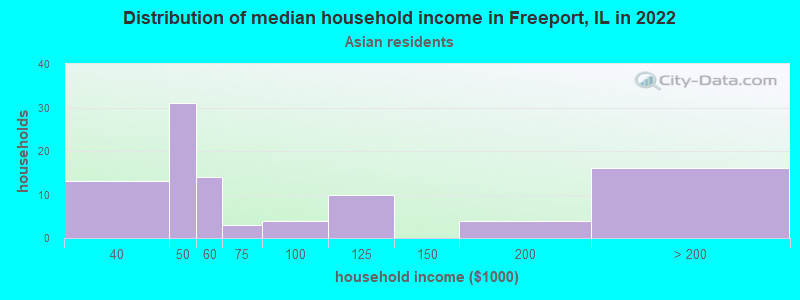
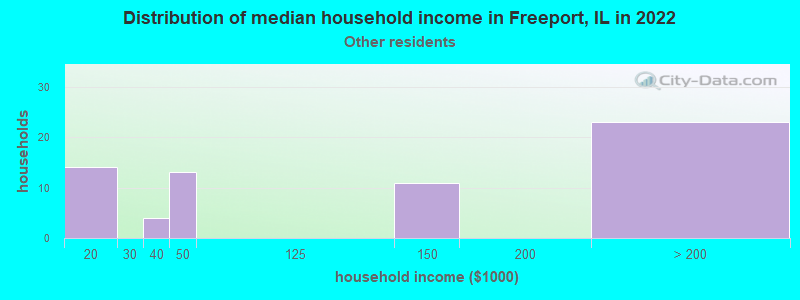
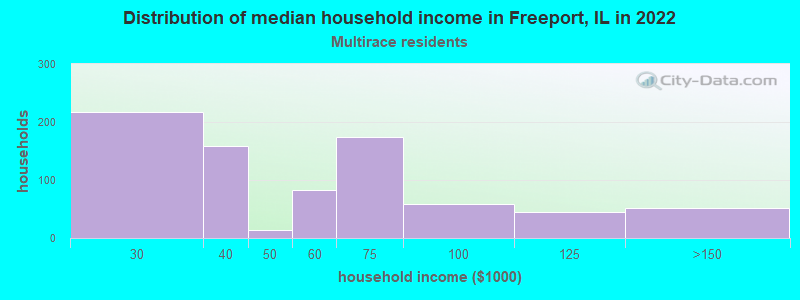
Income and house value in Freeport Median household income in 2022 $48,338 White non-Hispanic householders$24,814 Black householders$49,979 Two or more races householders$45,308 Hispanic or Latino race householdersMedian 2022 house value $92,788 White Non-Hispanic householders$54,011 Black or African American householders$116,080 American Indian or Alaska Native householders $236,063 Asian householders$79,191 Some other race householders$86,997 Two or more races householders$84,479 Hispanic or Latino householders
Median age by race in Freeport
51.7 Median age for White residents50.2 53.0 40.5 Median age for Black or African American residents35.5 44.2 31.8 Median age for American Indian / Alaska Native residents-720,238,094.5 22.5 37.2 Median age for Asian residents13.2 37.6 -593,236,714.4 Median age for Native Hawaiian / Pacific Islander residents-658,536,584.7 -576,015,108.0 36.0 Median age for Other race residents27.8 42.8 13.0 Median age for Two or more races residents12.3 13.5 51.6 Median age for White alone residents50.4 52.1 26.6 Median age for Hispanic or Latino residents26.7 26.3
Owner/renter occupied households by race in Freeport
House owners and renters - White residents 5,199 64.0% Owner occupied2,927 36.0% Renter occupiedHouse owners and renters - Black or African American residents 510 29.3% Owner occupied1,231 70.7% Renter occupiedHouse owners and renters - American Indian / Alaska Native residents 20 46.1% Owner occupied24 53.9% Renter occupiedHouse owners and renters - Asian residents 35 41.0% Owner occupied50 59.0% Renter occupiedHouse owners and renters - Other race residents 38 55.9% Owner occupied30 44.1% Renter occupiedHouse owners and renters - Two or more races residents 424 54.2% Owner occupied359 45.8% Renter occupiedHouse owners and renters - White alone residents 5,218 63.3% Owner occupied3,027 36.7% Renter occupiedHouse owners and renters - Hispanic or Latino residents 293 62.9% Owner occupied173 37.1% Renter occupied
Language usage in Freeport
English speakers - Total 95.4% of residents of Freeport speak English at home.
2.6% of residents speak Spanish at home 399 70.5% Speak English very well167 29.5% Speak English less than very well1.5% of residents speak other language at home 268 78.4% Speak English very well74 21.6% Speak English less than very well
English speakers - Born in the United States 98.5% of residents of Freeport speak English at home.
1.0% of residents speak Spanish at home 50 100.0% Speak English very well
English speakers - Native, born elsewhere 28.9% of residents of Freeport speak English at home.
60.8% of residents speak Spanish at home 48 81.4% Speak English very well11 18.6% Speak English less than very well10.3% of residents speak other language at home 10 100.0% Speak English very well
English speakers - Foreign-born 29.5% of residents of Freeport speak English at home.
33.0% of residents speak Spanish at home 155 64.6% Speak English very well85 35.4% Speak English less than very well35.9% of residents speak other language at home 187 71.6% Speak English very well74 28.4% Speak English less than very well
White (Caucasian) - Speak only English Native:
100.0% (15,318)Foreign-born:
60.7% (143)
White (Caucasian) - Speak another language Native:
1.0% (146)Foreign-born:
44.4% (105)
Black or African American - Speak only English Native:
100.0% (3,015)Foreign-born:
100.0% (7)
American Indian / Alaska Native - Speak another language Native:
17.7% (7)Foreign-born:
100.0% (41)
Asian - Speak only English Native:
47.5% (14)Foreign-born:
8.3% (21)
Asian - Speak another language Native:
52.6% (15)Foreign-born:
92.2% (236)
Other race - Speak only English Native:
69.7% (97)Foreign-born:
21.4% (31)
Other race - Speak another language Native:
34.8% (48)Foreign-born:
78.8% (114)
Two or more races - Speak another language Native:
7.0% (192)Foreign-born:
100.0% (10)
White alone - Speak only English Native:
99.1% (15,317)Foreign-born:
75.5% (157)
White alone - Speak another language Native:
0.8% (125)Foreign-born:
19.0% (39)
Hispanic or Latino - Speak only English Native:
77.2% (714)Foreign-born:
9.9% (26)
Hispanic or Latino - Speak another language Native:
24.8% (229)Foreign-born:
90.0% (233)
Foreign-born residents in Freeport 738 residents are foreign born (1.1% Latin America , 1.0% Asia , 0.7% Europe ).
This city:
3.1%Illinois:
14.1%
Marital status for residents in Freeport Marital status - White (Caucasian) population 15 years and over
Males 33.7% Never married47.4% Now married0.9% Separated3.8% Widowed14.2% DivorcedFemales 24.5% Never married42.1% Now married0.5% Separated12.2% Widowed20.7% DivorcedWomen who gave birth in the past 12 months Now married:
66.4% (142)Unmarried:
33.6% (72)
Women who did not give birth in the past 12 months Now married:
41.2% (1,123)Unmarried:
58.8% (1,604)
Marital status - Black or African American population 15 years and over
Males 57.7% Never married31.9% Now married0.0% Separated2.7% Widowed7.7% DivorcedFemales 34.2% Never married28.3% Now married12.9% Separated7.5% Widowed17.0% DivorcedWomen who gave birth in the past 12 months Now married:
59.6% (64)Unmarried:
40.4% (44)
Women who did not give birth in the past 12 months Now married:
34.7% (212)Unmarried:
65.3% (398)
Marital status - American Indian / Alaska Native population 15 years and over
Males 0.0% Never married100.0% Now married0.0% Separated0.0% Widowed0.0% DivorcedFemales 36.4% Never married36.4% Now married0.0% Separated0.0% Widowed27.3% DivorcedWomen who gave birth in the past 12 months Now married:
100.0% (20)Unmarried:
0.0% (0)
Women who did not give birth in the past 12 months Now married:
0.0% (0)Unmarried:
100.0% (20)
Marital status - Asian population 15 years and over
Males 42.4% Never married18.2% Now married0.0% Separated0.0% Widowed39.4% DivorcedFemales 68.4% Never married23.7% Now married7.9% Separated0.0% Widowed0.0% DivorcedWomen who did not give birth in the past 12 months Now married:
18.8% (24)Unmarried:
81.2% (105)
Marital status - Other race population 15 years and over
Males 61.8% Never married31.9% Now married0.0% Separated0.0% Widowed6.2% DivorcedFemales 33.3% Never married58.7% Now married0.0% Separated8.0% Widowed0.0% DivorcedWomen who gave birth in the past 12 months Now married:
16.0% (5)Unmarried:
84.0% (24)
Women who did not give birth in the past 12 months Now married:
100.0% (38)Unmarried:
0.0% (0)
Marital status - Two or more races population 15 years and over
Males 58.5% Never married41.5% Now married0.0% Separated0.0% Widowed0.0% DivorcedFemales 45.1% Never married36.8% Now married10.0% Separated0.4% Widowed7.7% DivorcedWomen who gave birth in the past 12 months Now married:
0.0% (0)Unmarried:
100.0% (62)
Women who did not give birth in the past 12 months Now married:
43.0% (266)Unmarried:
57.0% (353)
Marital status - White alone, not Hispanic / Latino population 15 years and over
Males 32.4% Never married48.3% Now married0.9% Separated4.0% Widowed14.4% DivorcedFemales 24.8% Never married42.2% Now married0.5% Separated12.3% Widowed20.1% DivorcedWomen who gave birth in the past 12 months Now married:
66.4% (151)Unmarried:
33.6% (76)
Women who did not give birth in the past 12 months Now married:
41.0% (1,187)Unmarried:
59.0% (1,709)
Marital status - Hispanic or Latino population 15 years and over
Males 64.4% Never married28.4% Now married0.0% Separated0.0% Widowed7.2% DivorcedFemales 33.0% Never married27.3% Now married17.1% Separated2.4% Widowed20.1% DivorcedWomen who gave birth in the past 12 months Now married:
43.2% (16)Unmarried:
56.8% (21)
Women who did not give birth in the past 12 months Now married:
32.6% (44)Unmarried:
67.4% (90)
Ancestries in Freeport
2,562 26.8% German1,519 15.9% American652 6.8% English449 4.7% Irish172 1.8% African145 1.5% Italian86 0.9% Dutch80 0.8% Norwegian80 0.8% Swiss77 0.8% Swedish67 0.7% European55 0.6% British53 0.6% Polish51 0.5% Scotch-Irish38 0.4% Greek31 0.3% French Canadian28 0.3% Scottish21 0.2% Pennsylvania German13 0.1% Scandinavian9 0.09% Belgian9 0.09% French8 0.08% Ethiopian7 0.07% Czechoslovakian4 0.04% Czech4 0.04% Danish4 0.04% Russian3 0.03% Iraqi1 0.01% Haitian
Geographical mobility in Freeport Same house 1 year ago 13,875 87.2% White (Caucasian)2,580 82.7% Black or African American57 75.3% American Indian / Alaska Native266 73.8% Asian278 98.1% Other race2,682 83.6% Two or more races14,154 87.2% White alone, not Hispanic / Latino1,183 92.2% Hispanic or LatinoMoved within same county 1,448 9.1% White / Caucasian453 14.5% Black or African American19 25.0% American Indian / Alaska Native56 15.4% Asian6 2.1% Other race521 16.2% Two or more races1,496 9.2% White alone, not Hispanic / Latino63 4.9% Hispanic or LatinoMoved within same state 394 2.5% White / Caucasian42 1.4% Black or African American379 2.3% White alone, not Hispanic / Latino32 2.5% Hispanic or LatinoMoved from different state 102 0.6% White / Caucasian2 0.1% Black or African American105 0.6% White alone, not Hispanic / LatinoMoved from abroad 11 0.1% White37 10.4% Asian12 0.1% White alone, not Hispanic / Latino
Children Nativity (place of birth) in Freeport
Children under 6 years - Living with two parents Both parents native 821 100.0% NativeBoth parents foreign-born 13 59.0% Native9 41.0% Foreign-bornOne native, one foreign-born parent 24 100.0% NativeChildren under 6 years - Living with one parent Native parent 754 100.0% NativeForeign-born parent 83 100.0% NativeChildren 6 to 17 years - Living with two parents Both parents native 1,220 99.3% Native8 0.7% Foreign-bornBoth parents foreign-born 13 54.4% Native11 45.6% Foreign-bornOne native, one foreign-born parent 155 100.0% NativeChildren 6 to 17 years - Living with one parent Native parent 1,319 100.0% NativeForeign-born parent 85 56.1% Native66 43.9% Foreign-born
Grandparents responsible for own grandchildren in Freeport
Grandparents (30 to 59 years) White / Caucasian 93 66.7% Responsible for grandchildren47 33.3% Not responsible for grandchildrenBlack or African American 15 100.0% Responsible for grandchildrenAmerican Indian / Alaska Native 8 100.0% Responsible for grandchildrenOther race 4 100.0% Not responsible for grandchildrenWhite alone, not Hispanic / Latino 103 64.2% Responsible for grandchildren57 35.8% Not responsible for grandchildrenHispanic or Latino 4 100.0% Not responsible for grandchildrenGrandparents (60 years and over) White / Caucasian 22 50.8% Responsible for grandchildren21 49.2% Not responsible for grandchildrenBlack or African American 4 36.4% Responsible for grandchildren7 63.6% Not responsible for grandchildrenOther race 5 20.9% Responsible for grandchildren18 79.1% Not responsible for grandchildrenWhite alone, not Hispanic / Latino 23 49.7% Responsible for grandchildren24 50.3% Not responsible for grandchildrenHispanic or Latino 19 100.0% Not responsible for grandchildren