Races in Gages Lake, Illinois (IL) Detailed Stats
Data:
Races - White alone (%)
Races - White alone (% change since 2000)
Races - Black alone (%)
Races - Black alone (% change since 2000)
Races - American Indian alone (%)
Races - American Indian alone (% change since 2000)
Races - Asian alone (%)
Races - Asian alone (% change since 2000)
Races - Hispanic (%)
Races - Hispanic (% change since 2000)
Races - Native Hawaiian and Other Pacific Islander alone (%)
Races - Native Hawaiian and Other Pacific Islander alone (% change since 2000)
Races - Two or more races(%)
Races - Two or more races(% change since 2000)
Races - Other race alone (%)
Races - Other race alone (% change since 2000)
Racial diversity
Place of birth - Born in state of residence (%)
Place of birth - Born in state of residence (%) - White
Place of birth - Born in state of residence (%) - Black or African American
Place of birth - Born in state of residence (%) - Asian
Place of birth - Born in state of residence (%) - Hispanic or Latino
Place of birth - Born in state of residence (%) - American Indian and Alaska Native
Place of birth - Born in state of residence (%) - Multirace
Place of birth - Born in state of residence (%) - Other Race
Place of birth - Born in other state (%)
Place of birth - Born in other state (%) - White
Place of birth - Born in other state (%) - Black or African American
Place of birth - Born in other state (%) - Asian
Place of birth - Born in other state (%) - Hispanic or Latino
Place of birth - Born in other state (%) - American Indian and Alaska Native
Place of birth - Born in other state (%) - Multirace
Place of birth - Born in other state (%) - Other Race
Place of birth - Native, outside of US (%)
Place of birth - Native, outside of US (%) - White
Place of birth - Native, outside of US (%) - Black or African American
Place of birth - Native, outside of US (%) - Asian
Place of birth - Native, outside of US (%) - Hispanic or Latino
Place of birth - Native, outside of US (%) - American Indian and Alaska Native
Place of birth - Native, outside of US (%) - Multirace
Place of birth - Native, outside of US (%) - Other Race
Place of birth - Foreign born (%)
Place of birth - Foreign born (%) - White
Place of birth - Foreign born (%) - Black or African American
Place of birth - Foreign born (%) - Asian
Place of birth - Foreign born (%) - Hispanic or Latino
Place of birth - Foreign born (%) - American Indian and Alaska Native
Place of birth - Foreign born (%) - Multirace
Place of birth - Foreign born (%) - Other Race
Residents speaking English at home (%)
Residents speaking English at home - Born in the United States (%)
Residents speaking English at home - Native, born elsewhere (%)
Residents speaking English at home - Foreign born (%)
Residents speaking Spanish at home (%)
Residents speaking Spanish at home - Born in the United States (%)
Residents speaking Spanish at home - Native, born elsewhere (%)
Residents speaking Spanish at home - Foreign born (%)
Residents speaking other language at home (%)
Residents speaking other language at home - Born in the United States (%)
Residents speaking other language at home - Native, born elsewhere (%)
Residents speaking other language at home - Foreign born (%)
Marital status - Never married (%)
Marital status - Now married (%)
Marital status - Separated (%)
Marital status - Widowed (%)
Marital status - Divorced (%)
Ancestries Reported - Arab (%)
Ancestries Reported - Czech (%)
Ancestries Reported - Danish (%)
Ancestries Reported - Dutch (%)
Ancestries Reported - English (%)
Ancestries Reported - French (%)
Ancestries Reported - French Canadian (%)
Ancestries Reported - German (%)
Ancestries Reported - Greek (%)
Ancestries Reported - Hungarian (%)
Ancestries Reported - Irish (%)
Ancestries Reported - Italian (%)
Ancestries Reported - Lithuanian (%)
Ancestries Reported - Norwegian (%)
Ancestries Reported - Polish (%)
Ancestries Reported - Portuguese (%)
Ancestries Reported - Russian (%)
Ancestries Reported - Scotch-Irish (%)
Ancestries Reported - Scottish (%)
Ancestries Reported - Slovak (%)
Ancestries Reported - Subsaharan African (%)
Ancestries Reported - Swedish (%)
Ancestries Reported - Swiss (%)
Ancestries Reported - Ukrainian (%)
Ancestries Reported - United States (%)
Ancestries Reported - Welsh (%)
Ancestries Reported - West Indian (%)
Ancestries Reported - Other (%)
Geographical mobility - Same house 1 year ago (%)
Geographical mobility - Same house 1 year ago (%) - White
Geographical mobility - Same house 1 year ago (%) - Black or African American
Geographical mobility - Same house 1 year ago (%) - Asian
Geographical mobility - Same house 1 year ago (%) - Hispanic or Latino
Geographical mobility - Same house 1 year ago (%) - American Indian and Alaska Native
Geographical mobility - Same house 1 year ago (%) - Multirace
Geographical mobility - Same house 1 year ago (%) - Other Race
Geographical mobility - Moved within same county (%)
Geographical mobility - Moved within same county (%) - White
Geographical mobility - Moved within same county (%) - Black or African American
Geographical mobility - Moved within same county (%) - Asian
Geographical mobility - Moved within same county (%) - Hispanic or Latino
Geographical mobility - Moved within same county (%) - American Indian and Alaska Native
Geographical mobility - Moved within same county (%) - Multirace
Geographical mobility - Moved within same county (%) - Other Race
Geographical mobility - Moved from different county within same state (%)
Geographical mobility - Moved from different county within same state (%) - White
Geographical mobility - Moved from different county within same state (%) - Black or African American
Geographical mobility - Moved from different county within same state (%) - Asian
Geographical mobility - Moved from different county within same state (%) - Hispanic or Latino
Geographical mobility - Moved from different county within same state (%) - American Indian and Alaska Native
Geographical mobility - Moved from different county within same state (%) - Multirace
Geographical mobility - Moved from different county within same state (%) - Other Race
Geographical mobility - Moved from different state (%)
Geographical mobility - Moved from different state (%) - White
Geographical mobility - Moved from different state (%) - Black or African American
Geographical mobility - Moved from different state (%) - Asian
Geographical mobility - Moved from different state (%) - Hispanic or Latino
Geographical mobility - Moved from different state (%) - American Indian and Alaska Native
Geographical mobility - Moved from different state (%) - Multirace
Geographical mobility - Moved from different state (%) - Other Race
Geographical mobility - Moved from abroad (%)
Geographical mobility - Moved from abroad (%) - White
Geographical mobility - Moved from abroad (%) - Black or African American
Geographical mobility - Moved from abroad (%) - Asian
Geographical mobility - Moved from abroad (%) - Hispanic or Latino
Geographical mobility - Moved from abroad (%) - American Indian and Alaska Native
Geographical mobility - Moved from abroad (%) - Multirace
Geographical mobility - Moved from abroad (%) - Other Race
Place of birth for the foreign-born population - Ireland (%)
Place of birth for the foreign-born population - Denmark (%)
Place of birth for the foreign-born population - Norway (%)
Place of birth for the foreign-born population - Sweden (%)
Place of birth for the foreign-born population - United Kingdom (%)
Place of birth for the foreign-born population - England (%)
Place of birth for the foreign-born population - Scotland (%)
Place of birth for the foreign-born population - Other Northern Europe (%)
Place of birth for the foreign-born population - Austria (%)
Place of birth for the foreign-born population - Belgium (%)
Place of birth for the foreign-born population - France (%)
Place of birth for the foreign-born population - Germany (%)
Place of birth for the foreign-born population - Netherlands (%)
Place of birth for the foreign-born population - Switzerland (%)
Place of birth for the foreign-born population - Other Western Europe (%)
Place of birth for the foreign-born population - Greece (%)
Place of birth for the foreign-born population - Italy (%)
Place of birth for the foreign-born population - Portugal (%)
Place of birth for the foreign-born population - Spain (%)
Place of birth for the foreign-born population - Other Southern Europe (%)
Place of birth for the foreign-born population - Albania (%)
Place of birth for the foreign-born population - Belarus (%)
Place of birth for the foreign-born population - Bosnia and Herzegovina (%)
Place of birth for the foreign-born population - Bulgaria (%)
Place of birth for the foreign-born population - Croatia (%)
Place of birth for the foreign-born population - Czechoslovakia (%)
Place of birth for the foreign-born population - Hungary (%)
Place of birth for the foreign-born population - Latvia (%)
Place of birth for the foreign-born population - Lithuania (%)
Place of birth for the foreign-born population - North Macedonia (Macedonia) (%)
Place of birth for the foreign-born population - Moldova (%)
Place of birth for the foreign-born population - Poland (%)
Place of birth for the foreign-born population - Romania (%)
Place of birth for the foreign-born population - Russia (%)
Place of birth for the foreign-born population - Serbia (%)
Place of birth for the foreign-born population - Ukraine (%)
Place of birth for the foreign-born population - Other Eastern Europe (%)
Place of birth for the foreign-born population - China (%)
Place of birth for the foreign-born population - Hong Kong (%)
Place of birth for the foreign-born population - Taiwan (%)
Place of birth for the foreign-born population - Japan (%)
Place of birth for the foreign-born population - Korea (%)
Place of birth for the foreign-born population - Other Eastern Asia (%)
Place of birth for the foreign-born population - Afghanistan (%)
Place of birth for the foreign-born population - Bangladesh (%)
Place of birth for the foreign-born population - India (%)
Place of birth for the foreign-born population - Iran (%)
Place of birth for the foreign-born population - Kazakhstan (%)
Place of birth for the foreign-born population - Nepal (%)
Place of birth for the foreign-born population - Pakistan (%)
Place of birth for the foreign-born population - Sri Lanka (%)
Place of birth for the foreign-born population - Uzbekistan (%)
Place of birth for the foreign-born population - Other South Central Asia (%)
Place of birth for the foreign-born population - Burma (%)
Place of birth for the foreign-born population - Cambodia (%)
Place of birth for the foreign-born population - Indonesia (%)
Place of birth for the foreign-born population - Laos (%)
Place of birth for the foreign-born population - Malaysia (%)
Place of birth for the foreign-born population - Philippines (%)
Place of birth for the foreign-born population - Singapore (%)
Place of birth for the foreign-born population - Thailand (%)
Place of birth for the foreign-born population - Vietnam (%)
Place of birth for the foreign-born population - Other South Eastern Asia (%)
Place of birth for the foreign-born population - Armenia (%)
Place of birth for the foreign-born population - Iraq (%)
Place of birth for the foreign-born population - Israel (%)
Place of birth for the foreign-born population - Jordan (%)
Place of birth for the foreign-born population - Kuwait (%)
Place of birth for the foreign-born population - Lebanon (%)
Place of birth for the foreign-born population - Saudi Arabia (%)
Place of birth for the foreign-born population - Syria (%)
Place of birth for the foreign-born population - Turkey (%)
Place of birth for the foreign-born population - Yemen (%)
Place of birth for the foreign-born population - Other Western Asia (%)
Place of birth for the foreign-born population - Eritrea (%)
Place of birth for the foreign-born population - Ethiopia (%)
Place of birth for the foreign-born population - Kenya (%)
Place of birth for the foreign-born population - Somalia (%)
Place of birth for the foreign-born population - Uganda (%)
Place of birth for the foreign-born population - Zimbabwe (%)
Place of birth for the foreign-born population - Other Eastern Africa (%)
Place of birth for the foreign-born population - Cameroon (%)
Place of birth for the foreign-born population - Congo (%)
Place of birth for the foreign-born population - Democratic Republic of Congo (Zaire) (%)
Place of birth for the foreign-born population - Other Middle Africa (%)
Place of birth for the foreign-born population - Egypt (%)
Place of birth for the foreign-born population - Morocco (%)
Place of birth for the foreign-born population - Sudan (%)
Place of birth for the foreign-born population - Other Northern Africa (%)
Place of birth for the foreign-born population - South Africa (%)
Place of birth for the foreign-born population - Other Southern Africa (%)
Place of birth for the foreign-born population - Cabo Verde (%)
Place of birth for the foreign-born population - Ghana (%)
Place of birth for the foreign-born population - Liberia (%)
Place of birth for the foreign-born population - Nigeria (%)
Place of birth for the foreign-born population - Senegal (%)
Place of birth for the foreign-born population - Sierra Leone (%)
Place of birth for the foreign-born population - Other Western Africa (%)
Place of birth for the foreign-born population - Australia (%)
Place of birth for the foreign-born population - New Zealand (%)
Place of birth for the foreign-born population - Fiji (%)
Place of birth for the foreign-born population - Micronesia (%)
Place of birth for the foreign-born population - Bahamas (%)
Place of birth for the foreign-born population - Barbados (%)
Place of birth for the foreign-born population - Cuba (%)
Place of birth for the foreign-born population - Dominica (%)
Place of birth for the foreign-born population - Dominican Republic (%)
Place of birth for the foreign-born population - Grenada (%)
Place of birth for the foreign-born population - Haiti (%)
Place of birth for the foreign-born population - Jamaica (%)
Place of birth for the foreign-born population - St. Vincent and the Grenadines (%)
Place of birth for the foreign-born population - Trinidad and Tobago (%)
Place of birth for the foreign-born population - West Indies (%)
Place of birth for the foreign-born population - Other Caribbean (%)
Place of birth for the foreign-born population - Belize (%)
Place of birth for the foreign-born population - Costa Rica (%)
Place of birth for the foreign-born population - El Salvador (%)
Place of birth for the foreign-born population - Guatemala (%)
Place of birth for the foreign-born population - Honduras (%)
Place of birth for the foreign-born population - Mexico (%)
Place of birth for the foreign-born population - Nicaragua (%)
Place of birth for the foreign-born population - Panama (%)
Place of birth for the foreign-born population - Other Central America (%)
Place of birth for the foreign-born population - Argentina (%)
Place of birth for the foreign-born population - Bolivia (%)
Place of birth for the foreign-born population - Brazil (%)
Place of birth for the foreign-born population - Chile (%)
Place of birth for the foreign-born population - Colombia (%)
Place of birth for the foreign-born population - Ecuador (%)
Place of birth for the foreign-born population - Guyana (%)
Place of birth for the foreign-born population - Peru (%)
Place of birth for the foreign-born population - Uruguay (%)
Place of birth for the foreign-born population - Venezuela (%)
Place of birth for the foreign-born population - Other South America (%)
Place of birth for the foreign-born population - Canada (%)
Place of birth for the foreign-born population - Other Northern America (%)
Place of birth for the foreign-born population - Other (%)
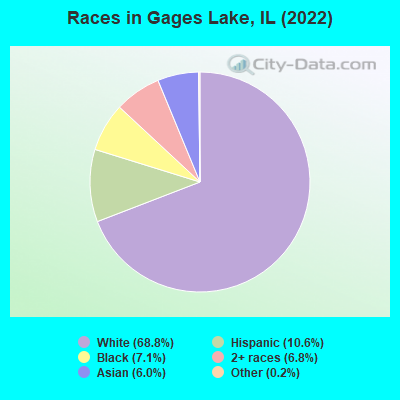
According to 2022 data, the most numerous races in Gages Lake, IL are White alone (7,455 residents), Hispanic (1,151 residents), and Black alone (767 residents). 81.0% of Gages Lake residents speak English at home. 11.0% of Gages Lake, IL residents are foreign-born (4.2% born in Latin America, 4.0% born in Asia, 2.2% born in Europe), which is 27.2% less than the foreign-born rate of 14.0% across the entire state of Illinois.
Race distribution in Gages Lake
2000 2022
8,424,140 67.8% White alone 1,856,152 14.9% Black alone 1,530,262 12.3% Hispanic 419,916 3.4% Asian alone 153,996 1.2% Two or more races 13,479 0.1% Other race alone 18,232 0.1% American Indian alone 3,116 0.03% Native Hawaiian and Other
7,356,301 58.5% White alone 2,299,726 18.3% Hispanic 1,660,423 13.2% Black alone 747,296 5.9% Asian alone 458,599 3.6% Two or more races 45,386 0.4% Other race alone 10,405 0.08% American Indian alone 3,896 0.03% Native Hawaiian and Other
Income and house value in Gages Lake Median household income in 2022 $111,962 White non-Hispanic householders$82,720 Black householders$85,952 Asian householders$52,705 Some other race householders$62,358 Two or more races householders$70,546 Hispanic or Latino race householdersMedian 2022 house value $284,868 White Non-Hispanic householders$286,117 Black or African American householders $414,727 Asian householders$247,944 Some other race householders$322,149 Two or more races householders$279,873 Hispanic or Latino householders
Median age by race in Gages Lake
45.9 Median age for White residents45.7 46.7 20.3 Median age for Black or African American residents15.9 21.7 39.4 Median age for American Indian / Alaska Native residents-671,532,846.0 -638,251,365.5 41.5 Median age for Asian residents41.6 42.8 -593,236,714.4 Median age for Native Hawaiian / Pacific Islander residents-658,536,584.7 -576,015,108.0 35.4 Median age for Other race residents28.1 44.0 23.4 Median age for Two or more races residents23.7 23.5 46.5 Median age for White alone residents46.6 46.8 28.7 Median age for Hispanic or Latino residents28.4 29.4
Owner/renter occupied households by race in Gages Lake
House owners and renters - White residents 2,623 84.1% Owner occupied496 15.9% Renter occupiedHouse owners and renters - Black or African American residents 32 15.1% Owner occupied178 84.9% Renter occupiedHouse owners and renters - American Indian / Alaska Native residents 43 100.0% Renter occupiedHouse owners and renters - Asian residents 268 96.6% Owner occupied9 3.4% Renter occupiedHouse owners and renters - Other race residents 99 100.0% Owner occupiedHouse owners and renters - Two or more races residents 267 79.5% Owner occupied69 20.5% Renter occupiedHouse owners and renters - White alone residents 2,615 83.3% Owner occupied526 16.7% Renter occupiedHouse owners and renters - Hispanic or Latino residents 248 85.5% Owner occupied42 14.5% Renter occupied
Language usage in Gages Lake
English speakers - Total 81.0% of residents of Gages Lake speak English at home.
7.9% of residents speak Spanish at home 570 70.2% Speak English very well242 29.8% Speak English less than very well10.6% of residents speak other language at home 867 79.4% Speak English very well225 20.6% Speak English less than very well
English speakers - Born in the United States 89.0% of residents of Gages Lake speak English at home.
9.2% of residents speak Spanish at home 190 100.0% Speak English very well2.4% of residents speak other language at home 49 100.0% Speak English very well
English speakers - Native, born elsewhere 79.3% of residents of Gages Lake speak English at home.
18.3% of residents speak other language at home 15 100.0% Speak English very well
English speakers - Foreign-born 21.1% of residents of Gages Lake speak English at home.
30.0% of residents speak Spanish at home 140 37.4% Speak English very well234 62.6% Speak English less than very well48.2% of residents speak other language at home 438 73.0% Speak English very well162 27.0% Speak English less than very well
White (Caucasian) - Speak only English Native:
97.1% (6,531)Foreign-born:
28.7% (144)
White (Caucasian) - Speak another language Native:
4.0% (271)Foreign-born:
71.7% (361)
Black or African American - Speak another language Native:
8.6% (63)Foreign-born:
100.0% (62)
American Indian / Alaska Native - Speak another language Native:
97.7% (17)Foreign-born:
100.0% (52)
Asian - Speak only English Native:
40.0% (92)Foreign-born:
20.4% (84)
Asian - Speak another language Native:
62.8% (144)Foreign-born:
78.2% (320)
Other race - Speak another language Native:
62.3% (134)Foreign-born:
94.8% (12)
Two or more races - Speak only English Native:
69.5% (676)Foreign-born:
16.0% (8)
Two or more races - Speak another language Native:
28.1% (274)Foreign-born:
82.3% (39)
White alone - Speak only English Native:
95.7% (6,454)Foreign-born:
38.3% (136)
White alone - Speak another language Native:
4.2% (284)Foreign-born:
62.2% (221)
Hispanic or Latino - Speak only English Native:
54.6% (374)Foreign-born:
6.1% (25)
Hispanic or Latino - Speak another language Native:
46.8% (321)Foreign-born:
93.3% (379)
Foreign-born residents in Gages Lake 1,193 residents are foreign born (4.2% Latin America , 4.0% Asia , 2.2% Europe ).
This city:
11.0%Illinois:
14.1%
Marital status for residents in Gages Lake Marital status - White (Caucasian) population 15 years and over
Males 30.3% Never married59.3% Now married0.4% Separated2.3% Widowed7.7% DivorcedFemales 24.2% Never married59.6% Now married2.3% Separated4.5% Widowed9.3% DivorcedWomen who gave birth in the past 12 months Now married:
86.2% (83)Unmarried:
13.8% (13)
Women who did not give birth in the past 12 months Now married:
49.2% (662)Unmarried:
50.8% (683)
Marital status - Black or African American population 15 years and over
Males 26.5% Never married64.7% Now married0.0% Separated0.0% Widowed8.8% DivorcedFemales 55.2% Never married21.8% Now married0.0% Separated6.6% Widowed16.4% DivorcedWomen who gave birth in the past 12 months Now married:
0.0% (0)Unmarried:
100.0% (26)
Women who did not give birth in the past 12 months Now married:
21.8% (58)Unmarried:
78.2% (208)
Marital status - American Indian / Alaska Native population 15 years and over
Males 47.6% Never married52.4% Now married0.0% Separated0.0% Widowed0.0% DivorcedFemales 0.0% Never married52.6% Now married0.0% Separated0.0% Widowed47.4% DivorcedWomen who did not give birth in the past 12 months Now married:
52.6% (17)Unmarried:
47.4% (15)
Marital status - Asian population 15 years and over
Males 48.3% Never married45.9% Now married1.9% Separated0.0% Widowed3.9% DivorcedFemales 33.2% Never married52.1% Now married1.8% Separated7.0% Widowed5.8% DivorcedWomen who did not give birth in the past 12 months Now married:
54.5% (119)Unmarried:
45.5% (100)
Marital status - Other race population 15 years and over
Males 62.3% Never married26.3% Now married0.0% Separated0.0% Widowed11.4% DivorcedFemales 36.9% Never married35.7% Now married27.4% Separated0.0% Widowed0.0% DivorcedWomen who did not give birth in the past 12 months Now married:
44.6% (25)Unmarried:
55.4% (31)
Marital status - Two or more races population 15 years and over
Males 57.3% Never married35.3% Now married0.0% Separated0.0% Widowed7.4% DivorcedFemales 45.6% Never married43.0% Now married0.0% Separated0.0% Widowed11.4% DivorcedWomen who gave birth in the past 12 months Now married:
68.4% (19)Unmarried:
31.6% (9)
Women who did not give birth in the past 12 months Now married:
32.4% (88)Unmarried:
67.6% (183)
Marital status - White alone, not Hispanic / Latino population 15 years and over
Males 30.0% Never married58.8% Now married0.4% Separated2.5% Widowed8.3% DivorcedFemales 23.8% Never married59.1% Now married2.5% Separated4.8% Widowed9.9% DivorcedWomen who gave birth in the past 12 months Now married:
86.2% (89)Unmarried:
13.8% (14)
Women who did not give birth in the past 12 months Now married:
47.3% (603)Unmarried:
52.7% (672)
Marital status - Hispanic or Latino population 15 years and over
Males 45.9% Never married48.6% Now married0.0% Separated0.0% Widowed5.5% DivorcedFemales 28.9% Never married60.4% Now married3.1% Separated0.0% Widowed7.6% DivorcedWomen who gave birth in the past 12 months Now married:
0.0% (0)Unmarried:
100.0% (6)
Women who did not give birth in the past 12 months Now married:
59.3% (181)Unmarried:
40.7% (124)
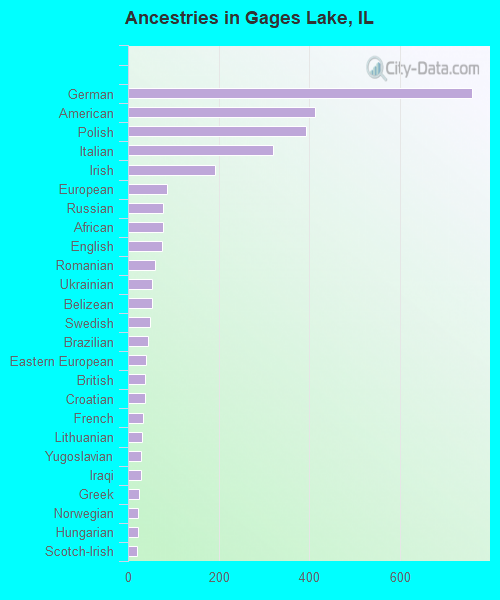
Ancestries in Gages Lake
758 15.2% German412 8.3% American392 7.9% Polish320 6.4% Italian191 3.8% Irish87 1.7% European78 1.6% Russian77 1.5% African76 1.5% English59 1.2% Romanian54 1.1% Ukrainian52 1.0% Belizean49 1.0% Swedish45 0.9% Brazilian40 0.8% Eastern European38 0.8% British38 0.8% Croatian32 0.6% French31 0.6% Lithuanian29 0.6% Yugoslavian28 0.6% Iraqi24 0.5% Greek23 0.5% Norwegian21 0.4% Hungarian19 0.4% Scotch-Irish11 0.2% French Canadian9 0.2% Bulgarian9 0.2% Slovene8 0.2% Dutch8 0.2% Finnish7 0.1% Scottish6 0.1% Northern European
Children Nativity (place of birth) in Gages Lake
Children under 6 years - Living with two parents Both parents native 423 100.0% NativeBoth parents foreign-born 19 56.7% Native15 43.3% Foreign-bornOne native, one foreign-born parent 47 100.0% NativeChildren under 6 years - Living with one parent Native parent 90 100.0% NativeChildren 6 to 17 years - Living with two parents Both parents native 816 100.0% NativeBoth parents foreign-born 102 75.4% Native33 24.6% Foreign-bornOne native, one foreign-born parent 171 70.2% Native72 29.8% Foreign-bornChildren 6 to 17 years - Living with one parent Native parent 229 100.0% NativeForeign-born parent 231 51.8% Native215 48.2% Foreign-born
Grandparents responsible for own grandchildren in Gages Lake
Grandparents (30 to 59 years) White / Caucasian 18 100.0% Not responsible for grandchildrenBlack or African American 7 100.0% Not responsible for grandchildrenWhite alone, not Hispanic / Latino 19 100.0% Not responsible for grandchildrenGrandparents (60 years and over) White / Caucasian 17 38.9% Responsible for grandchildren27 61.1% Not responsible for grandchildrenWhite alone, not Hispanic / Latino 21 52.0% Responsible for grandchildren19 48.0% Not responsible for grandchildren