Races in Georgetown, Texas (TX) Detailed Stats
Data:
Races - White alone (%)
Races - White alone (% change since 2000)
Races - Black alone (%)
Races - Black alone (% change since 2000)
Races - American Indian alone (%)
Races - American Indian alone (% change since 2000)
Races - Asian alone (%)
Races - Asian alone (% change since 2000)
Races - Hispanic (%)
Races - Hispanic (% change since 2000)
Races - Native Hawaiian and Other Pacific Islander alone (%)
Races - Native Hawaiian and Other Pacific Islander alone (% change since 2000)
Races - Two or more races(%)
Races - Two or more races(% change since 2000)
Races - Other race alone (%)
Races - Other race alone (% change since 2000)
Racial diversity
Place of birth - Born in state of residence (%)
Place of birth - Born in state of residence (%) - White
Place of birth - Born in state of residence (%) - Black or African American
Place of birth - Born in state of residence (%) - Asian
Place of birth - Born in state of residence (%) - Hispanic or Latino
Place of birth - Born in state of residence (%) - American Indian and Alaska Native
Place of birth - Born in state of residence (%) - Multirace
Place of birth - Born in state of residence (%) - Other Race
Place of birth - Born in other state (%)
Place of birth - Born in other state (%) - White
Place of birth - Born in other state (%) - Black or African American
Place of birth - Born in other state (%) - Asian
Place of birth - Born in other state (%) - Hispanic or Latino
Place of birth - Born in other state (%) - American Indian and Alaska Native
Place of birth - Born in other state (%) - Multirace
Place of birth - Born in other state (%) - Other Race
Place of birth - Native, outside of US (%)
Place of birth - Native, outside of US (%) - White
Place of birth - Native, outside of US (%) - Black or African American
Place of birth - Native, outside of US (%) - Asian
Place of birth - Native, outside of US (%) - Hispanic or Latino
Place of birth - Native, outside of US (%) - American Indian and Alaska Native
Place of birth - Native, outside of US (%) - Multirace
Place of birth - Native, outside of US (%) - Other Race
Place of birth - Foreign born (%)
Place of birth - Foreign born (%) - White
Place of birth - Foreign born (%) - Black or African American
Place of birth - Foreign born (%) - Asian
Place of birth - Foreign born (%) - Hispanic or Latino
Place of birth - Foreign born (%) - American Indian and Alaska Native
Place of birth - Foreign born (%) - Multirace
Place of birth - Foreign born (%) - Other Race
Residents speaking English at home (%)
Residents speaking English at home - Born in the United States (%)
Residents speaking English at home - Native, born elsewhere (%)
Residents speaking English at home - Foreign born (%)
Residents speaking Spanish at home (%)
Residents speaking Spanish at home - Born in the United States (%)
Residents speaking Spanish at home - Native, born elsewhere (%)
Residents speaking Spanish at home - Foreign born (%)
Residents speaking other language at home (%)
Residents speaking other language at home - Born in the United States (%)
Residents speaking other language at home - Native, born elsewhere (%)
Residents speaking other language at home - Foreign born (%)
Marital status - Never married (%)
Marital status - Now married (%)
Marital status - Separated (%)
Marital status - Widowed (%)
Marital status - Divorced (%)
Ancestries Reported - Arab (%)
Ancestries Reported - Czech (%)
Ancestries Reported - Danish (%)
Ancestries Reported - Dutch (%)
Ancestries Reported - English (%)
Ancestries Reported - French (%)
Ancestries Reported - French Canadian (%)
Ancestries Reported - German (%)
Ancestries Reported - Greek (%)
Ancestries Reported - Hungarian (%)
Ancestries Reported - Irish (%)
Ancestries Reported - Italian (%)
Ancestries Reported - Lithuanian (%)
Ancestries Reported - Norwegian (%)
Ancestries Reported - Polish (%)
Ancestries Reported - Portuguese (%)
Ancestries Reported - Russian (%)
Ancestries Reported - Scotch-Irish (%)
Ancestries Reported - Scottish (%)
Ancestries Reported - Slovak (%)
Ancestries Reported - Subsaharan African (%)
Ancestries Reported - Swedish (%)
Ancestries Reported - Swiss (%)
Ancestries Reported - Ukrainian (%)
Ancestries Reported - United States (%)
Ancestries Reported - Welsh (%)
Ancestries Reported - West Indian (%)
Ancestries Reported - Other (%)
Geographical mobility - Same house 1 year ago (%)
Geographical mobility - Same house 1 year ago (%) - White
Geographical mobility - Same house 1 year ago (%) - Black or African American
Geographical mobility - Same house 1 year ago (%) - Asian
Geographical mobility - Same house 1 year ago (%) - Hispanic or Latino
Geographical mobility - Same house 1 year ago (%) - American Indian and Alaska Native
Geographical mobility - Same house 1 year ago (%) - Multirace
Geographical mobility - Same house 1 year ago (%) - Other Race
Geographical mobility - Moved within same county (%)
Geographical mobility - Moved within same county (%) - White
Geographical mobility - Moved within same county (%) - Black or African American
Geographical mobility - Moved within same county (%) - Asian
Geographical mobility - Moved within same county (%) - Hispanic or Latino
Geographical mobility - Moved within same county (%) - American Indian and Alaska Native
Geographical mobility - Moved within same county (%) - Multirace
Geographical mobility - Moved within same county (%) - Other Race
Geographical mobility - Moved from different county within same state (%)
Geographical mobility - Moved from different county within same state (%) - White
Geographical mobility - Moved from different county within same state (%) - Black or African American
Geographical mobility - Moved from different county within same state (%) - Asian
Geographical mobility - Moved from different county within same state (%) - Hispanic or Latino
Geographical mobility - Moved from different county within same state (%) - American Indian and Alaska Native
Geographical mobility - Moved from different county within same state (%) - Multirace
Geographical mobility - Moved from different county within same state (%) - Other Race
Geographical mobility - Moved from different state (%)
Geographical mobility - Moved from different state (%) - White
Geographical mobility - Moved from different state (%) - Black or African American
Geographical mobility - Moved from different state (%) - Asian
Geographical mobility - Moved from different state (%) - Hispanic or Latino
Geographical mobility - Moved from different state (%) - American Indian and Alaska Native
Geographical mobility - Moved from different state (%) - Multirace
Geographical mobility - Moved from different state (%) - Other Race
Geographical mobility - Moved from abroad (%)
Geographical mobility - Moved from abroad (%) - White
Geographical mobility - Moved from abroad (%) - Black or African American
Geographical mobility - Moved from abroad (%) - Asian
Geographical mobility - Moved from abroad (%) - Hispanic or Latino
Geographical mobility - Moved from abroad (%) - American Indian and Alaska Native
Geographical mobility - Moved from abroad (%) - Multirace
Geographical mobility - Moved from abroad (%) - Other Race
Place of birth for the foreign-born population - Ireland (%)
Place of birth for the foreign-born population - Denmark (%)
Place of birth for the foreign-born population - Norway (%)
Place of birth for the foreign-born population - Sweden (%)
Place of birth for the foreign-born population - United Kingdom (%)
Place of birth for the foreign-born population - England (%)
Place of birth for the foreign-born population - Scotland (%)
Place of birth for the foreign-born population - Other Northern Europe (%)
Place of birth for the foreign-born population - Austria (%)
Place of birth for the foreign-born population - Belgium (%)
Place of birth for the foreign-born population - France (%)
Place of birth for the foreign-born population - Germany (%)
Place of birth for the foreign-born population - Netherlands (%)
Place of birth for the foreign-born population - Switzerland (%)
Place of birth for the foreign-born population - Other Western Europe (%)
Place of birth for the foreign-born population - Greece (%)
Place of birth for the foreign-born population - Italy (%)
Place of birth for the foreign-born population - Portugal (%)
Place of birth for the foreign-born population - Spain (%)
Place of birth for the foreign-born population - Other Southern Europe (%)
Place of birth for the foreign-born population - Albania (%)
Place of birth for the foreign-born population - Belarus (%)
Place of birth for the foreign-born population - Bosnia and Herzegovina (%)
Place of birth for the foreign-born population - Bulgaria (%)
Place of birth for the foreign-born population - Croatia (%)
Place of birth for the foreign-born population - Czechoslovakia (%)
Place of birth for the foreign-born population - Hungary (%)
Place of birth for the foreign-born population - Latvia (%)
Place of birth for the foreign-born population - Lithuania (%)
Place of birth for the foreign-born population - North Macedonia (Macedonia) (%)
Place of birth for the foreign-born population - Moldova (%)
Place of birth for the foreign-born population - Poland (%)
Place of birth for the foreign-born population - Romania (%)
Place of birth for the foreign-born population - Russia (%)
Place of birth for the foreign-born population - Serbia (%)
Place of birth for the foreign-born population - Ukraine (%)
Place of birth for the foreign-born population - Other Eastern Europe (%)
Place of birth for the foreign-born population - China (%)
Place of birth for the foreign-born population - Hong Kong (%)
Place of birth for the foreign-born population - Taiwan (%)
Place of birth for the foreign-born population - Japan (%)
Place of birth for the foreign-born population - Korea (%)
Place of birth for the foreign-born population - Other Eastern Asia (%)
Place of birth for the foreign-born population - Afghanistan (%)
Place of birth for the foreign-born population - Bangladesh (%)
Place of birth for the foreign-born population - India (%)
Place of birth for the foreign-born population - Iran (%)
Place of birth for the foreign-born population - Kazakhstan (%)
Place of birth for the foreign-born population - Nepal (%)
Place of birth for the foreign-born population - Pakistan (%)
Place of birth for the foreign-born population - Sri Lanka (%)
Place of birth for the foreign-born population - Uzbekistan (%)
Place of birth for the foreign-born population - Other South Central Asia (%)
Place of birth for the foreign-born population - Burma (%)
Place of birth for the foreign-born population - Cambodia (%)
Place of birth for the foreign-born population - Indonesia (%)
Place of birth for the foreign-born population - Laos (%)
Place of birth for the foreign-born population - Malaysia (%)
Place of birth for the foreign-born population - Philippines (%)
Place of birth for the foreign-born population - Singapore (%)
Place of birth for the foreign-born population - Thailand (%)
Place of birth for the foreign-born population - Vietnam (%)
Place of birth for the foreign-born population - Other South Eastern Asia (%)
Place of birth for the foreign-born population - Armenia (%)
Place of birth for the foreign-born population - Iraq (%)
Place of birth for the foreign-born population - Israel (%)
Place of birth for the foreign-born population - Jordan (%)
Place of birth for the foreign-born population - Kuwait (%)
Place of birth for the foreign-born population - Lebanon (%)
Place of birth for the foreign-born population - Saudi Arabia (%)
Place of birth for the foreign-born population - Syria (%)
Place of birth for the foreign-born population - Turkey (%)
Place of birth for the foreign-born population - Yemen (%)
Place of birth for the foreign-born population - Other Western Asia (%)
Place of birth for the foreign-born population - Eritrea (%)
Place of birth for the foreign-born population - Ethiopia (%)
Place of birth for the foreign-born population - Kenya (%)
Place of birth for the foreign-born population - Somalia (%)
Place of birth for the foreign-born population - Uganda (%)
Place of birth for the foreign-born population - Zimbabwe (%)
Place of birth for the foreign-born population - Other Eastern Africa (%)
Place of birth for the foreign-born population - Cameroon (%)
Place of birth for the foreign-born population - Congo (%)
Place of birth for the foreign-born population - Democratic Republic of Congo (Zaire) (%)
Place of birth for the foreign-born population - Other Middle Africa (%)
Place of birth for the foreign-born population - Egypt (%)
Place of birth for the foreign-born population - Morocco (%)
Place of birth for the foreign-born population - Sudan (%)
Place of birth for the foreign-born population - Other Northern Africa (%)
Place of birth for the foreign-born population - South Africa (%)
Place of birth for the foreign-born population - Other Southern Africa (%)
Place of birth for the foreign-born population - Cabo Verde (%)
Place of birth for the foreign-born population - Ghana (%)
Place of birth for the foreign-born population - Liberia (%)
Place of birth for the foreign-born population - Nigeria (%)
Place of birth for the foreign-born population - Senegal (%)
Place of birth for the foreign-born population - Sierra Leone (%)
Place of birth for the foreign-born population - Other Western Africa (%)
Place of birth for the foreign-born population - Australia (%)
Place of birth for the foreign-born population - New Zealand (%)
Place of birth for the foreign-born population - Fiji (%)
Place of birth for the foreign-born population - Micronesia (%)
Place of birth for the foreign-born population - Bahamas (%)
Place of birth for the foreign-born population - Barbados (%)
Place of birth for the foreign-born population - Cuba (%)
Place of birth for the foreign-born population - Dominica (%)
Place of birth for the foreign-born population - Dominican Republic (%)
Place of birth for the foreign-born population - Grenada (%)
Place of birth for the foreign-born population - Haiti (%)
Place of birth for the foreign-born population - Jamaica (%)
Place of birth for the foreign-born population - St. Vincent and the Grenadines (%)
Place of birth for the foreign-born population - Trinidad and Tobago (%)
Place of birth for the foreign-born population - West Indies (%)
Place of birth for the foreign-born population - Other Caribbean (%)
Place of birth for the foreign-born population - Belize (%)
Place of birth for the foreign-born population - Costa Rica (%)
Place of birth for the foreign-born population - El Salvador (%)
Place of birth for the foreign-born population - Guatemala (%)
Place of birth for the foreign-born population - Honduras (%)
Place of birth for the foreign-born population - Mexico (%)
Place of birth for the foreign-born population - Nicaragua (%)
Place of birth for the foreign-born population - Panama (%)
Place of birth for the foreign-born population - Other Central America (%)
Place of birth for the foreign-born population - Argentina (%)
Place of birth for the foreign-born population - Bolivia (%)
Place of birth for the foreign-born population - Brazil (%)
Place of birth for the foreign-born population - Chile (%)
Place of birth for the foreign-born population - Colombia (%)
Place of birth for the foreign-born population - Ecuador (%)
Place of birth for the foreign-born population - Guyana (%)
Place of birth for the foreign-born population - Peru (%)
Place of birth for the foreign-born population - Uruguay (%)
Place of birth for the foreign-born population - Venezuela (%)
Place of birth for the foreign-born population - Other South America (%)
Place of birth for the foreign-born population - Canada (%)
Place of birth for the foreign-born population - Other Northern America (%)
Place of birth for the foreign-born population - Other (%)
Latest news about races in Georgetown, TX collected exclusively by city-data.com from local newspapers, TV, and radio stations
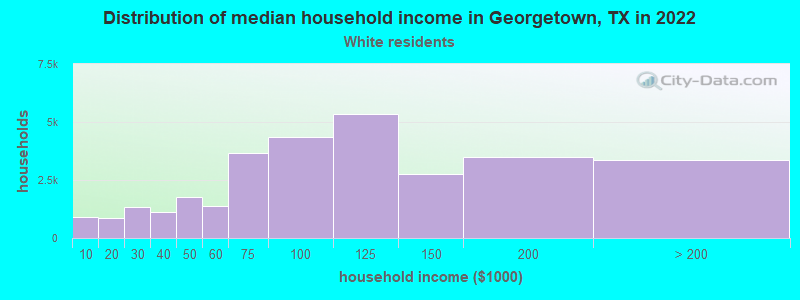
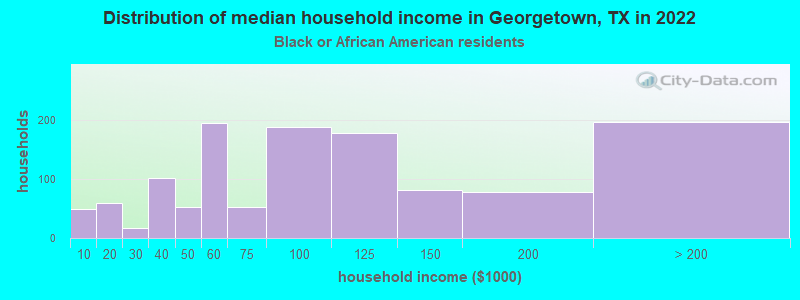
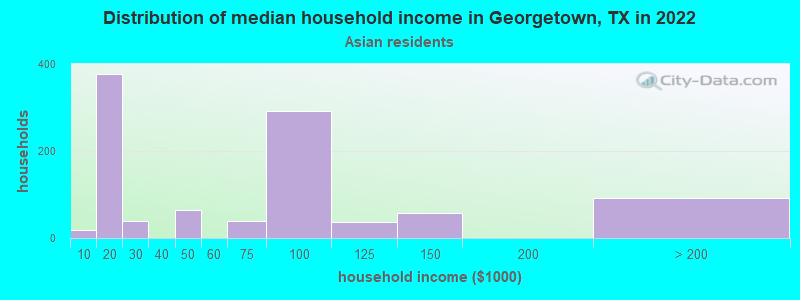
According to 2022 data, the most numerous races in Georgetown, TX are Hispanic (17,243 residents), White alone (56,987 residents), and Black alone (5,615 residents). 85.8% of Georgetown residents speak English at home. 8.0% of Georgetown, TX residents are foreign-born (4.4% born in Latin America, 1.7% born in Asia, 1.3% born in Europe, 0.8% born in Africa), which is 113.3% less than the foreign-born rate of 17.0% across the entire state of Texas.
Race distribution in Georgetown
2000 2022
10,933,313 52.4% White alone 6,669,666 32.0% Hispanic 2,364,255 11.3% Black alone 554,445 2.7% Asian alone 230,567 1.1% Two or more races 68,859 0.3% American Indian alone 19,958 0.10% Other race alone 10,757 0.05% Native Hawaiian and Other
12,070,642 40.2% Hispanic 11,683,430 38.9% White alone 3,508,706 11.7% Black alone 1,608,173 5.4% Asian alone 956,560 3.2% Two or more races 125,763 0.4% Other race alone 47,023 0.2% American Indian alone 29,275 0.10% Native Hawaiian and Other
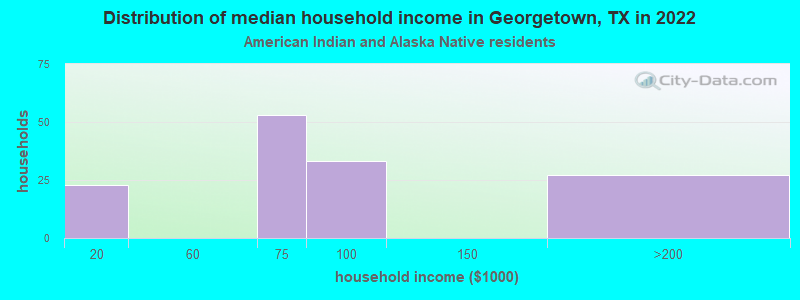
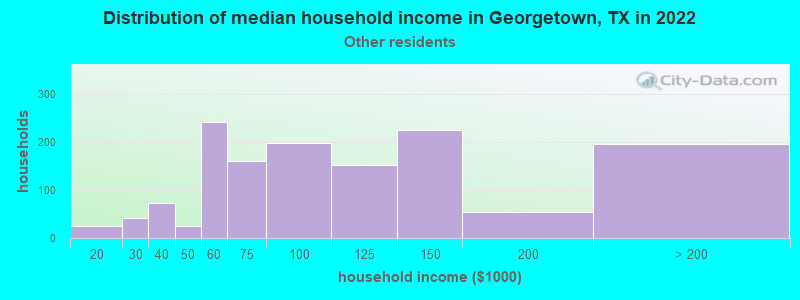
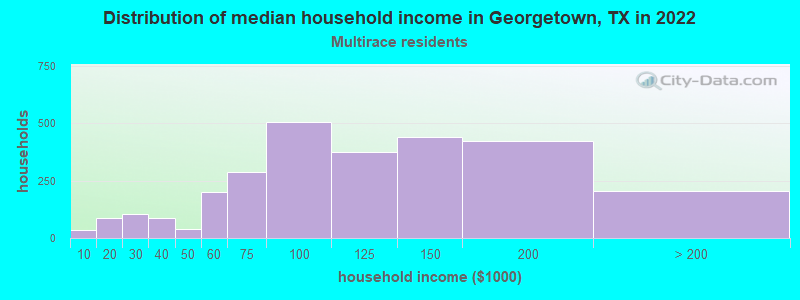
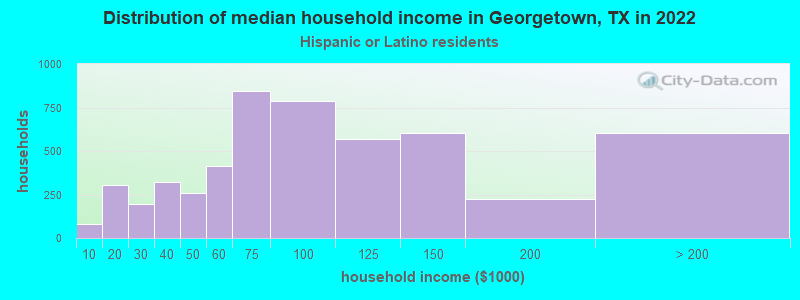
Income and house value in Georgetown Median household income in 2022 $97,673 White non-Hispanic householders$80,139 Black householders$86,405 Asian householders$130,358 Some other race householders$98,822 Two or more races householders$117,776 Hispanic or Latino race householdersMedian 2022 house value $466,873 White Non-Hispanic householders$256,907 Black or African American householders$237,877 American Indian or Alaska Native householders $562,975 Asian householders$265,153 Some other race householders$284,501 Two or more races householders$275,303 Hispanic or Latino householders
Median age by race in Georgetown
53.5 Median age for White residents51.2 54.8 33.4 Median age for Black or African American residents33.8 32.9 -666,666,666.0 Median age for American Indian / Alaska Native residents-666,666,666.0 -666,666,666.0 34.6 Median age for Asian residents33.0 46.6 -666,666,666.0 Median age for Native Hawaiian / Pacific Islander residents-666,666,666.0 -666,666,666.0 33.5 Median age for Other race residents33.8 33.1 30.7 Median age for Two or more races residents29.6 33.2 54.6 Median age for White alone residents53.7 56.5 33.2 Median age for Hispanic or Latino residents35.3 28.2
Owner/renter occupied households by race in Georgetown
House owners and renters - White residents 22,540 74.3% Owner occupied7,813 25.7% Renter occupiedHouse owners and renters - Black or African American residents 883 49.2% Owner occupied911 50.8% Renter occupiedHouse owners and renters - American Indian / Alaska Native residents 122 78.9% Owner occupied33 21.1% Renter occupiedHouse owners and renters - Asian residents 710 84.4% Owner occupied131 15.6% Renter occupiedHouse owners and renters - Native Hawaiian / Pacific Islander residents 92 68.5% Owner occupied43 31.5% Renter occupiedHouse owners and renters - Other race residents 1,414 59.4% Owner occupied965 40.6% Renter occupiedHouse owners and renters - Two or more races residents 1,838 64.1% Owner occupied1,031 35.9% Renter occupiedHouse owners and renters - White alone residents 21,715 75.4% Owner occupied7,082 24.6% Renter occupiedHouse owners and renters - Hispanic or Latino residents 3,576 58.8% Owner occupied2,506 41.2% Renter occupied
Language usage in Georgetown
English speakers - Total 85.8% of residents of Georgetown speak English at home.
8.7% of residents speak Spanish at home 4,940 68.5% Speak English very well2,268 31.5% Speak English less than very well5.5% of residents speak other language at home 3,501 77.6% Speak English very well1,012 22.4% Speak English less than very well
English speakers - Born in the United States 95.5% of residents of Georgetown speak English at home.
3.8% of residents speak Spanish at home 1,266 82.9% Speak English very well262 17.1% Speak English less than very well0.7% of residents speak other language at home 232 86.6% Speak English very well36 13.4% Speak English less than very well
English speakers - Native, born elsewhere 84.2% of residents of Georgetown speak English at home.
15.8% of residents speak other language at home 194 100.0% Speak English very well
English speakers - Foreign-born 18.0% of residents of Georgetown speak English at home.
35.8% of residents speak Spanish at home 1,222 40.9% Speak English very well1,765 59.1% Speak English less than very well46.2% of residents speak other language at home 2,874 74.6% Speak English very well976 25.4% Speak English less than very well
White (Caucasian) - Speak only English Native:
98.5% (55,368)Foreign-born:
41.7% (849)
White (Caucasian) - Speak another language Native:
1.5% (871)Foreign-born:
58.3% (1,186)
Black or African American - Speak only English Native:
93.6% (2,856)Foreign-born:
29.8% (261)
Black or African American - Speak another language Native:
6.8% (206)Foreign-born:
69.9% (613)
American Indian / Alaska Native - Speak another language Native:
68.8% (278)Foreign-born:
98.9% (48)
Asian - Speak only English Native:
45.5% (169)Foreign-born:
8.8% (134)
Asian - Speak another language Native:
53.2% (198)Foreign-born:
91.2% (1,382)
Other race - Speak only English Native:
65.6% (3,648)Foreign-born:
3.9% (43)
Other race - Speak another language Native:
34.4% (1,916)Foreign-born:
96.1% (1,057)
Two or more races - Speak only English Native:
77.4% (6,327)Foreign-born:
6.9% (107)
Two or more races - Speak another language Native:
22.6% (1,844)Foreign-born:
93.1% (1,439)
White alone - Speak only English Native:
98.8% (53,508)Foreign-born:
43.1% (740)
White alone - Speak another language Native:
1.2% (647)Foreign-born:
56.9% (975)
Hispanic or Latino - Speak only English Native:
69.3% (8,907)Foreign-born:
5.3% (152)
Hispanic or Latino - Speak another language Native:
30.7% (3,942)Foreign-born:
94.7% (2,712)
Foreign-born residents in Georgetown 6,221 residents are foreign born (4.4% Latin America , 1.7% Asia , 1.3% Europe , 0.8% Africa ).
This city:
8.0%Texas:
17.1%
Marital status for residents in Georgetown Marital status - White (Caucasian) population 15 years and over
Males 25.4% Never married63.5% Now married0.6% Separated3.8% Widowed6.6% DivorcedFemales 18.7% Never married52.4% Now married0.6% Separated14.4% Widowed13.9% DivorcedWomen who gave birth in the past 12 months Now married:
100.0% (293)Unmarried:
0.0% (0)
Women who did not give birth in the past 12 months Now married:
46.6% (4,935)Unmarried:
53.4% (5,652)
Marital status - Black or African American population 15 years and over
Males 41.5% Never married39.5% Now married7.5% Separated2.5% Widowed9.0% DivorcedFemales 40.5% Never married42.0% Now married2.5% Separated4.3% Widowed10.7% DivorcedWomen who gave birth in the past 12 months Now married:
100.0% (21)Unmarried:
0.0% (0)
Women who did not give birth in the past 12 months Now married:
44.1% (409)Unmarried:
55.9% (519)
Marital status - American Indian / Alaska Native population 15 years and over
Males 69.8% Never married17.7% Now married8.3% Separated0.0% Widowed4.2% DivorcedFemales 34.9% Never married16.5% Now married0.0% Separated43.1% Widowed5.5% DivorcedWomen who did not give birth in the past 12 months Now married:
0.0% (0)Unmarried:
100.0% (63)
Marital status - Asian population 15 years and over
Males 37.5% Never married62.5% Now married0.0% Separated0.0% Widowed0.0% DivorcedFemales 17.1% Never married79.3% Now married0.0% Separated1.9% Widowed1.6% DivorcedWomen who gave birth in the past 12 months Now married:
30.4% (9)Unmarried:
69.6% (21)
Women who did not give birth in the past 12 months Now married:
73.5% (396)Unmarried:
26.5% (143)
Marital status - Native Hawaiian / Pacific Islander population 15 years and over
Males 0.0% Never married0.0% Now married0.0% Separated100.0% Widowed0.0% DivorcedFemales 100.0% Never married0.0% Now married0.0% Separated0.0% Widowed0.0% DivorcedWomen who gave birth in the past 12 months Now married:
0.0% (0)Unmarried:
100.0% (50)
Women who did not give birth in the past 12 months Now married:
0.0% (0)Unmarried:
100.0% (41)
Marital status - Other race population 15 years and over
Males 39.1% Never married49.4% Now married5.9% Separated0.0% Widowed5.6% DivorcedFemales 29.3% Never married52.8% Now married4.1% Separated0.6% Widowed13.3% DivorcedWomen who did not give birth in the past 12 months Now married:
53.5% (810)Unmarried:
46.5% (704)
Marital status - Two or more races population 15 years and over
Males 42.5% Never married47.9% Now married7.7% Separated0.0% Widowed1.9% DivorcedFemales 33.7% Never married47.7% Now married0.0% Separated1.5% Widowed17.1% DivorcedWomen who gave birth in the past 12 months Now married:
11.0% (27)Unmarried:
89.0% (218)
Women who did not give birth in the past 12 months Now married:
28.2% (974)Unmarried:
71.8% (2,475)
Marital status - White alone, not Hispanic / Latino population 15 years and over
Males 23.4% Never married65.2% Now married0.6% Separated4.0% Widowed6.7% DivorcedFemales 18.9% Never married52.3% Now married0.6% Separated14.2% Widowed14.0% DivorcedWomen who gave birth in the past 12 months Now married:
100.0% (231)Unmarried:
0.0% (0)
Women who did not give birth in the past 12 months Now married:
45.2% (4,559)Unmarried:
54.8% (5,532)
Marital status - Hispanic or Latino population 15 years and over
Males 40.3% Never married52.0% Now married2.1% Separated1.1% Widowed4.4% DivorcedFemales 40.6% Never married44.1% Now married1.5% Separated4.3% Widowed9.5% DivorcedWomen who gave birth in the past 12 months Now married:
31.8% (99)Unmarried:
68.2% (212)
Women who did not give birth in the past 12 months Now married:
39.7% (1,813)Unmarried:
60.3% (2,759)
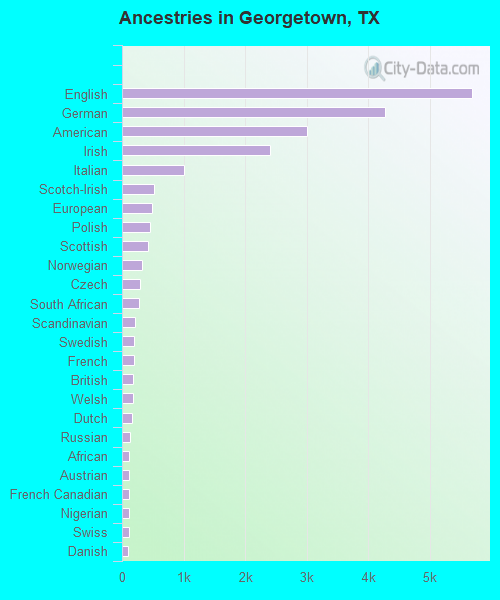
Ancestries in Georgetown
5,675 16.3% English4,275 12.3% German3,011 8.6% American2,402 6.9% Irish1,009 2.9% Italian525 1.5% Scotch-Irish493 1.4% European456 1.3% Polish428 1.2% Scottish320 0.9% Norwegian290 0.8% Czech270 0.8% South African211 0.6% Scandinavian202 0.6% Swedish201 0.6% French175 0.5% British175 0.5% Welsh164 0.5% Dutch136 0.4% Russian121 0.3% African120 0.3% Austrian116 0.3% French Canadian111 0.3% Nigerian109 0.3% Swiss90 0.3% Danish79 0.2% Canadian71 0.2% Eastern European69 0.2% Greek68 0.2% Portuguese59 0.2% Liberian51 0.1% Czechoslovakian48 0.1% Northern European31 0.09% Hungarian30 0.09% Brazilian21 0.06% Lebanese21 0.06% Slovene18 0.05% Slovak17 0.05% Croatian17 0.05% Arab15 0.04% Ukrainian15 0.04% Trinidadian and Tobagonian10 0.03% Belgian10 0.03% Turkish6 0.02% Iranian4 0.01% Finnish
Geographical mobility in Georgetown Same house 1 year ago 48,699 81.8% White (Caucasian)2,908 69.8% Black or African American461 95.2% American Indian / Alaska Native1,352 71.1% Asian118 98.2% Native Hawaiian / Pacific Islander5,874 80.3% Other race8,172 79.0% Two or more races46,015 81.0% White alone, not Hispanic / Latino13,739 80.0% Hispanic or LatinoMoved within same county 4,837 8.1% White / Caucasian398 9.5% Black or African American290 15.3% Asian143 2.0% Other race952 9.2% Two or more races4,837 8.5% White alone, not Hispanic / Latino1,095 6.4% Hispanic or LatinoMoved within same state 3,259 5.5% White / Caucasian527 12.6% Black or African American31 6.3% American Indian / Alaska Native156 8.2% Asian519 7.1% Other race623 6.0% Two or more races3,171 5.6% White alone, not Hispanic / Latino1,279 7.4% Hispanic or LatinoMoved from different state 2,190 3.7% White / Caucasian176 4.2% Black or African American107 5.6% Asian560 7.7% Other race468 4.5% Two or more races2,190 3.9% White alone, not Hispanic / Latino812 4.7% Hispanic or LatinoMoved from abroad 570 1.0% White17 0.9% Asian215 2.9% Other race130 1.3% Two or more races570 1.0% White alone, not Hispanic / Latino259 1.5% Hispanic or Latino
Children Nativity (place of birth) in Georgetown
Children under 6 years - Living with two parents Both parents native 2,679 100.0% NativeBoth parents foreign-born 181 100.0% NativeOne native, one foreign-born parent 202 100.0% NativeChildren under 6 years - Living with one parent Native parent 1,157 100.0% NativeForeign-born parent 73 100.0% NativeChildren 6 to 17 years - Living with two parents Both parents native 5,865 99.3% Native38 0.7% Foreign-bornBoth parents foreign-born 458 92.9% Native35 7.1% Foreign-bornOne native, one foreign-born parent 868 97.4% Native23 2.6% Foreign-bornChildren 6 to 17 years - Living with one parent Native parent 2,135 100.0% NativeForeign-born parent 246 48.1% Native265 51.9% Foreign-born
Grandparents responsible for own grandchildren in Georgetown
Grandparents (30 to 59 years) White / Caucasian 33 29.6% Responsible for grandchildren78 70.4% Not responsible for grandchildrenBlack or African American 15 100.0% Not responsible for grandchildrenTwo or more races 31 100.0% Responsible for grandchildrenWhite alone, not Hispanic / Latino 8 24.6% Responsible for grandchildren24 75.4% Not responsible for grandchildrenHispanic or Latino 35 26.5% Responsible for grandchildren97 73.5% Not responsible for grandchildrenGrandparents (60 years and over) White / Caucasian 27 5.7% Responsible for grandchildren447 94.3% Not responsible for grandchildrenBlack or African American 23 100.0% Not responsible for grandchildrenTwo or more races 70 100.0% Not responsible for grandchildrenWhite alone, not Hispanic / Latino 17 4.1% Responsible for grandchildren407 95.9% Not responsible for grandchildrenHispanic or Latino 39 30.3% Responsible for grandchildren90 69.7% Not responsible for grandchildren