Races in Goldsmith-Penwell, Texas (TX) Detailed Stats
Ancestries, Foreign-born residents, place of birth
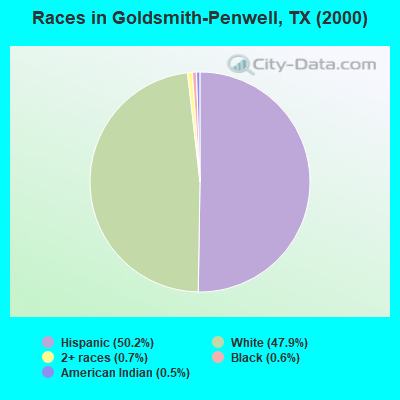
Race distribution in Goldsmith-Penwell

- 10,14150.2%Hispanic
- 9,68747.9%White alone
- 1460.7%Two or more races
- 1120.6%Black alone
- 910.5%American Indian alone
- 160.08%Asian alone
- 80.04%Native Hawaiian and Other
Pacific Islander alone - 20.01%Other race alone
2000
2022
-
- 10,933,31352.4%White alone
- 6,669,66632.0%Hispanic
- 2,364,25511.3%Black alone
- 554,4452.7%Asian alone
- 230,5671.1%Two or more races
- 68,8590.3%American Indian alone
- 19,9580.10%Other race alone
- 10,7570.05%Native Hawaiian and Other
Pacific Islander alone

-
- 12,070,64240.2%Hispanic
- 11,683,43038.9%White alone
- 3,508,70611.7%Black alone
- 1,608,1735.4%Asian alone
- 956,5603.2%Two or more races
- 125,7630.4%Other race alone
- 47,0230.2%American Indian alone
- 29,2750.10%Native Hawaiian and Other
Pacific Islander alone

Income and house value in Goldsmith-Penwell
- Median household income in 2022
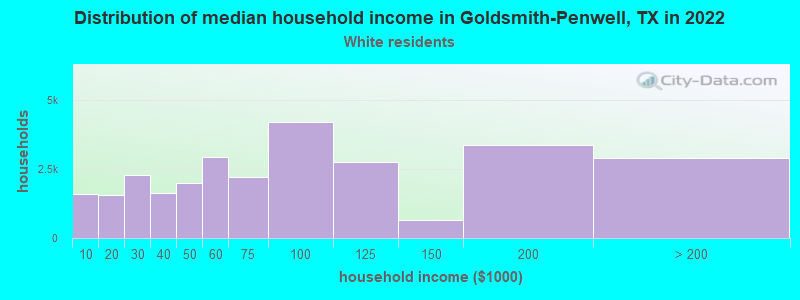
- $68,901White non-Hispanic householders
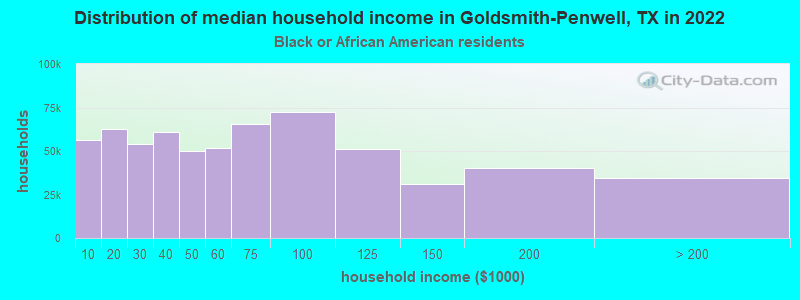
- $86,111Black householders
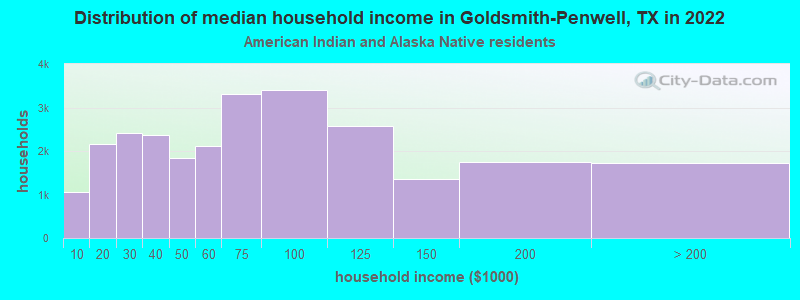
- $41,400American Indian and Alaska Native householders
- $63,437Some other race householders
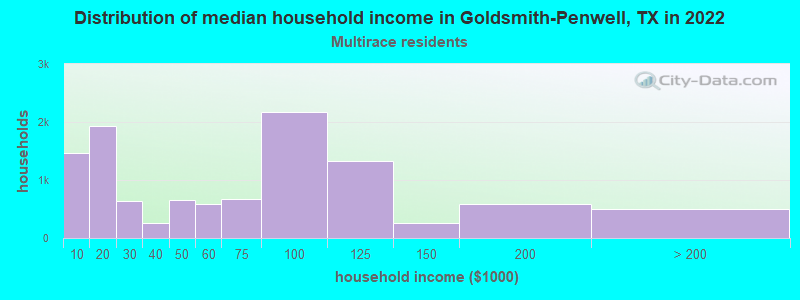
- $49,941Two or more races householders
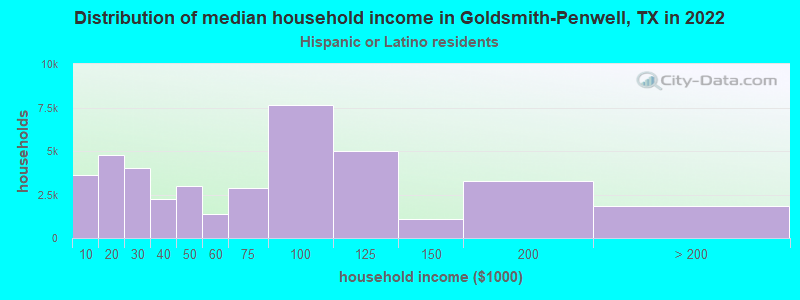
- $74,574Hispanic or Latino race householders
- Median 2022 house value
- $226,130White Non-Hispanic householders
- $212,373Black or African American householders
- $193,457American Indian or Alaska Native householders
- $169,813Some other race householders
- $175,401Two or more races householders
- $179,271Hispanic or Latino householders
Household income for White non-Hispanic householders
Household income for Black householders
Household income for American Indian and Alaska Native householders
Household income for Two or more races householders
Household income for Hispanic or Latino race householders
Zip code: 79764