Races in Grandview, Washington (WA) Detailed Stats
Data:
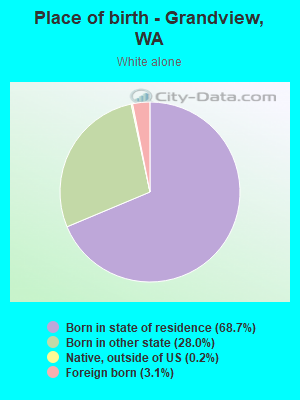
Races - White alone (%)
Races - White alone (% change since 2000)
Races - Black alone (%)
Races - Black alone (% change since 2000)
Races - American Indian alone (%)
Races - American Indian alone (% change since 2000)
Races - Asian alone (%)
Races - Asian alone (% change since 2000)
Races - Hispanic (%)
Races - Hispanic (% change since 2000)
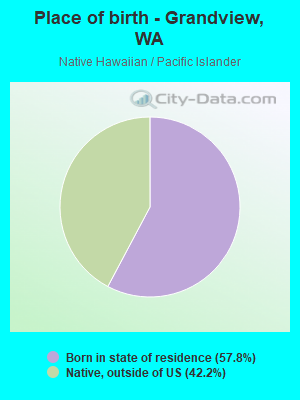
Races - Native Hawaiian and Other Pacific Islander alone (%)
Races - Native Hawaiian and Other Pacific Islander alone (% change since 2000)
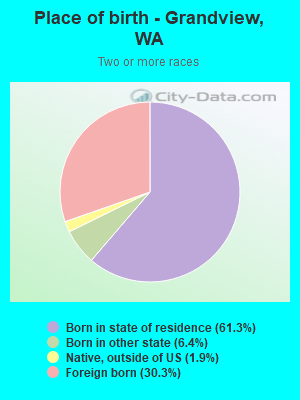
Races - Two or more races(%)
Races - Two or more races(% change since 2000)
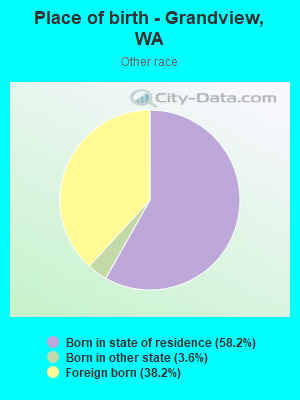
Races - Other race alone (%)
Races - Other race alone (% change since 2000)
Racial diversity
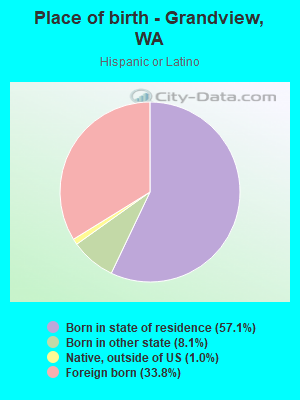
Place of birth - Born in state of residence (%)
Place of birth - Born in state of residence (%) - White
Place of birth - Born in state of residence (%) - Black or African American
Place of birth - Born in state of residence (%) - Asian
Place of birth - Born in state of residence (%) - Hispanic or Latino
Place of birth - Born in state of residence (%) - American Indian and Alaska Native
Place of birth - Born in state of residence (%) - Multirace
Place of birth - Born in state of residence (%) - Other Race
Place of birth - Born in other state (%)
Place of birth - Born in other state (%) - White
Place of birth - Born in other state (%) - Black or African American
Place of birth - Born in other state (%) - Asian
Place of birth - Born in other state (%) - Hispanic or Latino
Place of birth - Born in other state (%) - American Indian and Alaska Native
Place of birth - Born in other state (%) - Multirace
Place of birth - Born in other state (%) - Other Race
Place of birth - Native, outside of US (%)
Place of birth - Native, outside of US (%) - White
Place of birth - Native, outside of US (%) - Black or African American
Place of birth - Native, outside of US (%) - Asian
Place of birth - Native, outside of US (%) - Hispanic or Latino
Place of birth - Native, outside of US (%) - American Indian and Alaska Native
Place of birth - Native, outside of US (%) - Multirace
Place of birth - Native, outside of US (%) - Other Race
Place of birth - Foreign born (%)
Place of birth - Foreign born (%) - White
Place of birth - Foreign born (%) - Black or African American
Place of birth - Foreign born (%) - Asian
Place of birth - Foreign born (%) - Hispanic or Latino
Place of birth - Foreign born (%) - American Indian and Alaska Native
Place of birth - Foreign born (%) - Multirace
Place of birth - Foreign born (%) - Other Race
Residents speaking English at home (%)
Residents speaking English at home - Born in the United States (%)
Residents speaking English at home - Native, born elsewhere (%)
Residents speaking English at home - Foreign born (%)
Residents speaking Spanish at home (%)
Residents speaking Spanish at home - Born in the United States (%)
Residents speaking Spanish at home - Native, born elsewhere (%)
Residents speaking Spanish at home - Foreign born (%)
Residents speaking other language at home (%)
Residents speaking other language at home - Born in the United States (%)
Residents speaking other language at home - Native, born elsewhere (%)
Residents speaking other language at home - Foreign born (%)
Marital status - Never married (%)
Marital status - Now married (%)
Marital status - Separated (%)
Marital status - Widowed (%)
Marital status - Divorced (%)
Ancestries Reported - Arab (%)
Ancestries Reported - Czech (%)
Ancestries Reported - Danish (%)
Ancestries Reported - Dutch (%)
Ancestries Reported - English (%)
Ancestries Reported - French (%)
Ancestries Reported - French Canadian (%)
Ancestries Reported - German (%)
Ancestries Reported - Greek (%)
Ancestries Reported - Hungarian (%)
Ancestries Reported - Irish (%)
Ancestries Reported - Italian (%)
Ancestries Reported - Lithuanian (%)
Ancestries Reported - Norwegian (%)
Ancestries Reported - Polish (%)
Ancestries Reported - Portuguese (%)
Ancestries Reported - Russian (%)
Ancestries Reported - Scotch-Irish (%)
Ancestries Reported - Scottish (%)
Ancestries Reported - Slovak (%)
Ancestries Reported - Subsaharan African (%)
Ancestries Reported - Swedish (%)
Ancestries Reported - Swiss (%)
Ancestries Reported - Ukrainian (%)
Ancestries Reported - United States (%)
Ancestries Reported - Welsh (%)
Ancestries Reported - West Indian (%)
Ancestries Reported - Other (%)
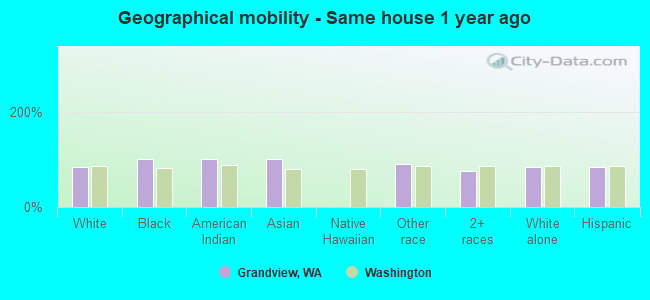
Geographical mobility - Same house 1 year ago (%)
Geographical mobility - Same house 1 year ago (%) - White
Geographical mobility - Same house 1 year ago (%) - Black or African American
Geographical mobility - Same house 1 year ago (%) - Asian
Geographical mobility - Same house 1 year ago (%) - Hispanic or Latino
Geographical mobility - Same house 1 year ago (%) - American Indian and Alaska Native
Geographical mobility - Same house 1 year ago (%) - Multirace
Geographical mobility - Same house 1 year ago (%) - Other Race
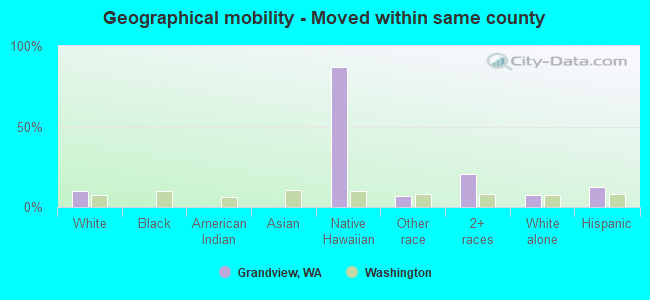
Geographical mobility - Moved within same county (%)
Geographical mobility - Moved within same county (%) - White
Geographical mobility - Moved within same county (%) - Black or African American
Geographical mobility - Moved within same county (%) - Asian
Geographical mobility - Moved within same county (%) - Hispanic or Latino
Geographical mobility - Moved within same county (%) - American Indian and Alaska Native
Geographical mobility - Moved within same county (%) - Multirace
Geographical mobility - Moved within same county (%) - Other Race
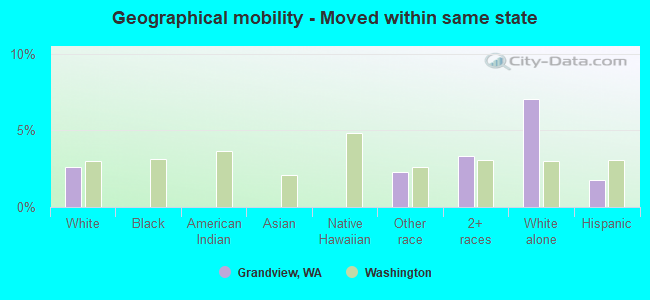
Geographical mobility - Moved from different county within same state (%)
Geographical mobility - Moved from different county within same state (%) - White
Geographical mobility - Moved from different county within same state (%) - Black or African American
Geographical mobility - Moved from different county within same state (%) - Asian
Geographical mobility - Moved from different county within same state (%) - Hispanic or Latino
Geographical mobility - Moved from different county within same state (%) - American Indian and Alaska Native
Geographical mobility - Moved from different county within same state (%) - Multirace
Geographical mobility - Moved from different county within same state (%) - Other Race
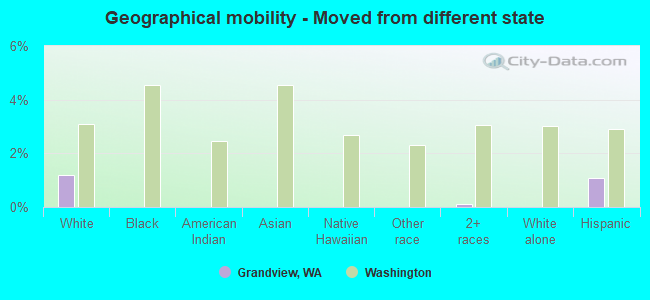
Geographical mobility - Moved from different state (%)
Geographical mobility - Moved from different state (%) - White
Geographical mobility - Moved from different state (%) - Black or African American
Geographical mobility - Moved from different state (%) - Asian
Geographical mobility - Moved from different state (%) - Hispanic or Latino
Geographical mobility - Moved from different state (%) - American Indian and Alaska Native
Geographical mobility - Moved from different state (%) - Multirace
Geographical mobility - Moved from different state (%) - Other Race
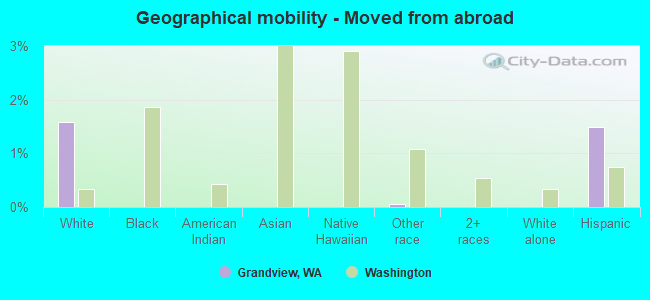
Geographical mobility - Moved from abroad (%)
Geographical mobility - Moved from abroad (%) - White
Geographical mobility - Moved from abroad (%) - Black or African American
Geographical mobility - Moved from abroad (%) - Asian
Geographical mobility - Moved from abroad (%) - Hispanic or Latino
Geographical mobility - Moved from abroad (%) - American Indian and Alaska Native
Geographical mobility - Moved from abroad (%) - Multirace
Geographical mobility - Moved from abroad (%) - Other Race
Place of birth for the foreign-born population - Ireland (%)
Place of birth for the foreign-born population - Denmark (%)
Place of birth for the foreign-born population - Norway (%)
Place of birth for the foreign-born population - Sweden (%)
Place of birth for the foreign-born population - United Kingdom (%)
Place of birth for the foreign-born population - England (%)
Place of birth for the foreign-born population - Scotland (%)
Place of birth for the foreign-born population - Other Northern Europe (%)
Place of birth for the foreign-born population - Austria (%)
Place of birth for the foreign-born population - Belgium (%)
Place of birth for the foreign-born population - France (%)
Place of birth for the foreign-born population - Germany (%)
Place of birth for the foreign-born population - Netherlands (%)
Place of birth for the foreign-born population - Switzerland (%)
Place of birth for the foreign-born population - Other Western Europe (%)
Place of birth for the foreign-born population - Greece (%)
Place of birth for the foreign-born population - Italy (%)
Place of birth for the foreign-born population - Portugal (%)
Place of birth for the foreign-born population - Spain (%)
Place of birth for the foreign-born population - Other Southern Europe (%)
Place of birth for the foreign-born population - Albania (%)
Place of birth for the foreign-born population - Belarus (%)
Place of birth for the foreign-born population - Bosnia and Herzegovina (%)
Place of birth for the foreign-born population - Bulgaria (%)
Place of birth for the foreign-born population - Croatia (%)
Place of birth for the foreign-born population - Czechoslovakia (%)
Place of birth for the foreign-born population - Hungary (%)
Place of birth for the foreign-born population - Latvia (%)
Place of birth for the foreign-born population - Lithuania (%)
Place of birth for the foreign-born population - North Macedonia (Macedonia) (%)
Place of birth for the foreign-born population - Moldova (%)
Place of birth for the foreign-born population - Poland (%)
Place of birth for the foreign-born population - Romania (%)
Place of birth for the foreign-born population - Russia (%)
Place of birth for the foreign-born population - Serbia (%)
Place of birth for the foreign-born population - Ukraine (%)
Place of birth for the foreign-born population - Other Eastern Europe (%)
Place of birth for the foreign-born population - China (%)
Place of birth for the foreign-born population - Hong Kong (%)
Place of birth for the foreign-born population - Taiwan (%)
Place of birth for the foreign-born population - Japan (%)
Place of birth for the foreign-born population - Korea (%)
Place of birth for the foreign-born population - Other Eastern Asia (%)
Place of birth for the foreign-born population - Afghanistan (%)
Place of birth for the foreign-born population - Bangladesh (%)
Place of birth for the foreign-born population - India (%)
Place of birth for the foreign-born population - Iran (%)
Place of birth for the foreign-born population - Kazakhstan (%)
Place of birth for the foreign-born population - Nepal (%)
Place of birth for the foreign-born population - Pakistan (%)
Place of birth for the foreign-born population - Sri Lanka (%)
Place of birth for the foreign-born population - Uzbekistan (%)
Place of birth for the foreign-born population - Other South Central Asia (%)
Place of birth for the foreign-born population - Burma (%)
Place of birth for the foreign-born population - Cambodia (%)
Place of birth for the foreign-born population - Indonesia (%)
Place of birth for the foreign-born population - Laos (%)
Place of birth for the foreign-born population - Malaysia (%)
Place of birth for the foreign-born population - Philippines (%)
Place of birth for the foreign-born population - Singapore (%)
Place of birth for the foreign-born population - Thailand (%)
Place of birth for the foreign-born population - Vietnam (%)
Place of birth for the foreign-born population - Other South Eastern Asia (%)
Place of birth for the foreign-born population - Armenia (%)
Place of birth for the foreign-born population - Iraq (%)
Place of birth for the foreign-born population - Israel (%)
Place of birth for the foreign-born population - Jordan (%)
Place of birth for the foreign-born population - Kuwait (%)
Place of birth for the foreign-born population - Lebanon (%)
Place of birth for the foreign-born population - Saudi Arabia (%)
Place of birth for the foreign-born population - Syria (%)
Place of birth for the foreign-born population - Turkey (%)
Place of birth for the foreign-born population - Yemen (%)
Place of birth for the foreign-born population - Other Western Asia (%)
Place of birth for the foreign-born population - Eritrea (%)
Place of birth for the foreign-born population - Ethiopia (%)
Place of birth for the foreign-born population - Kenya (%)
Place of birth for the foreign-born population - Somalia (%)
Place of birth for the foreign-born population - Uganda (%)
Place of birth for the foreign-born population - Zimbabwe (%)
Place of birth for the foreign-born population - Other Eastern Africa (%)
Place of birth for the foreign-born population - Cameroon (%)
Place of birth for the foreign-born population - Congo (%)
Place of birth for the foreign-born population - Democratic Republic of Congo (Zaire) (%)
Place of birth for the foreign-born population - Other Middle Africa (%)
Place of birth for the foreign-born population - Egypt (%)
Place of birth for the foreign-born population - Morocco (%)
Place of birth for the foreign-born population - Sudan (%)
Place of birth for the foreign-born population - Other Northern Africa (%)
Place of birth for the foreign-born population - South Africa (%)
Place of birth for the foreign-born population - Other Southern Africa (%)
Place of birth for the foreign-born population - Cabo Verde (%)
Place of birth for the foreign-born population - Ghana (%)
Place of birth for the foreign-born population - Liberia (%)
Place of birth for the foreign-born population - Nigeria (%)
Place of birth for the foreign-born population - Senegal (%)
Place of birth for the foreign-born population - Sierra Leone (%)
Place of birth for the foreign-born population - Other Western Africa (%)
Place of birth for the foreign-born population - Australia (%)
Place of birth for the foreign-born population - New Zealand (%)
Place of birth for the foreign-born population - Fiji (%)
Place of birth for the foreign-born population - Micronesia (%)
Place of birth for the foreign-born population - Bahamas (%)
Place of birth for the foreign-born population - Barbados (%)
Place of birth for the foreign-born population - Cuba (%)
Place of birth for the foreign-born population - Dominica (%)
Place of birth for the foreign-born population - Dominican Republic (%)
Place of birth for the foreign-born population - Grenada (%)
Place of birth for the foreign-born population - Haiti (%)
Place of birth for the foreign-born population - Jamaica (%)
Place of birth for the foreign-born population - St. Vincent and the Grenadines (%)
Place of birth for the foreign-born population - Trinidad and Tobago (%)
Place of birth for the foreign-born population - West Indies (%)
Place of birth for the foreign-born population - Other Caribbean (%)
Place of birth for the foreign-born population - Belize (%)
Place of birth for the foreign-born population - Costa Rica (%)
Place of birth for the foreign-born population - El Salvador (%)
Place of birth for the foreign-born population - Guatemala (%)
Place of birth for the foreign-born population - Honduras (%)
Place of birth for the foreign-born population - Mexico (%)
Place of birth for the foreign-born population - Nicaragua (%)
Place of birth for the foreign-born population - Panama (%)
Place of birth for the foreign-born population - Other Central America (%)
Place of birth for the foreign-born population - Argentina (%)
Place of birth for the foreign-born population - Bolivia (%)
Place of birth for the foreign-born population - Brazil (%)
Place of birth for the foreign-born population - Chile (%)
Place of birth for the foreign-born population - Colombia (%)
Place of birth for the foreign-born population - Ecuador (%)
Place of birth for the foreign-born population - Guyana (%)
Place of birth for the foreign-born population - Peru (%)
Place of birth for the foreign-born population - Uruguay (%)
Place of birth for the foreign-born population - Venezuela (%)
Place of birth for the foreign-born population - Other South America (%)
Place of birth for the foreign-born population - Canada (%)
Place of birth for the foreign-born population - Other Northern America (%)
Place of birth for the foreign-born population - Other (%)
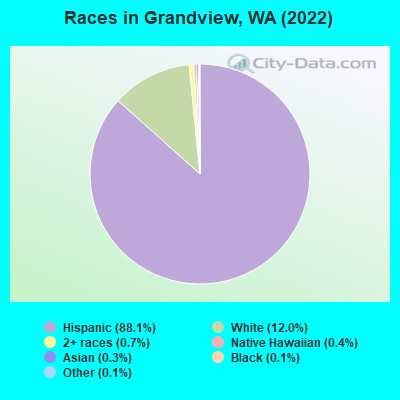
According to 2022 data, the most numerous races in Grandview, WA are White alone (1,310 residents), Hispanic (9,655 residents), and Asian alone (36 residents). 27.2% of Grandview residents speak English at home. 31.0% of Grandview, WA residents are foreign-born (29.2% born in Latin America), which is 51.6% greater than the foreign-born rate of 15.0% across the entire state of Washington.
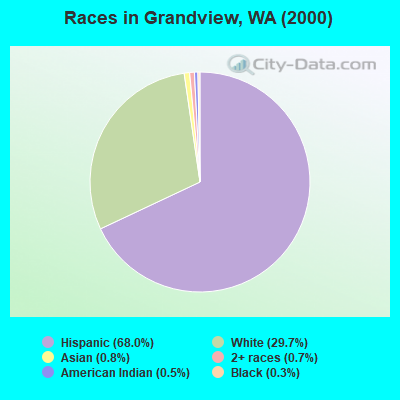
Race distribution in Grandview
2000 2022
4,652,490 78.9% White alone 441,509 7.5% Hispanic 319,401 5.4% Asian alone 184,631 3.1% Black alone 175,926 3.0% Two or more races 85,396 1.4% American Indian alone 22,779 0.4% Native Hawaiian and Other 11,989 0.2% Other race alone
4,941,456 63.5% White alone 1,093,313 14.0% Hispanic 755,832 9.7% Asian alone 523,448 6.7% Two or more races 299,537 3.8% Black alone 69,024 0.9% American Indian alone 52,231 0.7% Native Hawaiian and Other 50,945 0.7% Other race alone
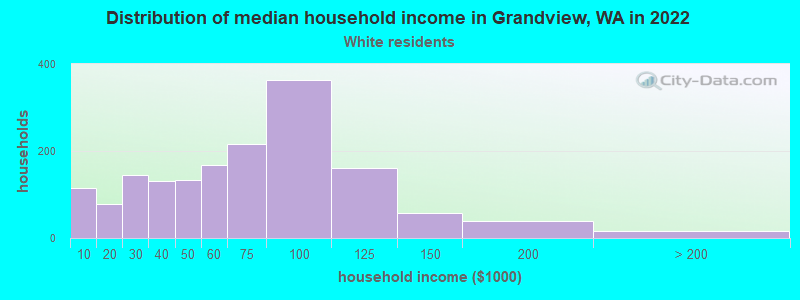
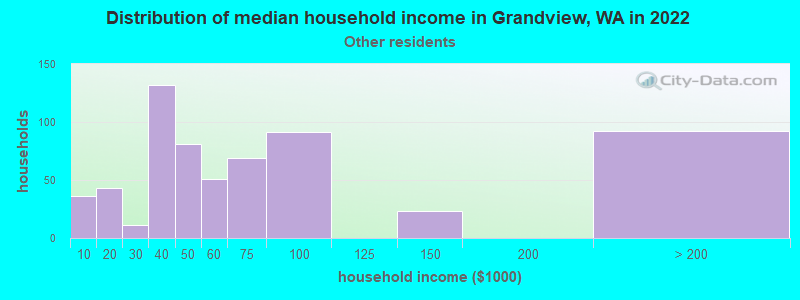
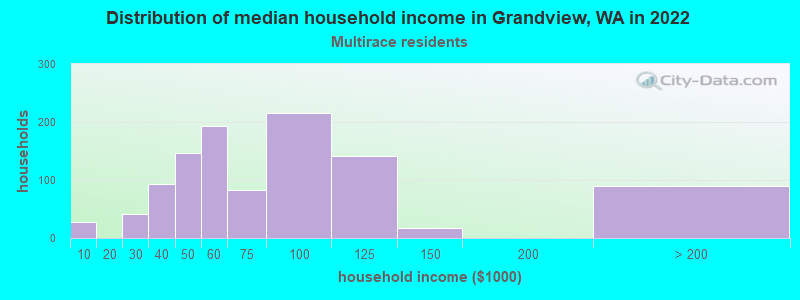
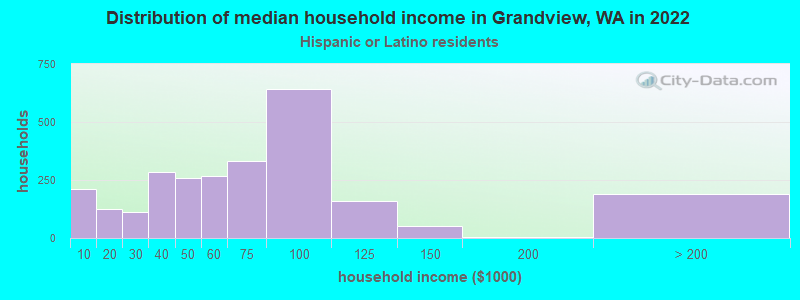
Income and house value in Grandview Median household income in 2022 $52,494 White non-Hispanic householders$46,711 Some other race householders$55,074 Two or more races householders$61,555 Hispanic or Latino race householdersMedian 2022 house value $249,997 White Non-Hispanic householders $266,552 Asian householders$225,306 Some other race householders$303,869 Two or more races householders$229,515 Hispanic or Latino householders
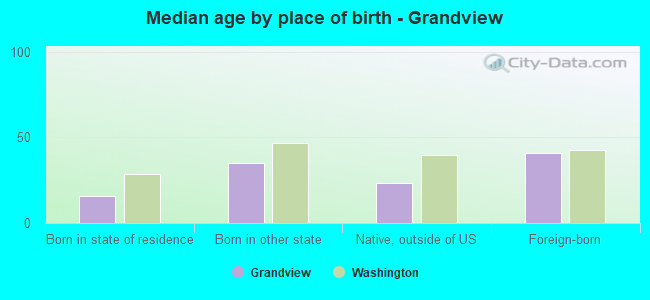
Median age by race in Grandview
30.2 Median age for White residents32.5 27.0 16.2 Median age for Black or African American residents-684,418,145.3 16.6 32.7 Median age for American Indian / Alaska Native residents-574,324,323.8 22.0 36.4 Median age for Asian residents43.2 -657,428,790.7 -681,388,011.9 Median age for Native Hawaiian / Pacific Islander residents-696,774,192.9 -666,666,666.0 27.4 Median age for Other race residents28.7 29.0 27.2 Median age for Two or more races residents27.6 27.5 50.2 Median age for White alone residents50.5 50.3 24.5 Median age for Hispanic or Latino residents24.6 24.5
Owner/renter occupied households by race in Grandview
House owners and renters - White residents 957 59.3% Owner occupied657 40.7% Renter occupiedHouse owners and renters - American Indian / Alaska Native residents 6 100.0% Renter occupiedHouse owners and renters - Asian residents 8 100.0% Owner occupiedHouse owners and renters - Other race residents 431 71.6% Owner occupied171 28.4% Renter occupiedHouse owners and renters - Two or more races residents 522 45.9% Owner occupied614 54.1% Renter occupiedHouse owners and renters - White alone residents 405 66.4% Owner occupied205 33.6% Renter occupiedHouse owners and renters - Hispanic or Latino residents 1,349 51.7% Owner occupied1,260 48.3% Renter occupied
Language usage in Grandview
English speakers - Total 27.2% of residents of Grandview speak English at home.
71.5% of residents speak Spanish at home 4,175 59.5% Speak English very well2,843 40.5% Speak English less than very well1.4% of residents speak other language at home 102 75.0% Speak English very well34 25.0% Speak English less than very well
English speakers - Born in the United States 52.8% of residents of Grandview speak English at home.
53.4% of residents speak Spanish at home 539 96.2% Speak English very well21 3.8% Speak English less than very well0.9% of residents speak other language at home 9 100.0% Speak English very well
English speakers - Native, born elsewhere 12.6% of residents of Grandview speak English at home.
33.3% of residents speak Spanish at home 45 100.0% Speak English very well23.7% of residents speak other language at home 19 59.4% Speak English very well13 40.6% Speak English less than very well
English speakers - Foreign-born 2.7% of residents of Grandview speak English at home.
94.6% of residents speak Spanish at home 822 27.3% Speak English very well2,187 72.7% Speak English less than very well0.8% of residents speak other language at home 12 44.4% Speak English very well15 55.6% Speak English less than very well
White (Caucasian) - Speak only English Native:
49.7% (1,750)Foreign-born:
1.9% (28)
White (Caucasian) - Speak another language Native:
28.0% (986)Foreign-born:
94.4% (1,407)
American Indian / Alaska Native - Speak another language Native:
100.0% (10)Foreign-born:
53.8% (7)
Other race - Speak only English Native:
17.5% (187)Foreign-born:
3.2% (26)
Other race - Speak another language Native:
84.4% (905)Foreign-born:
96.4% (788)
Two or more races - Speak only English Native:
27.9% (600)Foreign-born:
3.4% (38)
Two or more races - Speak another language Native:
76.4% (1,642)Foreign-born:
96.4% (1,079)
White alone - Speak another language Native:
4.9% (60)Foreign-born:
100.0% (41)
Hispanic or Latino - Speak only English Native:
24.5% (1,326)Foreign-born:
3.2% (99)
Hispanic or Latino - Speak another language Native:
75.8% (4,103)Foreign-born:
96.0% (3,020)
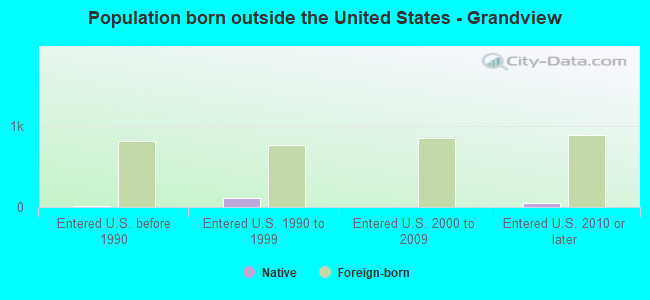
Foreign-born residents in Grandview 3,393 residents are foreign born (29.2% Latin America ).
This city:
31.0%Washington:
14.9%
Marital status for residents in Grandview Marital status - White (Caucasian) population 15 years and over
Males 44.6% Never married42.3% Now married4.3% Separated2.5% Widowed6.3% DivorcedFemales 43.0% Never married43.9% Now married1.5% Separated2.9% Widowed8.7% DivorcedWomen who gave birth in the past 12 months Now married:
26.5% (28)Unmarried:
73.5% (77)
Women who did not give birth in the past 12 months Now married:
38.5% (422)Unmarried:
61.5% (674)
Marital status - American Indian / Alaska Native population 15 years and over
Males 0.0% Never married83.3% Now married16.7% Separated0.0% Widowed0.0% DivorcedFemales 53.8% Never married46.2% Now married0.0% Separated0.0% Widowed0.0% DivorcedWomen who did not give birth in the past 12 months Now married:
36.4% (6)Unmarried:
63.6% (11)
Marital status - Asian population 15 years and over
Males 29.6% Never married70.4% Now married0.0% Separated0.0% Widowed0.0% DivorcedFemales 0.0% Never married100.0% Now married0.0% Separated0.0% Widowed0.0% DivorcedWomen who gave birth in the past 12 months Now married:
100.0% (5)Unmarried:
0.0% (0)
Women who did not give birth in the past 12 months Now married:
100.0% (5)Unmarried:
0.0% (0)
Marital status - Other race population 15 years and over
Males 34.3% Never married65.7% Now married0.0% Separated0.0% Widowed0.0% DivorcedFemales 38.1% Never married48.8% Now married3.2% Separated8.7% Widowed1.1% DivorcedWomen who gave birth in the past 12 months Now married:
100.0% (39)Unmarried:
0.0% (0)
Women who did not give birth in the past 12 months Now married:
46.4% (286)Unmarried:
53.6% (330)
Marital status - Two or more races population 15 years and over
Males 56.0% Never married29.3% Now married0.0% Separated0.0% Widowed14.7% DivorcedFemales 57.6% Never married31.2% Now married4.3% Separated2.3% Widowed4.6% DivorcedWomen who gave birth in the past 12 months Now married:
26.7% (13)Unmarried:
73.3% (35)
Women who did not give birth in the past 12 months Now married:
24.2% (197)Unmarried:
75.8% (617)
Marital status - White alone, not Hispanic / Latino population 15 years and over
Males 27.5% Never married39.7% Now married6.5% Separated5.9% Widowed20.4% DivorcedFemales 21.3% Never married47.4% Now married0.0% Separated11.8% Widowed19.5% DivorcedWomen who did not give birth in the past 12 months Now married:
39.8% (82)Unmarried:
60.2% (124)
Marital status - Hispanic or Latino population 15 years and over
Males 48.7% Never married45.4% Now married1.9% Separated0.6% Widowed3.5% DivorcedFemales 50.1% Never married40.9% Now married2.9% Separated2.7% Widowed3.4% DivorcedWomen who gave birth in the past 12 months Now married:
39.6% (82)Unmarried:
60.4% (126)
Women who did not give birth in the past 12 months Now married:
36.2% (853)Unmarried:
63.8% (1,501)
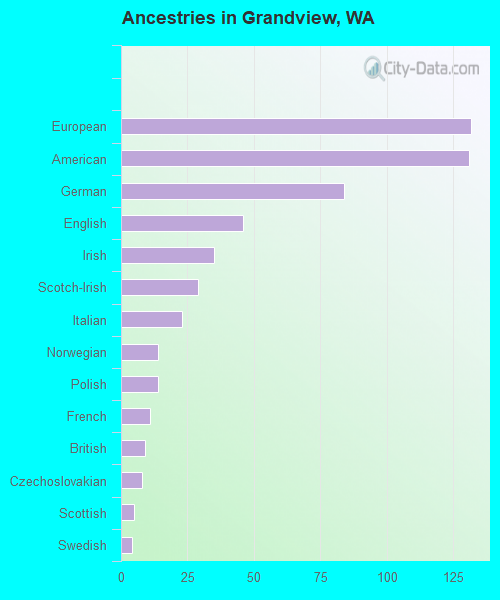
Ancestries in Grandview
132 1.5% European131 1.5% American84 1.0% German46 0.5% English35 0.4% Irish29 0.3% Scotch-Irish23 0.3% Italian14 0.2% Norwegian14 0.2% Polish11 0.1% French9 0.1% British8 0.09% Czechoslovakian5 0.06% Scottish4 0.05% Swedish
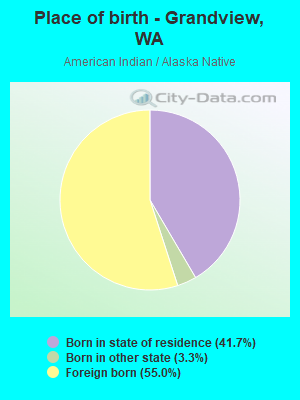
Children Nativity (place of birth) in Grandview
Children under 6 years - Living with two parents Both parents native 12 100.0% NativeBoth parents foreign-born 188 85.9% Native31 14.1% Foreign-bornOne native, one foreign-born parent 265 100.0% NativeChildren under 6 years - Living with one parent Native parent 405 94.5% Native23 5.5% Foreign-bornForeign-born parent 304 82.0% Native67 18.0% Foreign-bornChildren 6 to 17 years - Living with two parents Both parents native 279 99.2% Native2 0.8% Foreign-bornBoth parents foreign-born 680 95.5% Native32 4.5% Foreign-bornOne native, one foreign-born parent 231 100.0% NativeChildren 6 to 17 years - Living with one parent Native parent 815 100.0% NativeForeign-born parent 851 49.3% Native877 50.7% Foreign-born
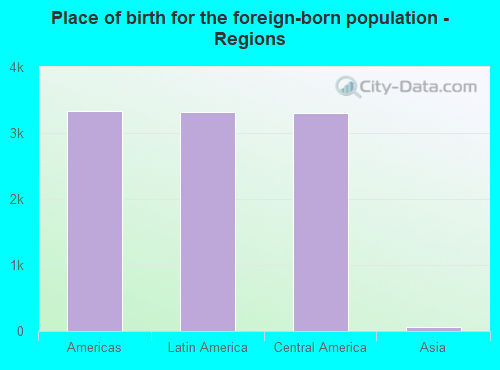
Place of birth for residents in Grandview 3,339 Americas3,318 Latin America3,308 Central America54 Asia28 Eastern Asia20 Northern America19 China15 South Central Asia10 South Eastern Asia10 Caribbean
Grandparents responsible for own grandchildren in Grandview
Grandparents (30 to 59 years) White / Caucasian 87 100.0% Not responsible for grandchildrenAmerican Indian / Alaska Native 5 100.0% Not responsible for grandchildrenOther race 62 100.0% Not responsible for grandchildrenTwo or more races 14 100.0% Not responsible for grandchildrenWhite alone, not Hispanic / Latino 16 100.0% Not responsible for grandchildrenHispanic or Latino 132 100.0% Not responsible for grandchildrenGrandparents (60 years and over) White / Caucasian 8 15.7% Responsible for grandchildren45 84.3% Not responsible for grandchildrenWhite alone, not Hispanic / Latino 12 100.0% Not responsible for grandchildrenHispanic or Latino 7 20.9% Responsible for grandchildren25 79.1% Not responsible for grandchildren