Races in Greenville, Texas (TX) Detailed Stats
Data:
Races - White alone (%)
Races - White alone (% change since 2000)
Races - Black alone (%)
Races - Black alone (% change since 2000)
Races - American Indian alone (%)
Races - American Indian alone (% change since 2000)
Races - Asian alone (%)
Races - Asian alone (% change since 2000)
Races - Hispanic (%)
Races - Hispanic (% change since 2000)
Races - Native Hawaiian and Other Pacific Islander alone (%)
Races - Native Hawaiian and Other Pacific Islander alone (% change since 2000)
Races - Two or more races(%)
Races - Two or more races(% change since 2000)
Races - Other race alone (%)
Races - Other race alone (% change since 2000)
Racial diversity
Place of birth - Born in state of residence (%)
Place of birth - Born in state of residence (%) - White
Place of birth - Born in state of residence (%) - Black or African American
Place of birth - Born in state of residence (%) - Asian
Place of birth - Born in state of residence (%) - Hispanic or Latino
Place of birth - Born in state of residence (%) - American Indian and Alaska Native
Place of birth - Born in state of residence (%) - Multirace
Place of birth - Born in state of residence (%) - Other Race
Place of birth - Born in other state (%)
Place of birth - Born in other state (%) - White
Place of birth - Born in other state (%) - Black or African American
Place of birth - Born in other state (%) - Asian
Place of birth - Born in other state (%) - Hispanic or Latino
Place of birth - Born in other state (%) - American Indian and Alaska Native
Place of birth - Born in other state (%) - Multirace
Place of birth - Born in other state (%) - Other Race
Place of birth - Native, outside of US (%)
Place of birth - Native, outside of US (%) - White
Place of birth - Native, outside of US (%) - Black or African American
Place of birth - Native, outside of US (%) - Asian
Place of birth - Native, outside of US (%) - Hispanic or Latino
Place of birth - Native, outside of US (%) - American Indian and Alaska Native
Place of birth - Native, outside of US (%) - Multirace
Place of birth - Native, outside of US (%) - Other Race
Place of birth - Foreign born (%)
Place of birth - Foreign born (%) - White
Place of birth - Foreign born (%) - Black or African American
Place of birth - Foreign born (%) - Asian
Place of birth - Foreign born (%) - Hispanic or Latino
Place of birth - Foreign born (%) - American Indian and Alaska Native
Place of birth - Foreign born (%) - Multirace
Place of birth - Foreign born (%) - Other Race
Residents speaking English at home (%)
Residents speaking English at home - Born in the United States (%)
Residents speaking English at home - Native, born elsewhere (%)
Residents speaking English at home - Foreign born (%)
Residents speaking Spanish at home (%)
Residents speaking Spanish at home - Born in the United States (%)
Residents speaking Spanish at home - Native, born elsewhere (%)
Residents speaking Spanish at home - Foreign born (%)
Residents speaking other language at home (%)
Residents speaking other language at home - Born in the United States (%)
Residents speaking other language at home - Native, born elsewhere (%)
Residents speaking other language at home - Foreign born (%)
Marital status - Never married (%)
Marital status - Now married (%)
Marital status - Separated (%)
Marital status - Widowed (%)
Marital status - Divorced (%)
Ancestries Reported - Arab (%)
Ancestries Reported - Czech (%)
Ancestries Reported - Danish (%)
Ancestries Reported - Dutch (%)
Ancestries Reported - English (%)
Ancestries Reported - French (%)
Ancestries Reported - French Canadian (%)
Ancestries Reported - German (%)
Ancestries Reported - Greek (%)
Ancestries Reported - Hungarian (%)
Ancestries Reported - Irish (%)
Ancestries Reported - Italian (%)
Ancestries Reported - Lithuanian (%)
Ancestries Reported - Norwegian (%)
Ancestries Reported - Polish (%)
Ancestries Reported - Portuguese (%)
Ancestries Reported - Russian (%)
Ancestries Reported - Scotch-Irish (%)
Ancestries Reported - Scottish (%)
Ancestries Reported - Slovak (%)
Ancestries Reported - Subsaharan African (%)
Ancestries Reported - Swedish (%)
Ancestries Reported - Swiss (%)
Ancestries Reported - Ukrainian (%)
Ancestries Reported - United States (%)
Ancestries Reported - Welsh (%)
Ancestries Reported - West Indian (%)
Ancestries Reported - Other (%)
Geographical mobility - Same house 1 year ago (%)
Geographical mobility - Same house 1 year ago (%) - White
Geographical mobility - Same house 1 year ago (%) - Black or African American
Geographical mobility - Same house 1 year ago (%) - Asian
Geographical mobility - Same house 1 year ago (%) - Hispanic or Latino
Geographical mobility - Same house 1 year ago (%) - American Indian and Alaska Native
Geographical mobility - Same house 1 year ago (%) - Multirace
Geographical mobility - Same house 1 year ago (%) - Other Race
Geographical mobility - Moved within same county (%)
Geographical mobility - Moved within same county (%) - White
Geographical mobility - Moved within same county (%) - Black or African American
Geographical mobility - Moved within same county (%) - Asian
Geographical mobility - Moved within same county (%) - Hispanic or Latino
Geographical mobility - Moved within same county (%) - American Indian and Alaska Native
Geographical mobility - Moved within same county (%) - Multirace
Geographical mobility - Moved within same county (%) - Other Race
Geographical mobility - Moved from different county within same state (%)
Geographical mobility - Moved from different county within same state (%) - White
Geographical mobility - Moved from different county within same state (%) - Black or African American
Geographical mobility - Moved from different county within same state (%) - Asian
Geographical mobility - Moved from different county within same state (%) - Hispanic or Latino
Geographical mobility - Moved from different county within same state (%) - American Indian and Alaska Native
Geographical mobility - Moved from different county within same state (%) - Multirace
Geographical mobility - Moved from different county within same state (%) - Other Race
Geographical mobility - Moved from different state (%)
Geographical mobility - Moved from different state (%) - White
Geographical mobility - Moved from different state (%) - Black or African American
Geographical mobility - Moved from different state (%) - Asian
Geographical mobility - Moved from different state (%) - Hispanic or Latino
Geographical mobility - Moved from different state (%) - American Indian and Alaska Native
Geographical mobility - Moved from different state (%) - Multirace
Geographical mobility - Moved from different state (%) - Other Race
Geographical mobility - Moved from abroad (%)
Geographical mobility - Moved from abroad (%) - White
Geographical mobility - Moved from abroad (%) - Black or African American
Geographical mobility - Moved from abroad (%) - Asian
Geographical mobility - Moved from abroad (%) - Hispanic or Latino
Geographical mobility - Moved from abroad (%) - American Indian and Alaska Native
Geographical mobility - Moved from abroad (%) - Multirace
Geographical mobility - Moved from abroad (%) - Other Race
Place of birth for the foreign-born population - Ireland (%)
Place of birth for the foreign-born population - Denmark (%)
Place of birth for the foreign-born population - Norway (%)
Place of birth for the foreign-born population - Sweden (%)
Place of birth for the foreign-born population - United Kingdom (%)
Place of birth for the foreign-born population - England (%)
Place of birth for the foreign-born population - Scotland (%)
Place of birth for the foreign-born population - Other Northern Europe (%)
Place of birth for the foreign-born population - Austria (%)
Place of birth for the foreign-born population - Belgium (%)
Place of birth for the foreign-born population - France (%)
Place of birth for the foreign-born population - Germany (%)
Place of birth for the foreign-born population - Netherlands (%)
Place of birth for the foreign-born population - Switzerland (%)
Place of birth for the foreign-born population - Other Western Europe (%)
Place of birth for the foreign-born population - Greece (%)
Place of birth for the foreign-born population - Italy (%)
Place of birth for the foreign-born population - Portugal (%)
Place of birth for the foreign-born population - Spain (%)
Place of birth for the foreign-born population - Other Southern Europe (%)
Place of birth for the foreign-born population - Albania (%)
Place of birth for the foreign-born population - Belarus (%)
Place of birth for the foreign-born population - Bosnia and Herzegovina (%)
Place of birth for the foreign-born population - Bulgaria (%)
Place of birth for the foreign-born population - Croatia (%)
Place of birth for the foreign-born population - Czechoslovakia (%)
Place of birth for the foreign-born population - Hungary (%)
Place of birth for the foreign-born population - Latvia (%)
Place of birth for the foreign-born population - Lithuania (%)
Place of birth for the foreign-born population - North Macedonia (Macedonia) (%)
Place of birth for the foreign-born population - Moldova (%)
Place of birth for the foreign-born population - Poland (%)
Place of birth for the foreign-born population - Romania (%)
Place of birth for the foreign-born population - Russia (%)
Place of birth for the foreign-born population - Serbia (%)
Place of birth for the foreign-born population - Ukraine (%)
Place of birth for the foreign-born population - Other Eastern Europe (%)
Place of birth for the foreign-born population - China (%)
Place of birth for the foreign-born population - Hong Kong (%)
Place of birth for the foreign-born population - Taiwan (%)
Place of birth for the foreign-born population - Japan (%)
Place of birth for the foreign-born population - Korea (%)
Place of birth for the foreign-born population - Other Eastern Asia (%)
Place of birth for the foreign-born population - Afghanistan (%)
Place of birth for the foreign-born population - Bangladesh (%)
Place of birth for the foreign-born population - India (%)
Place of birth for the foreign-born population - Iran (%)
Place of birth for the foreign-born population - Kazakhstan (%)
Place of birth for the foreign-born population - Nepal (%)
Place of birth for the foreign-born population - Pakistan (%)
Place of birth for the foreign-born population - Sri Lanka (%)
Place of birth for the foreign-born population - Uzbekistan (%)
Place of birth for the foreign-born population - Other South Central Asia (%)
Place of birth for the foreign-born population - Burma (%)
Place of birth for the foreign-born population - Cambodia (%)
Place of birth for the foreign-born population - Indonesia (%)
Place of birth for the foreign-born population - Laos (%)
Place of birth for the foreign-born population - Malaysia (%)
Place of birth for the foreign-born population - Philippines (%)
Place of birth for the foreign-born population - Singapore (%)
Place of birth for the foreign-born population - Thailand (%)
Place of birth for the foreign-born population - Vietnam (%)
Place of birth for the foreign-born population - Other South Eastern Asia (%)
Place of birth for the foreign-born population - Armenia (%)
Place of birth for the foreign-born population - Iraq (%)
Place of birth for the foreign-born population - Israel (%)
Place of birth for the foreign-born population - Jordan (%)
Place of birth for the foreign-born population - Kuwait (%)
Place of birth for the foreign-born population - Lebanon (%)
Place of birth for the foreign-born population - Saudi Arabia (%)
Place of birth for the foreign-born population - Syria (%)
Place of birth for the foreign-born population - Turkey (%)
Place of birth for the foreign-born population - Yemen (%)
Place of birth for the foreign-born population - Other Western Asia (%)
Place of birth for the foreign-born population - Eritrea (%)
Place of birth for the foreign-born population - Ethiopia (%)
Place of birth for the foreign-born population - Kenya (%)
Place of birth for the foreign-born population - Somalia (%)
Place of birth for the foreign-born population - Uganda (%)
Place of birth for the foreign-born population - Zimbabwe (%)
Place of birth for the foreign-born population - Other Eastern Africa (%)
Place of birth for the foreign-born population - Cameroon (%)
Place of birth for the foreign-born population - Congo (%)
Place of birth for the foreign-born population - Democratic Republic of Congo (Zaire) (%)
Place of birth for the foreign-born population - Other Middle Africa (%)
Place of birth for the foreign-born population - Egypt (%)
Place of birth for the foreign-born population - Morocco (%)
Place of birth for the foreign-born population - Sudan (%)
Place of birth for the foreign-born population - Other Northern Africa (%)
Place of birth for the foreign-born population - South Africa (%)
Place of birth for the foreign-born population - Other Southern Africa (%)
Place of birth for the foreign-born population - Cabo Verde (%)
Place of birth for the foreign-born population - Ghana (%)
Place of birth for the foreign-born population - Liberia (%)
Place of birth for the foreign-born population - Nigeria (%)
Place of birth for the foreign-born population - Senegal (%)
Place of birth for the foreign-born population - Sierra Leone (%)
Place of birth for the foreign-born population - Other Western Africa (%)
Place of birth for the foreign-born population - Australia (%)
Place of birth for the foreign-born population - New Zealand (%)
Place of birth for the foreign-born population - Fiji (%)
Place of birth for the foreign-born population - Micronesia (%)
Place of birth for the foreign-born population - Bahamas (%)
Place of birth for the foreign-born population - Barbados (%)
Place of birth for the foreign-born population - Cuba (%)
Place of birth for the foreign-born population - Dominica (%)
Place of birth for the foreign-born population - Dominican Republic (%)
Place of birth for the foreign-born population - Grenada (%)
Place of birth for the foreign-born population - Haiti (%)
Place of birth for the foreign-born population - Jamaica (%)
Place of birth for the foreign-born population - St. Vincent and the Grenadines (%)
Place of birth for the foreign-born population - Trinidad and Tobago (%)
Place of birth for the foreign-born population - West Indies (%)
Place of birth for the foreign-born population - Other Caribbean (%)
Place of birth for the foreign-born population - Belize (%)
Place of birth for the foreign-born population - Costa Rica (%)
Place of birth for the foreign-born population - El Salvador (%)
Place of birth for the foreign-born population - Guatemala (%)
Place of birth for the foreign-born population - Honduras (%)
Place of birth for the foreign-born population - Mexico (%)
Place of birth for the foreign-born population - Nicaragua (%)
Place of birth for the foreign-born population - Panama (%)
Place of birth for the foreign-born population - Other Central America (%)
Place of birth for the foreign-born population - Argentina (%)
Place of birth for the foreign-born population - Bolivia (%)
Place of birth for the foreign-born population - Brazil (%)
Place of birth for the foreign-born population - Chile (%)
Place of birth for the foreign-born population - Colombia (%)
Place of birth for the foreign-born population - Ecuador (%)
Place of birth for the foreign-born population - Guyana (%)
Place of birth for the foreign-born population - Peru (%)
Place of birth for the foreign-born population - Uruguay (%)
Place of birth for the foreign-born population - Venezuela (%)
Place of birth for the foreign-born population - Other South America (%)
Place of birth for the foreign-born population - Canada (%)
Place of birth for the foreign-born population - Other Northern America (%)
Place of birth for the foreign-born population - Other (%)
Latest news about races in Greenville, TX collected exclusively by city-data.com from local newspapers, TV, and radio stations
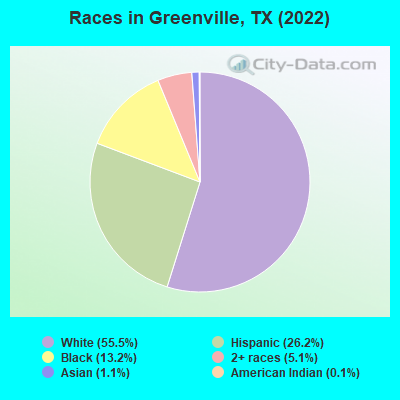
According to 2022 data, the most numerous races in Greenville, TX are Hispanic (8,078 residents), White alone (17,118 residents), and Black alone (4,079 residents). 81.5% of Greenville residents speak English at home. 9.0% of Greenville, TX residents are foreign-born (7.3% born in Latin America, 1.1% born in Asia), which is 89.2% less than the foreign-born rate of 17.0% across the entire state of Texas.
Race distribution in Greenville
2000 2022
10,933,313 52.4% White alone 6,669,666 32.0% Hispanic 2,364,255 11.3% Black alone 554,445 2.7% Asian alone 230,567 1.1% Two or more races 68,859 0.3% American Indian alone 19,958 0.10% Other race alone 10,757 0.05% Native Hawaiian and Other
12,070,642 40.2% Hispanic 11,683,430 38.9% White alone 3,508,706 11.7% Black alone 1,608,173 5.4% Asian alone 956,560 3.2% Two or more races 125,763 0.4% Other race alone 47,023 0.2% American Indian alone 29,275 0.10% Native Hawaiian and Other
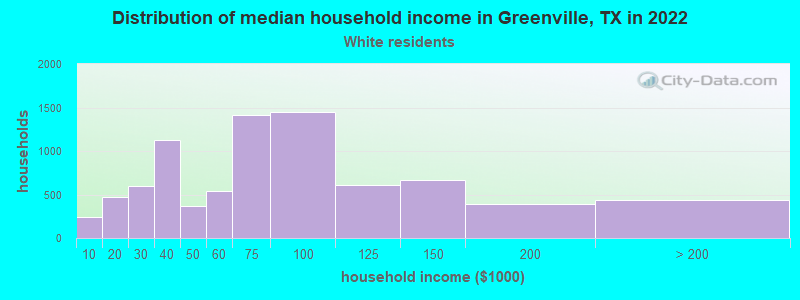
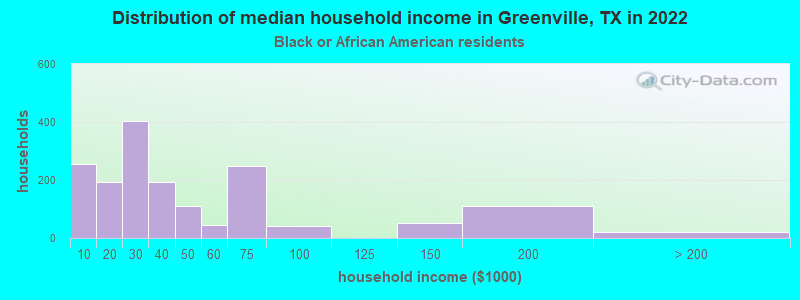
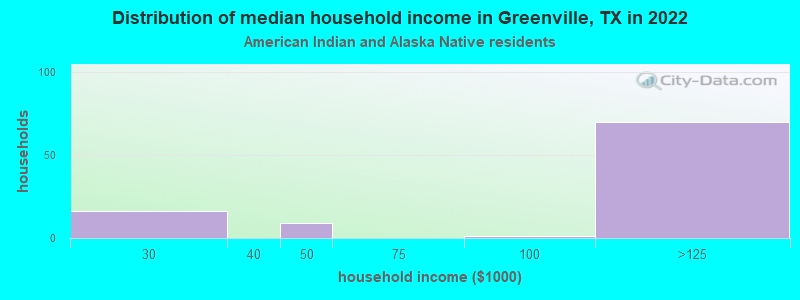
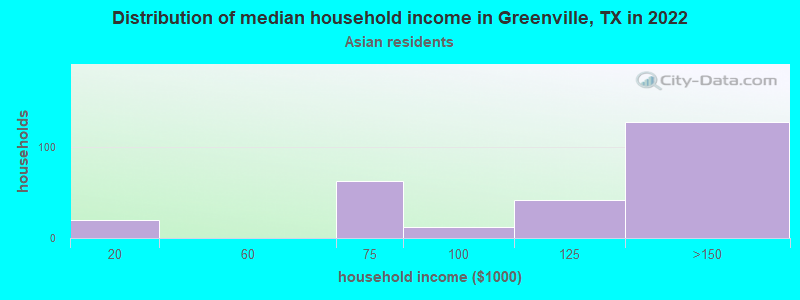
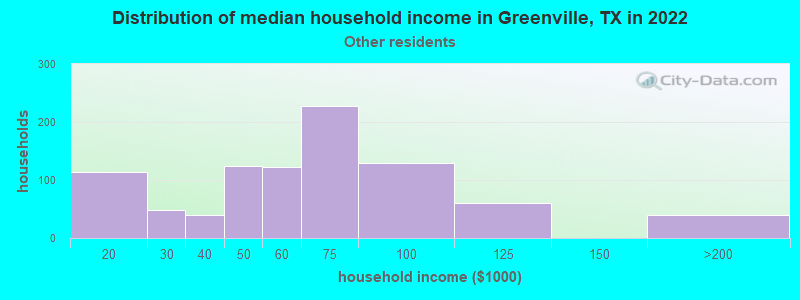
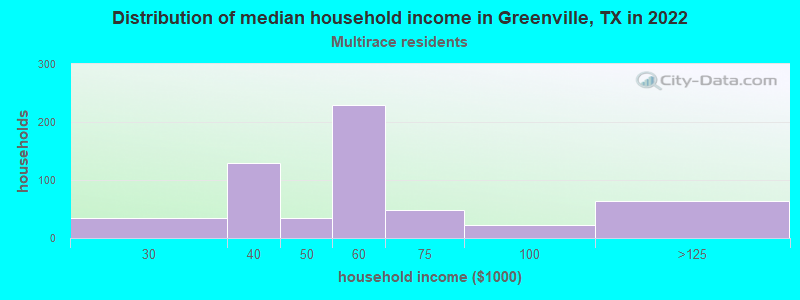
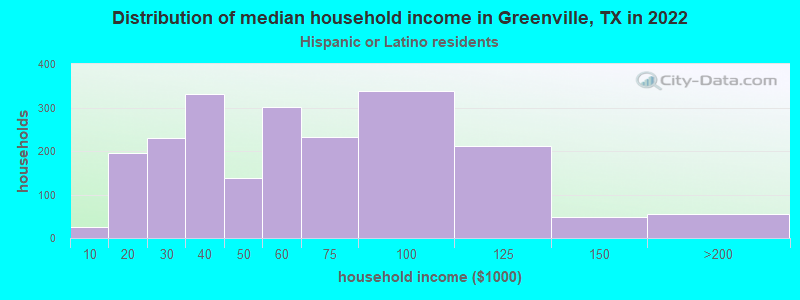
Income and house value in Greenville Median household income in 2022 $65,270 White non-Hispanic householders$49,220 Black householders$120,416 American Indian and Alaska Native householders$195,481 Asian householders$65,851 Some other race householders$62,913 Two or more races householders$57,550 Hispanic or Latino race householdersMedian 2022 house value $280,440 White Non-Hispanic householders$129,879 Black or African American householders$227,496 American Indian or Alaska Native householders $163,797 Asian householders$112,507 Some other race householders$206,814 Two or more races householders$114,988 Hispanic or Latino householders
Median age by race in Greenville
36.4 Median age for White residents36.7 37.8 49.0 Median age for Black or African American residents28.1 64.7 44.8 Median age for American Indian / Alaska Native residents60.1 32.9 34.2 Median age for Asian residents51.8 27.1 -666,666,666.0 Median age for Native Hawaiian / Pacific Islander residents-666,666,666.0 -666,666,666.0 37.3 Median age for Other race residents42.6 36.9 14.5 Median age for Two or more races residents11.2 15.7 37.3 Median age for White alone residents37.0 39.5 29.1 Median age for Hispanic or Latino residents28.0 30.8
Owner/renter occupied households by race in Greenville
House owners and renters - White residents 4,342 52.8% Owner occupied3,878 47.2% Renter occupiedHouse owners and renters - Black or African American residents 745 52.0% Owner occupied689 48.0% Renter occupiedHouse owners and renters - American Indian / Alaska Native residents 91 100.0% Renter occupiedHouse owners and renters - Asian residents 142 55.5% Owner occupied114 44.5% Renter occupiedHouse owners and renters - Other race residents 585 79.0% Owner occupied155 21.0% Renter occupiedHouse owners and renters - Two or more races residents 363 72.9% Owner occupied135 27.1% Renter occupiedHouse owners and renters - White alone residents 3,889 53.4% Owner occupied3,400 46.6% Renter occupiedHouse owners and renters - Hispanic or Latino residents 1,339 67.0% Owner occupied660 33.0% Renter occupied
Language usage in Greenville
English speakers - Total 81.5% of residents of Greenville speak English at home.
16.5% of residents speak Spanish at home 3,356 69.1% Speak English very well1,502 30.9% Speak English less than very well1.7% of residents speak other language at home 429 84.0% Speak English very well82 16.0% Speak English less than very well
English speakers - Born in the United States 92.7% of residents of Greenville speak English at home.
6.3% of residents speak Spanish at home 305 70.0% Speak English very well131 30.0% Speak English less than very well0.1% of residents speak other language at home 7 100.0% Speak English very well
English speakers - Native, born elsewhere 97.9% of residents of Greenville speak English at home.
26.6% of residents speak Spanish at home 136 68.3% Speak English very well63 31.7% Speak English less than very well2.8% of residents speak other language at home 21 100.0% Speak English very well
English speakers - Foreign-born 5.0% of residents of Greenville speak English at home.
76.7% of residents speak Spanish at home 919 45.8% Speak English very well1,088 54.2% Speak English less than very well19.3% of residents speak other language at home 368 73.0% Speak English very well136 27.0% Speak English less than very well
White (Caucasian) - Speak only English Native:
95.7% (16,998)Foreign-born:
3.2% (25)
White (Caucasian) - Speak another language Native:
4.4% (774)Foreign-born:
100.0% (797)
Black or African American - Speak another language Native:
1.5% (55)Foreign-born:
100.0% (114)
Asian - Speak only English Native:
82.7% (42)Foreign-born:
24.1% (81)
Asian - Speak another language Native:
18.0% (9)Foreign-born:
76.3% (256)
Other race - Speak only English Native:
24.1% (360)Foreign-born:
3.3% (39)
Other race - Speak another language Native:
68.7% (1,024)Foreign-born:
80.9% (962)
Two or more races - Speak another language Native:
23.9% (789)Foreign-born:
94.2% (358)
White alone - Speak only English Native:
99.6% (15,744)Foreign-born:
25.5% (30)
White alone - Speak another language Native:
0.6% (95)Foreign-born:
74.5% (88)
Hispanic or Latino - Speak only English Native:
46.5% (2,379)Foreign-born:
1.3% (31)
Hispanic or Latino - Speak another language Native:
53.7% (2,747)Foreign-born:
87.8% (2,052)
Foreign-born residents in Greenville 2,770 residents are foreign born (7.3% Latin America , 1.1% Asia ).
This city:
9.0%Texas:
17.1%
Marital status for residents in Greenville Marital status - White (Caucasian) population 15 years and over
Males 34.6% Never married50.4% Now married1.2% Separated2.1% Widowed11.6% DivorcedFemales 25.8% Never married43.6% Now married2.3% Separated13.4% Widowed14.9% DivorcedWomen who gave birth in the past 12 months Now married:
78.2% (248)Unmarried:
21.8% (69)
Women who did not give birth in the past 12 months Now married:
44.3% (1,936)Unmarried:
55.7% (2,430)
Marital status - Black or African American population 15 years and over
Males 55.6% Never married26.3% Now married3.2% Separated0.0% Widowed14.9% DivorcedFemales 49.4% Never married15.9% Now married1.4% Separated8.8% Widowed24.5% DivorcedWomen who did not give birth in the past 12 months Now married:
10.0% (101)Unmarried:
90.0% (910)
Marital status - American Indian / Alaska Native population 15 years and over
Males 64.4% Never married25.6% Now married0.0% Separated0.0% Widowed10.0% DivorcedFemales 22.2% Never married13.9% Now married0.0% Separated38.9% Widowed25.0% DivorcedWomen who gave birth in the past 12 months Now married:
0.0% (0)Unmarried:
100.0% (11)
Women who did not give birth in the past 12 months Now married:
0.0% (0)Unmarried:
100.0% (11)
Marital status - Asian population 15 years and over
Males 0.0% Never married90.6% Now married0.0% Separated9.4% Widowed0.0% DivorcedFemales 8.0% Never married92.0% Now married0.0% Separated0.0% Widowed0.0% DivorcedWomen who did not give birth in the past 12 months Now married:
86.7% (112)Unmarried:
13.3% (17)
Marital status - Other race population 15 years and over
Males 34.7% Never married47.1% Now married1.1% Separated3.0% Widowed14.1% DivorcedFemales 31.7% Never married62.7% Now married0.0% Separated0.0% Widowed5.6% DivorcedWomen who did not give birth in the past 12 months Now married:
69.5% (488)Unmarried:
30.5% (214)
Marital status - Two or more races population 15 years and over
Males 29.9% Never married69.0% Now married0.0% Separated0.0% Widowed1.1% DivorcedFemales 0.8% Never married68.2% Now married0.0% Separated2.1% Widowed29.0% DivorcedWomen who gave birth in the past 12 months Now married:
69.1% (88)Unmarried:
30.9% (39)
Women who did not give birth in the past 12 months Now married:
72.5% (451)Unmarried:
27.5% (171)
Marital status - White alone, not Hispanic / Latino population 15 years and over
Males 33.0% Never married50.1% Now married1.3% Separated2.4% Widowed13.1% DivorcedFemales 24.9% Never married44.0% Now married1.4% Separated15.5% Widowed14.3% DivorcedWomen who gave birth in the past 12 months Now married:
61.7% (110)Unmarried:
38.3% (68)
Women who did not give birth in the past 12 months Now married:
43.9% (1,583)Unmarried:
56.1% (2,022)
Marital status - Hispanic or Latino population 15 years and over
Males 39.3% Never married51.6% Now married0.8% Separated1.4% Widowed6.9% DivorcedFemales 26.2% Never married54.5% Now married4.1% Separated0.0% Widowed15.1% DivorcedWomen who gave birth in the past 12 months Now married:
100.0% (156)Unmarried:
0.0% (0)
Women who did not give birth in the past 12 months Now married:
59.3% (1,076)Unmarried:
40.7% (737)
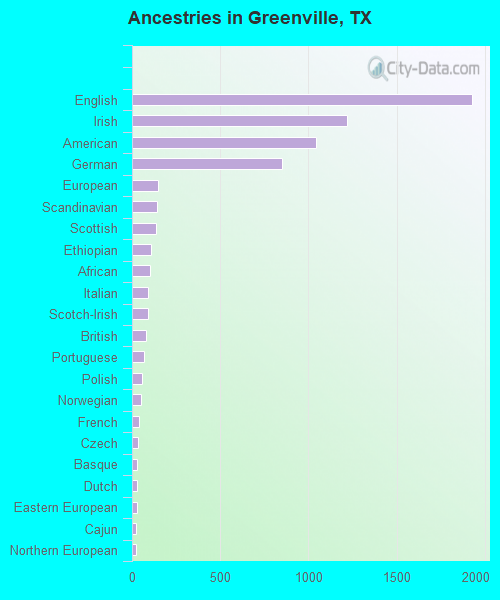
Ancestries in Greenville
1,928 12.9% English1,221 8.2% Irish1,041 7.0% American850 5.7% German150 1.0% European140 0.9% Scandinavian134 0.9% Scottish108 0.7% Ethiopian104 0.7% African91 0.6% Italian89 0.6% Scotch-Irish80 0.5% British68 0.5% Portuguese55 0.4% Polish53 0.4% Norwegian41 0.3% French35 0.2% Czech31 0.2% Basque30 0.2% Dutch30 0.2% Eastern European25 0.2% Cajun25 0.2% Northern European14 0.09% Slovak9 0.06% Lithuanian7 0.05% Danish3 0.02% Canadian
Geographical mobility in Greenville Same house 1 year ago 15,270 78.3% White (Caucasian)3,364 83.0% Black or African American170 53.7% American Indian / Alaska Native315 77.3% Asian3,370 95.1% Other race2,919 76.1% Two or more races13,149 77.9% White alone, not Hispanic / Latino6,989 87.8% Hispanic or LatinoMoved within same county 1,677 8.6% White / Caucasian538 13.3% Black or African American18 5.7% American Indian / Alaska Native52 1.5% Other race392 10.2% Two or more races1,687 10.0% White alone, not Hispanic / Latino221 2.8% Hispanic or LatinoMoved within same state 1,346 6.9% White / Caucasian113 2.8% Black or African American94 29.9% American Indian / Alaska Native117 3.3% Other race156 4.1% Two or more races1,068 6.3% White alone, not Hispanic / Latino489 6.1% Hispanic or LatinoMoved from different state 400 2.0% White / Caucasian147 3.6% Black or African American22 7.0% American Indian / Alaska Native5 0.1% Other race21 0.5% Two or more races210 1.2% White alone, not Hispanic / Latino95 1.2% Hispanic or LatinoMoved from abroad 17 0.1% White104 25.4% Asian2 0.0% Other race26 0.2% White alone, not Hispanic / Latino1 0.0% Hispanic or Latino
Children Nativity (place of birth) in Greenville
Children under 6 years - Living with two parents Both parents native 1,003 100.0% NativeBoth parents foreign-born 138 100.0% NativeOne native, one foreign-born parent 184 100.0% NativeChildren under 6 years - Living with one parent Native parent 611 100.0% NativeForeign-born parent 73 100.0% NativeChildren 6 to 17 years - Living with two parents Both parents native 2,200 100.0% Native0 0.0% Foreign-bornBoth parents foreign-born 520 91.6% Native47 8.4% Foreign-bornOne native, one foreign-born parent 240 100.0% NativeChildren 6 to 17 years - Living with one parent Native parent 1,278 100.0% NativeForeign-born parent 251 53.9% Native215 46.1% Foreign-born
Grandparents responsible for own grandchildren in Greenville
Grandparents (30 to 59 years) White / Caucasian 155 44.7% Responsible for grandchildren192 55.3% Not responsible for grandchildrenBlack or African American 6 8.3% Responsible for grandchildren68 91.7% Not responsible for grandchildrenOther race 34 100.0% Responsible for grandchildrenTwo or more races 30 100.0% Not responsible for grandchildrenWhite alone, not Hispanic / Latino 200 60.8% Responsible for grandchildren129 39.2% Not responsible for grandchildrenHispanic or Latino 28 37.4% Responsible for grandchildren46 62.6% Not responsible for grandchildrenGrandparents (60 years and over) White / Caucasian 71 100.0% Not responsible for grandchildrenBlack or African American 12 55.3% Responsible for grandchildren10 44.7% Not responsible for grandchildrenOther race 41 100.0% Responsible for grandchildrenWhite alone, not Hispanic / Latino 70 100.0% Not responsible for grandchildrenHispanic or Latino 31 100.0% Responsible for grandchildren