Races in Haltom City, Texas (TX) Detailed Stats
Data:
Races - White alone (%)
Races - White alone (% change since 2000)
Races - Black alone (%)
Races - Black alone (% change since 2000)
Races - American Indian alone (%)
Races - American Indian alone (% change since 2000)
Races - Asian alone (%)
Races - Asian alone (% change since 2000)
Races - Hispanic (%)
Races - Hispanic (% change since 2000)
Races - Native Hawaiian and Other Pacific Islander alone (%)
Races - Native Hawaiian and Other Pacific Islander alone (% change since 2000)
Races - Two or more races(%)
Races - Two or more races(% change since 2000)
Races - Other race alone (%)
Races - Other race alone (% change since 2000)
Racial diversity
Place of birth - Born in state of residence (%)
Place of birth - Born in state of residence (%) - White
Place of birth - Born in state of residence (%) - Black or African American
Place of birth - Born in state of residence (%) - Asian
Place of birth - Born in state of residence (%) - Hispanic or Latino
Place of birth - Born in state of residence (%) - American Indian and Alaska Native
Place of birth - Born in state of residence (%) - Multirace
Place of birth - Born in state of residence (%) - Other Race
Place of birth - Born in other state (%)
Place of birth - Born in other state (%) - White
Place of birth - Born in other state (%) - Black or African American
Place of birth - Born in other state (%) - Asian
Place of birth - Born in other state (%) - Hispanic or Latino
Place of birth - Born in other state (%) - American Indian and Alaska Native
Place of birth - Born in other state (%) - Multirace
Place of birth - Born in other state (%) - Other Race
Place of birth - Native, outside of US (%)
Place of birth - Native, outside of US (%) - White
Place of birth - Native, outside of US (%) - Black or African American
Place of birth - Native, outside of US (%) - Asian
Place of birth - Native, outside of US (%) - Hispanic or Latino
Place of birth - Native, outside of US (%) - American Indian and Alaska Native
Place of birth - Native, outside of US (%) - Multirace
Place of birth - Native, outside of US (%) - Other Race
Place of birth - Foreign born (%)
Place of birth - Foreign born (%) - White
Place of birth - Foreign born (%) - Black or African American
Place of birth - Foreign born (%) - Asian
Place of birth - Foreign born (%) - Hispanic or Latino
Place of birth - Foreign born (%) - American Indian and Alaska Native
Place of birth - Foreign born (%) - Multirace
Place of birth - Foreign born (%) - Other Race
Residents speaking English at home (%)
Residents speaking English at home - Born in the United States (%)
Residents speaking English at home - Native, born elsewhere (%)
Residents speaking English at home - Foreign born (%)
Residents speaking Spanish at home (%)
Residents speaking Spanish at home - Born in the United States (%)
Residents speaking Spanish at home - Native, born elsewhere (%)
Residents speaking Spanish at home - Foreign born (%)
Residents speaking other language at home (%)
Residents speaking other language at home - Born in the United States (%)
Residents speaking other language at home - Native, born elsewhere (%)
Residents speaking other language at home - Foreign born (%)
Marital status - Never married (%)
Marital status - Now married (%)
Marital status - Separated (%)
Marital status - Widowed (%)
Marital status - Divorced (%)
Ancestries Reported - Arab (%)
Ancestries Reported - Czech (%)
Ancestries Reported - Danish (%)
Ancestries Reported - Dutch (%)
Ancestries Reported - English (%)
Ancestries Reported - French (%)
Ancestries Reported - French Canadian (%)
Ancestries Reported - German (%)
Ancestries Reported - Greek (%)
Ancestries Reported - Hungarian (%)
Ancestries Reported - Irish (%)
Ancestries Reported - Italian (%)
Ancestries Reported - Lithuanian (%)
Ancestries Reported - Norwegian (%)
Ancestries Reported - Polish (%)
Ancestries Reported - Portuguese (%)
Ancestries Reported - Russian (%)
Ancestries Reported - Scotch-Irish (%)
Ancestries Reported - Scottish (%)
Ancestries Reported - Slovak (%)
Ancestries Reported - Subsaharan African (%)
Ancestries Reported - Swedish (%)
Ancestries Reported - Swiss (%)
Ancestries Reported - Ukrainian (%)
Ancestries Reported - United States (%)
Ancestries Reported - Welsh (%)
Ancestries Reported - West Indian (%)
Ancestries Reported - Other (%)
Geographical mobility - Same house 1 year ago (%)
Geographical mobility - Same house 1 year ago (%) - White
Geographical mobility - Same house 1 year ago (%) - Black or African American
Geographical mobility - Same house 1 year ago (%) - Asian
Geographical mobility - Same house 1 year ago (%) - Hispanic or Latino
Geographical mobility - Same house 1 year ago (%) - American Indian and Alaska Native
Geographical mobility - Same house 1 year ago (%) - Multirace
Geographical mobility - Same house 1 year ago (%) - Other Race
Geographical mobility - Moved within same county (%)
Geographical mobility - Moved within same county (%) - White
Geographical mobility - Moved within same county (%) - Black or African American
Geographical mobility - Moved within same county (%) - Asian
Geographical mobility - Moved within same county (%) - Hispanic or Latino
Geographical mobility - Moved within same county (%) - American Indian and Alaska Native
Geographical mobility - Moved within same county (%) - Multirace
Geographical mobility - Moved within same county (%) - Other Race
Geographical mobility - Moved from different county within same state (%)
Geographical mobility - Moved from different county within same state (%) - White
Geographical mobility - Moved from different county within same state (%) - Black or African American
Geographical mobility - Moved from different county within same state (%) - Asian
Geographical mobility - Moved from different county within same state (%) - Hispanic or Latino
Geographical mobility - Moved from different county within same state (%) - American Indian and Alaska Native
Geographical mobility - Moved from different county within same state (%) - Multirace
Geographical mobility - Moved from different county within same state (%) - Other Race
Geographical mobility - Moved from different state (%)
Geographical mobility - Moved from different state (%) - White
Geographical mobility - Moved from different state (%) - Black or African American
Geographical mobility - Moved from different state (%) - Asian
Geographical mobility - Moved from different state (%) - Hispanic or Latino
Geographical mobility - Moved from different state (%) - American Indian and Alaska Native
Geographical mobility - Moved from different state (%) - Multirace
Geographical mobility - Moved from different state (%) - Other Race
Geographical mobility - Moved from abroad (%)
Geographical mobility - Moved from abroad (%) - White
Geographical mobility - Moved from abroad (%) - Black or African American
Geographical mobility - Moved from abroad (%) - Asian
Geographical mobility - Moved from abroad (%) - Hispanic or Latino
Geographical mobility - Moved from abroad (%) - American Indian and Alaska Native
Geographical mobility - Moved from abroad (%) - Multirace
Geographical mobility - Moved from abroad (%) - Other Race
Place of birth for the foreign-born population - Ireland (%)
Place of birth for the foreign-born population - Denmark (%)
Place of birth for the foreign-born population - Norway (%)
Place of birth for the foreign-born population - Sweden (%)
Place of birth for the foreign-born population - United Kingdom (%)
Place of birth for the foreign-born population - England (%)
Place of birth for the foreign-born population - Scotland (%)
Place of birth for the foreign-born population - Other Northern Europe (%)
Place of birth for the foreign-born population - Austria (%)
Place of birth for the foreign-born population - Belgium (%)
Place of birth for the foreign-born population - France (%)
Place of birth for the foreign-born population - Germany (%)
Place of birth for the foreign-born population - Netherlands (%)
Place of birth for the foreign-born population - Switzerland (%)
Place of birth for the foreign-born population - Other Western Europe (%)
Place of birth for the foreign-born population - Greece (%)
Place of birth for the foreign-born population - Italy (%)
Place of birth for the foreign-born population - Portugal (%)
Place of birth for the foreign-born population - Spain (%)
Place of birth for the foreign-born population - Other Southern Europe (%)
Place of birth for the foreign-born population - Albania (%)
Place of birth for the foreign-born population - Belarus (%)
Place of birth for the foreign-born population - Bosnia and Herzegovina (%)
Place of birth for the foreign-born population - Bulgaria (%)
Place of birth for the foreign-born population - Croatia (%)
Place of birth for the foreign-born population - Czechoslovakia (%)
Place of birth for the foreign-born population - Hungary (%)
Place of birth for the foreign-born population - Latvia (%)
Place of birth for the foreign-born population - Lithuania (%)
Place of birth for the foreign-born population - North Macedonia (Macedonia) (%)
Place of birth for the foreign-born population - Moldova (%)
Place of birth for the foreign-born population - Poland (%)
Place of birth for the foreign-born population - Romania (%)
Place of birth for the foreign-born population - Russia (%)
Place of birth for the foreign-born population - Serbia (%)
Place of birth for the foreign-born population - Ukraine (%)
Place of birth for the foreign-born population - Other Eastern Europe (%)
Place of birth for the foreign-born population - China (%)
Place of birth for the foreign-born population - Hong Kong (%)
Place of birth for the foreign-born population - Taiwan (%)
Place of birth for the foreign-born population - Japan (%)
Place of birth for the foreign-born population - Korea (%)
Place of birth for the foreign-born population - Other Eastern Asia (%)
Place of birth for the foreign-born population - Afghanistan (%)
Place of birth for the foreign-born population - Bangladesh (%)
Place of birth for the foreign-born population - India (%)
Place of birth for the foreign-born population - Iran (%)
Place of birth for the foreign-born population - Kazakhstan (%)
Place of birth for the foreign-born population - Nepal (%)
Place of birth for the foreign-born population - Pakistan (%)
Place of birth for the foreign-born population - Sri Lanka (%)
Place of birth for the foreign-born population - Uzbekistan (%)
Place of birth for the foreign-born population - Other South Central Asia (%)
Place of birth for the foreign-born population - Burma (%)
Place of birth for the foreign-born population - Cambodia (%)
Place of birth for the foreign-born population - Indonesia (%)
Place of birth for the foreign-born population - Laos (%)
Place of birth for the foreign-born population - Malaysia (%)
Place of birth for the foreign-born population - Philippines (%)
Place of birth for the foreign-born population - Singapore (%)
Place of birth for the foreign-born population - Thailand (%)
Place of birth for the foreign-born population - Vietnam (%)
Place of birth for the foreign-born population - Other South Eastern Asia (%)
Place of birth for the foreign-born population - Armenia (%)
Place of birth for the foreign-born population - Iraq (%)
Place of birth for the foreign-born population - Israel (%)
Place of birth for the foreign-born population - Jordan (%)
Place of birth for the foreign-born population - Kuwait (%)
Place of birth for the foreign-born population - Lebanon (%)
Place of birth for the foreign-born population - Saudi Arabia (%)
Place of birth for the foreign-born population - Syria (%)
Place of birth for the foreign-born population - Turkey (%)
Place of birth for the foreign-born population - Yemen (%)
Place of birth for the foreign-born population - Other Western Asia (%)
Place of birth for the foreign-born population - Eritrea (%)
Place of birth for the foreign-born population - Ethiopia (%)
Place of birth for the foreign-born population - Kenya (%)
Place of birth for the foreign-born population - Somalia (%)
Place of birth for the foreign-born population - Uganda (%)
Place of birth for the foreign-born population - Zimbabwe (%)
Place of birth for the foreign-born population - Other Eastern Africa (%)
Place of birth for the foreign-born population - Cameroon (%)
Place of birth for the foreign-born population - Congo (%)
Place of birth for the foreign-born population - Democratic Republic of Congo (Zaire) (%)
Place of birth for the foreign-born population - Other Middle Africa (%)
Place of birth for the foreign-born population - Egypt (%)
Place of birth for the foreign-born population - Morocco (%)
Place of birth for the foreign-born population - Sudan (%)
Place of birth for the foreign-born population - Other Northern Africa (%)
Place of birth for the foreign-born population - South Africa (%)
Place of birth for the foreign-born population - Other Southern Africa (%)
Place of birth for the foreign-born population - Cabo Verde (%)
Place of birth for the foreign-born population - Ghana (%)
Place of birth for the foreign-born population - Liberia (%)
Place of birth for the foreign-born population - Nigeria (%)
Place of birth for the foreign-born population - Senegal (%)
Place of birth for the foreign-born population - Sierra Leone (%)
Place of birth for the foreign-born population - Other Western Africa (%)
Place of birth for the foreign-born population - Australia (%)
Place of birth for the foreign-born population - New Zealand (%)
Place of birth for the foreign-born population - Fiji (%)
Place of birth for the foreign-born population - Micronesia (%)
Place of birth for the foreign-born population - Bahamas (%)
Place of birth for the foreign-born population - Barbados (%)
Place of birth for the foreign-born population - Cuba (%)
Place of birth for the foreign-born population - Dominica (%)
Place of birth for the foreign-born population - Dominican Republic (%)
Place of birth for the foreign-born population - Grenada (%)
Place of birth for the foreign-born population - Haiti (%)
Place of birth for the foreign-born population - Jamaica (%)
Place of birth for the foreign-born population - St. Vincent and the Grenadines (%)
Place of birth for the foreign-born population - Trinidad and Tobago (%)
Place of birth for the foreign-born population - West Indies (%)
Place of birth for the foreign-born population - Other Caribbean (%)
Place of birth for the foreign-born population - Belize (%)
Place of birth for the foreign-born population - Costa Rica (%)
Place of birth for the foreign-born population - El Salvador (%)
Place of birth for the foreign-born population - Guatemala (%)
Place of birth for the foreign-born population - Honduras (%)
Place of birth for the foreign-born population - Mexico (%)
Place of birth for the foreign-born population - Nicaragua (%)
Place of birth for the foreign-born population - Panama (%)
Place of birth for the foreign-born population - Other Central America (%)
Place of birth for the foreign-born population - Argentina (%)
Place of birth for the foreign-born population - Bolivia (%)
Place of birth for the foreign-born population - Brazil (%)
Place of birth for the foreign-born population - Chile (%)
Place of birth for the foreign-born population - Colombia (%)
Place of birth for the foreign-born population - Ecuador (%)
Place of birth for the foreign-born population - Guyana (%)
Place of birth for the foreign-born population - Peru (%)
Place of birth for the foreign-born population - Uruguay (%)
Place of birth for the foreign-born population - Venezuela (%)
Place of birth for the foreign-born population - Other South America (%)
Place of birth for the foreign-born population - Canada (%)
Place of birth for the foreign-born population - Other Northern America (%)
Place of birth for the foreign-born population - Other (%)
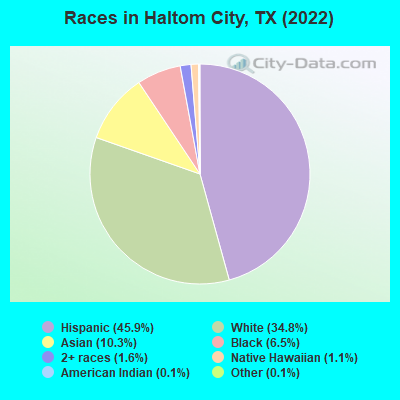
According to 2022 data, the most numerous races in Haltom City, TX are Hispanic (21,420 residents), White alone (16,214 residents), and Black alone (3,013 residents). 52.6% of Haltom City residents speak English at home. 24.4% of Haltom City, TX residents are foreign-born (14.0% born in Latin America, 7.2% born in Asia), which is 30.2% greater than the foreign-born rate of 17.0% across the entire state of Texas.
Race distribution in Haltom City
2000 2022
10,933,313 52.4% White alone 6,669,666 32.0% Hispanic 2,364,255 11.3% Black alone 554,445 2.7% Asian alone 230,567 1.1% Two or more races 68,859 0.3% American Indian alone 19,958 0.10% Other race alone 10,757 0.05% Native Hawaiian and Other
12,070,642 40.2% Hispanic 11,683,430 38.9% White alone 3,508,706 11.7% Black alone 1,608,173 5.4% Asian alone 956,560 3.2% Two or more races 125,763 0.4% Other race alone 47,023 0.2% American Indian alone 29,275 0.10% Native Hawaiian and Other
Income and house value in Haltom City Median household income in 2022 $56,727 White non-Hispanic householders$39,753 Black householders$117,688 American Indian and Alaska Native householders$84,262 Asian householders$81,183 Native Hawaiian and other Pacific Islander householders$45,342 Some other race householders$58,515 Two or more races householders$55,586 Hispanic or Latino race householdersMedian 2022 house value $210,000 White Non-Hispanic householders$414,440 Black or African American householders$196,262 American Indian or Alaska Native householders $230,281 Asian householders$367,991 Native Hawaiian and other Pacific Islander householders$181,869 Some other race householders$204,439 Two or more races householders$195,608 Hispanic or Latino householders
Median age by race in Haltom City
39.5 Median age for White residents39.9 37.9 37.5 Median age for Black or African American residents36.5 38.2 44.5 Median age for American Indian / Alaska Native residents33.1 52.9 41.7 Median age for Asian residents41.7 41.0 29.6 Median age for Native Hawaiian / Pacific Islander residents28.6 40.0 26.4 Median age for Other race residents28.8 23.8 32.8 Median age for Two or more races residents31.1 33.1 44.1 Median age for White alone residents43.9 44.2 26.9 Median age for Hispanic or Latino residents30.0 23.4
Owner/renter occupied households by race in Haltom City
House owners and renters - White residents 5,001 57.5% Owner occupied3,704 42.5% Renter occupiedHouse owners and renters - Black or African American residents 153 10.0% Owner occupied1,381 90.0% Renter occupiedHouse owners and renters - American Indian / Alaska Native residents 105 88.5% Owner occupied14 11.5% Renter occupiedHouse owners and renters - Asian residents 1,194 75.8% Owner occupied382 24.2% Renter occupiedHouse owners and renters - Native Hawaiian / Pacific Islander residents 141 60.5% Owner occupied92 39.5% Renter occupiedHouse owners and renters - Other race residents 1,266 59.4% Owner occupied865 40.6% Renter occupiedHouse owners and renters - Two or more races residents 1,407 50.2% Owner occupied1,395 49.8% Renter occupiedHouse owners and renters - White alone residents 4,337 56.6% Owner occupied3,322 43.4% Renter occupiedHouse owners and renters - Hispanic or Latino residents 3,381 55.7% Owner occupied2,690 44.3% Renter occupied
Language usage in Haltom City
English speakers - Total 52.6% of residents of Haltom City speak English at home.
37.2% of residents speak Spanish at home 10,914 67.2% Speak English very well5,329 32.8% Speak English less than very well10.8% of residents speak other language at home 2,041 43.4% Speak English very well2,658 56.6% Speak English less than very well
English speakers - Born in the United States 87.6% of residents of Haltom City speak English at home.
11.4% of residents speak Spanish at home 824 85.5% Speak English very well140 14.5% Speak English less than very well1.2% of residents speak other language at home 43 41.7% Speak English very well60 58.3% Speak English less than very well
English speakers - Native, born elsewhere 41.4% of residents of Haltom City speak English at home.
52.3% of residents speak Spanish at home 231 73.8% Speak English very well82 26.2% Speak English less than very well2.7% of residents speak other language at home 16 100.0% Speak English very well
English speakers - Foreign-born 8.0% of residents of Haltom City speak English at home.
56.5% of residents speak Spanish at home 1,872 29.8% Speak English very well4,400 70.2% Speak English less than very well35.3% of residents speak other language at home 1,433 36.6% Speak English very well2,487 63.4% Speak English less than very well
White (Caucasian) - Speak only English Native:
87.0% (15,875)Foreign-born:
10.4% (118)
White (Caucasian) - Speak another language Native:
10.5% (1,908)Foreign-born:
82.1% (926)
Black or African American - Speak only English Native:
96.3% (1,900)Foreign-born:
37.5% (334)
Black or African American - Speak another language Native:
3.3% (65)Foreign-born:
61.7% (550)
American Indian / Alaska Native - Speak another language Native:
92.8% (359)Foreign-born:
100.0% (78)
Asian - Speak only English Native:
43.7% (545)Foreign-born:
4.7% (158)
Asian - Speak another language Native:
54.1% (674)Foreign-born:
94.5% (3,190)
Native Hawaiian / Pacific Islander - Speak only English Native:
98.9% (246)Foreign-born:
8.8% (23)
Other race - Speak only English Native:
18.2% (871)Foreign-born:
5.6% (150)
Other race - Speak another language Native:
78.4% (3,746)Foreign-born:
93.7% (2,492)
Two or more races - Speak only English Native:
48.4% (2,562)Foreign-born:
5.4% (118)
Two or more races - Speak another language Native:
52.6% (2,785)Foreign-born:
94.0% (2,039)
White alone - Speak only English Native:
98.1% (15,225)Foreign-born:
24.6% (49)
White alone - Speak another language Native:
1.9% (298)Foreign-born:
72.2% (145)
Hispanic or Latino - Speak only English Native:
26.2% (3,388)Foreign-born:
4.6% (303)
Hispanic or Latino - Speak another language Native:
74.9% (9,679)Foreign-born:
95.4% (6,288)
Foreign-born residents in Haltom City 11,364 residents are foreign born (14.0% Latin America , 7.2% Asia ).
This city:
24.4%Texas:
17.1%
Marital status for residents in Haltom City Marital status - White (Caucasian) population 15 years and over
Males 33.2% Never married44.7% Now married2.2% Separated5.4% Widowed14.4% DivorcedFemales 29.2% Never married43.8% Now married2.5% Separated10.3% Widowed14.2% DivorcedWomen who gave birth in the past 12 months Now married:
83.3% (123)Unmarried:
16.7% (25)
Women who did not give birth in the past 12 months Now married:
43.1% (1,995)Unmarried:
56.9% (2,636)
Marital status - Black or African American population 15 years and over
Males 42.1% Never married32.8% Now married5.7% Separated12.2% Widowed7.2% DivorcedFemales 58.2% Never married13.7% Now married0.0% Separated6.7% Widowed21.3% DivorcedWomen who gave birth in the past 12 months Now married:
0.0% (0)Unmarried:
100.0% (15)
Women who did not give birth in the past 12 months Now married:
15.7% (165)Unmarried:
84.3% (884)
Marital status - American Indian / Alaska Native population 15 years and over
Males 57.0% Never married43.0% Now married0.0% Separated0.0% Widowed0.0% DivorcedFemales 34.0% Never married24.1% Now married0.0% Separated19.8% Widowed22.1% DivorcedWomen who did not give birth in the past 12 months Now married:
24.1% (77)Unmarried:
75.9% (244)
Marital status - Asian population 15 years and over
Males 34.1% Never married63.9% Now married0.0% Separated2.0% Widowed0.0% DivorcedFemales 23.5% Never married56.9% Now married2.8% Separated3.6% Widowed13.3% DivorcedWomen who gave birth in the past 12 months Now married:
81.8% (158)Unmarried:
18.2% (35)
Women who did not give birth in the past 12 months Now married:
53.4% (520)Unmarried:
46.6% (454)
Marital status - Native Hawaiian / Pacific Islander population 15 years and over
Males 3.1% Never married21.6% Now married0.0% Separated34.1% Widowed41.2% DivorcedFemales 0.0% Never married50.9% Now married0.0% Separated49.1% Widowed0.0% DivorcedWomen who did not give birth in the past 12 months Now married:
100.0% (59)Unmarried:
0.0% (0)
Marital status - Other race population 15 years and over
Males 43.3% Never married49.0% Now married0.0% Separated0.0% Widowed7.7% DivorcedFemales 44.4% Never married48.5% Now married1.2% Separated2.8% Widowed3.1% DivorcedWomen who gave birth in the past 12 months Now married:
84.6% (73)Unmarried:
15.4% (13)
Women who did not give birth in the past 12 months Now married:
44.4% (976)Unmarried:
55.6% (1,223)
Marital status - Two or more races population 15 years and over
Males 41.4% Never married37.8% Now married0.5% Separated5.9% Widowed14.4% DivorcedFemales 21.9% Never married43.9% Now married3.0% Separated11.5% Widowed19.7% DivorcedWomen who gave birth in the past 12 months Now married:
93.4% (171)Unmarried:
6.6% (12)
Women who did not give birth in the past 12 months Now married:
35.5% (569)Unmarried:
64.5% (1,034)
Marital status - White alone, not Hispanic / Latino population 15 years and over
Males 31.6% Never married43.8% Now married0.6% Separated6.2% Widowed17.9% DivorcedFemales 25.9% Never married42.9% Now married2.1% Separated11.9% Widowed17.1% DivorcedWomen who gave birth in the past 12 months Now married:
83.8% (90)Unmarried:
16.2% (17)
Women who did not give birth in the past 12 months Now married:
41.1% (1,529)Unmarried:
58.9% (2,193)
Marital status - Hispanic or Latino population 15 years and over
Males 41.1% Never married46.1% Now married2.5% Separated2.1% Widowed8.2% DivorcedFemales 37.9% Never married45.8% Now married2.3% Separated5.7% Widowed8.4% DivorcedWomen who gave birth in the past 12 months Now married:
89.7% (228)Unmarried:
10.3% (26)
Women who did not give birth in the past 12 months Now married:
42.7% (2,239)Unmarried:
57.3% (3,003)
Ancestries in Haltom City
1,502 5.4% English1,469 5.3% American825 3.0% German718 2.6% Irish423 1.5% African261 0.9% European213 0.8% Ugandan192 0.7% Haitian166 0.6% Italian147 0.5% Slavic116 0.4% Scotch-Irish95 0.3% Kenyan84 0.3% Egyptian83 0.3% Serbian78 0.3% Polish52 0.2% Welsh50 0.2% Arab48 0.2% Czechoslovakian44 0.2% Scottish41 0.1% Austrian35 0.1% Czech29 0.1% Moroccan27 0.10% French24 0.09% Liberian21 0.08% Scandinavian19 0.07% Russian15 0.05% Greek15 0.05% Norwegian15 0.05% Swedish11 0.04% British9 0.03% French Canadian7 0.03% Hungarian
Geographical mobility in Haltom City Same house 1 year ago 18,957 91.0% White (Caucasian)2,461 79.8% Black or African American435 91.5% American Indian / Alaska Native4,382 92.2% Asian571 98.2% Native Hawaiian / Pacific Islander7,675 97.9% Other race7,013 90.8% Two or more races14,973 92.6% White alone, not Hispanic / Latino19,684 92.9% Hispanic or LatinoMoved within same county 1,426 6.8% White / Caucasian438 14.2% Black or African American183 3.8% Asian225 2.9% Other race179 2.3% Two or more races819 5.1% White alone, not Hispanic / Latino1,199 5.7% Hispanic or LatinoMoved within same state 167 0.8% White / Caucasian137 4.5% Black or African American181 3.8% Asian112 1.4% Other race455 5.9% Two or more races152 0.9% White alone, not Hispanic / Latino298 1.4% Hispanic or LatinoMoved from different state 237 1.1% White / Caucasian70 14.8% American Indian / Alaska Native7 0.2% Asian19 0.2% Two or more races241 1.5% White alone, not Hispanic / Latino27 0.1% Hispanic or LatinoMoved from abroad 8 0.0% White36 0.5% Two or more races34 0.2% Hispanic or Latino
Children Nativity (place of birth) in Haltom City
Children under 6 years - Living with two parents Both parents native 640 99.2% Native5 0.8% Foreign-bornBoth parents foreign-born 636 100.0% NativeOne native, one foreign-born parent 232 89.2% Native28 10.8% Foreign-bornChildren under 6 years - Living with one parent Native parent 1,268 99.8% Native3 0.2% Foreign-bornForeign-born parent 240 88.4% Native32 11.6% Foreign-bornChildren 6 to 17 years - Living with two parents Both parents native 1,742 99.2% Native14 0.8% Foreign-bornBoth parents foreign-born 2,079 87.1% Native309 12.9% Foreign-bornOne native, one foreign-born parent 647 100.0% NativeChildren 6 to 17 years - Living with one parent Native parent 2,184 100.0% NativeForeign-born parent 1,060 51.8% Native986 48.2% Foreign-born
Grandparents responsible for own grandchildren in Haltom City
Grandparents (30 to 59 years) White / Caucasian 84 33.1% Responsible for grandchildren169 66.9% Not responsible for grandchildrenBlack or African American 50 100.0% Responsible for grandchildrenAsian 7 20.6% Responsible for grandchildren26 79.4% Not responsible for grandchildrenNative Hawaiian / Pacific Islander 63 100.0% Responsible for grandchildrenOther race 22 47.1% Responsible for grandchildren25 52.9% Not responsible for grandchildrenTwo or more races 20 100.0% Responsible for grandchildrenWhite alone, not Hispanic / Latino 101 57.7% Responsible for grandchildren74 42.3% Not responsible for grandchildrenHispanic or Latino 57 25.1% Responsible for grandchildren169 74.9% Not responsible for grandchildrenGrandparents (60 years and over) White / Caucasian 84 45.4% Responsible for grandchildren101 54.6% Not responsible for grandchildrenBlack or African American 8 100.0% Responsible for grandchildrenAsian 4 1.2% Responsible for grandchildren321 98.8% Not responsible for grandchildrenNative Hawaiian / Pacific Islander 51 100.0% Not responsible for grandchildrenTwo or more races 115 100.0% Not responsible for grandchildrenWhite alone, not Hispanic / Latino 47 30.9% Responsible for grandchildren105 69.1% Not responsible for grandchildrenHispanic or Latino 54 46.5% Responsible for grandchildren62 53.5% Not responsible for grandchildren