Races in Lakeland North, Washington (WA) Detailed Stats
Data:
Races - White alone (%)
Races - White alone (% change since 2000)
Races - Black alone (%)
Races - Black alone (% change since 2000)
Races - American Indian alone (%)
Races - American Indian alone (% change since 2000)
Races - Asian alone (%)
Races - Asian alone (% change since 2000)
Races - Hispanic (%)
Races - Hispanic (% change since 2000)
Races - Native Hawaiian and Other Pacific Islander alone (%)
Races - Native Hawaiian and Other Pacific Islander alone (% change since 2000)
Races - Two or more races(%)
Races - Two or more races(% change since 2000)
Races - Other race alone (%)
Races - Other race alone (% change since 2000)
Racial diversity
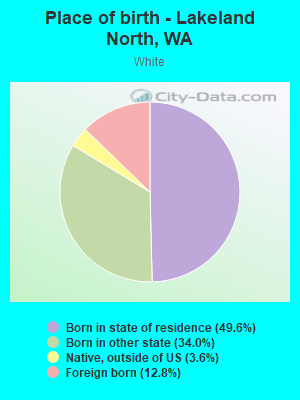
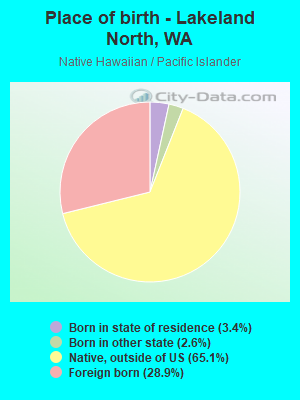
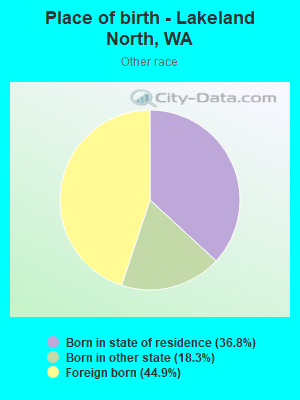
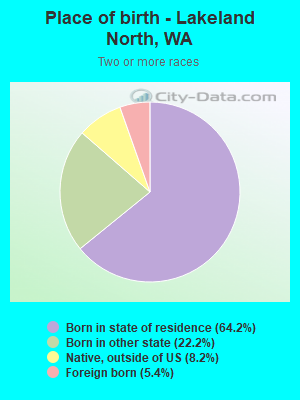
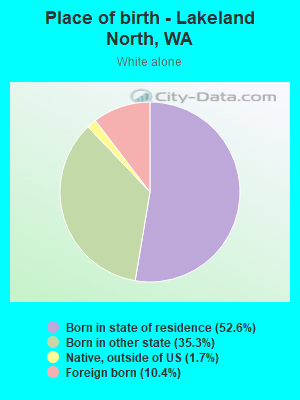
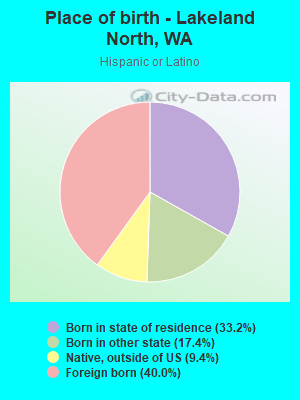
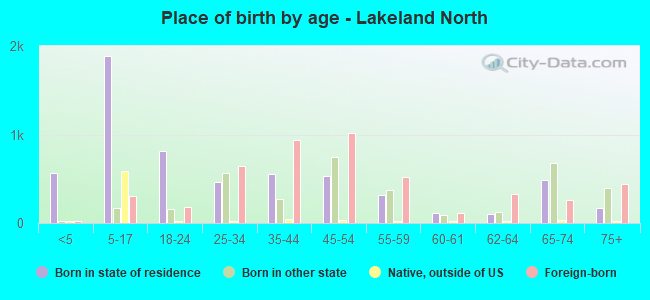
Place of birth - Born in state of residence (%)
Place of birth - Born in state of residence (%) - White
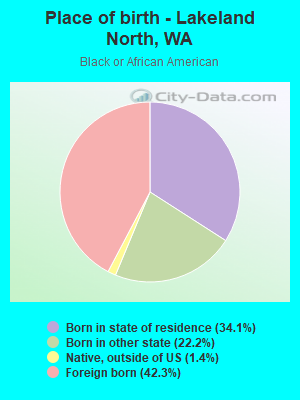
Place of birth - Born in state of residence (%) - Black or African American
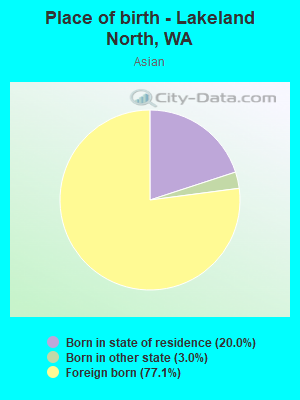
Place of birth - Born in state of residence (%) - Asian
Place of birth - Born in state of residence (%) - Hispanic or Latino
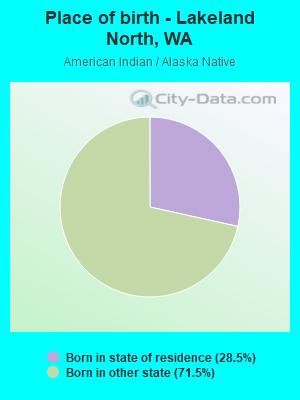
Place of birth - Born in state of residence (%) - American Indian and Alaska Native
Place of birth - Born in state of residence (%) - Multirace
Place of birth - Born in state of residence (%) - Other Race
Place of birth - Born in other state (%)
Place of birth - Born in other state (%) - White
Place of birth - Born in other state (%) - Black or African American
Place of birth - Born in other state (%) - Asian
Place of birth - Born in other state (%) - Hispanic or Latino
Place of birth - Born in other state (%) - American Indian and Alaska Native
Place of birth - Born in other state (%) - Multirace
Place of birth - Born in other state (%) - Other Race
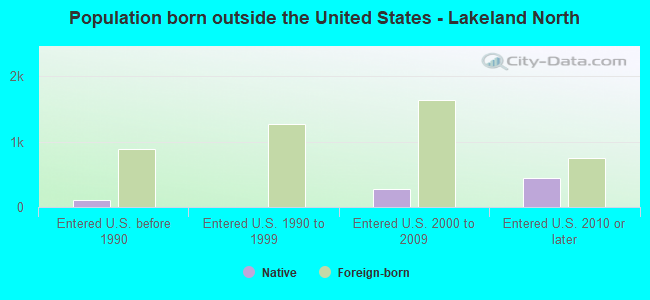
Place of birth - Native, outside of US (%)
Place of birth - Native, outside of US (%) - White
Place of birth - Native, outside of US (%) - Black or African American
Place of birth - Native, outside of US (%) - Asian
Place of birth - Native, outside of US (%) - Hispanic or Latino
Place of birth - Native, outside of US (%) - American Indian and Alaska Native
Place of birth - Native, outside of US (%) - Multirace
Place of birth - Native, outside of US (%) - Other Race
Place of birth - Foreign born (%)
Place of birth - Foreign born (%) - White
Place of birth - Foreign born (%) - Black or African American
Place of birth - Foreign born (%) - Asian
Place of birth - Foreign born (%) - Hispanic or Latino
Place of birth - Foreign born (%) - American Indian and Alaska Native
Place of birth - Foreign born (%) - Multirace
Place of birth - Foreign born (%) - Other Race
Residents speaking English at home (%)
Residents speaking English at home - Born in the United States (%)
Residents speaking English at home - Native, born elsewhere (%)
Residents speaking English at home - Foreign born (%)
Residents speaking Spanish at home (%)
Residents speaking Spanish at home - Born in the United States (%)
Residents speaking Spanish at home - Native, born elsewhere (%)
Residents speaking Spanish at home - Foreign born (%)
Residents speaking other language at home (%)
Residents speaking other language at home - Born in the United States (%)
Residents speaking other language at home - Native, born elsewhere (%)
Residents speaking other language at home - Foreign born (%)
Marital status - Never married (%)
Marital status - Now married (%)
Marital status - Separated (%)
Marital status - Widowed (%)
Marital status - Divorced (%)
Ancestries Reported - Arab (%)
Ancestries Reported - Czech (%)
Ancestries Reported - Danish (%)
Ancestries Reported - Dutch (%)
Ancestries Reported - English (%)
Ancestries Reported - French (%)
Ancestries Reported - French Canadian (%)
Ancestries Reported - German (%)
Ancestries Reported - Greek (%)
Ancestries Reported - Hungarian (%)
Ancestries Reported - Irish (%)
Ancestries Reported - Italian (%)
Ancestries Reported - Lithuanian (%)
Ancestries Reported - Norwegian (%)
Ancestries Reported - Polish (%)
Ancestries Reported - Portuguese (%)
Ancestries Reported - Russian (%)
Ancestries Reported - Scotch-Irish (%)
Ancestries Reported - Scottish (%)
Ancestries Reported - Slovak (%)
Ancestries Reported - Subsaharan African (%)
Ancestries Reported - Swedish (%)
Ancestries Reported - Swiss (%)
Ancestries Reported - Ukrainian (%)
Ancestries Reported - United States (%)
Ancestries Reported - Welsh (%)
Ancestries Reported - West Indian (%)
Ancestries Reported - Other (%)
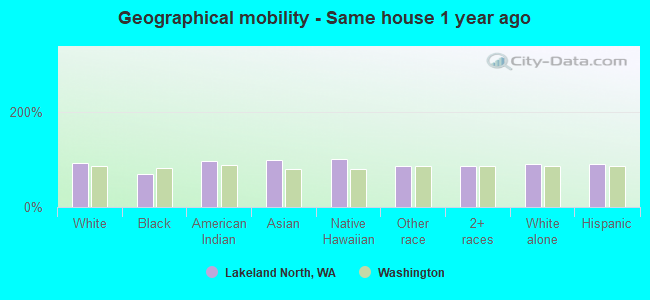
Geographical mobility - Same house 1 year ago (%)
Geographical mobility - Same house 1 year ago (%) - White
Geographical mobility - Same house 1 year ago (%) - Black or African American
Geographical mobility - Same house 1 year ago (%) - Asian
Geographical mobility - Same house 1 year ago (%) - Hispanic or Latino
Geographical mobility - Same house 1 year ago (%) - American Indian and Alaska Native
Geographical mobility - Same house 1 year ago (%) - Multirace
Geographical mobility - Same house 1 year ago (%) - Other Race
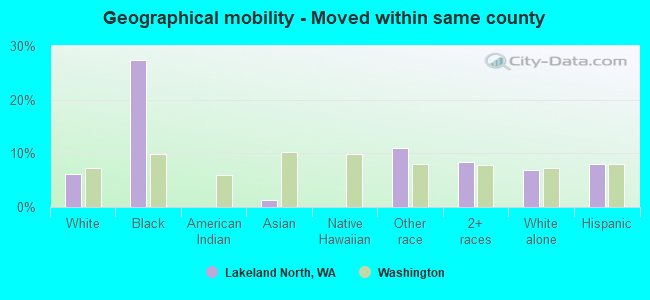
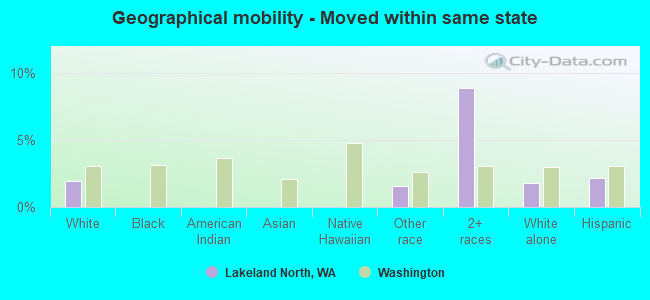
Geographical mobility - Moved within same county (%)
Geographical mobility - Moved within same county (%) - White
Geographical mobility - Moved within same county (%) - Black or African American
Geographical mobility - Moved within same county (%) - Asian
Geographical mobility - Moved within same county (%) - Hispanic or Latino
Geographical mobility - Moved within same county (%) - American Indian and Alaska Native
Geographical mobility - Moved within same county (%) - Multirace
Geographical mobility - Moved within same county (%) - Other Race
Geographical mobility - Moved from different county within same state (%)
Geographical mobility - Moved from different county within same state (%) - White
Geographical mobility - Moved from different county within same state (%) - Black or African American
Geographical mobility - Moved from different county within same state (%) - Asian
Geographical mobility - Moved from different county within same state (%) - Hispanic or Latino
Geographical mobility - Moved from different county within same state (%) - American Indian and Alaska Native
Geographical mobility - Moved from different county within same state (%) - Multirace
Geographical mobility - Moved from different county within same state (%) - Other Race
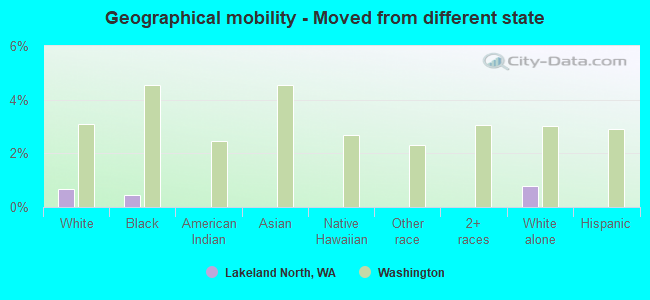
Geographical mobility - Moved from different state (%)
Geographical mobility - Moved from different state (%) - White
Geographical mobility - Moved from different state (%) - Black or African American
Geographical mobility - Moved from different state (%) - Asian
Geographical mobility - Moved from different state (%) - Hispanic or Latino
Geographical mobility - Moved from different state (%) - American Indian and Alaska Native
Geographical mobility - Moved from different state (%) - Multirace
Geographical mobility - Moved from different state (%) - Other Race
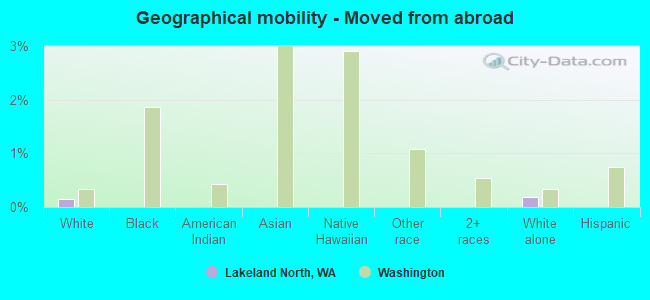
Geographical mobility - Moved from abroad (%)
Geographical mobility - Moved from abroad (%) - White
Geographical mobility - Moved from abroad (%) - Black or African American
Geographical mobility - Moved from abroad (%) - Asian
Geographical mobility - Moved from abroad (%) - Hispanic or Latino
Geographical mobility - Moved from abroad (%) - American Indian and Alaska Native
Geographical mobility - Moved from abroad (%) - Multirace
Geographical mobility - Moved from abroad (%) - Other Race
Place of birth for the foreign-born population - Ireland (%)
Place of birth for the foreign-born population - Denmark (%)
Place of birth for the foreign-born population - Norway (%)
Place of birth for the foreign-born population - Sweden (%)
Place of birth for the foreign-born population - United Kingdom (%)
Place of birth for the foreign-born population - England (%)
Place of birth for the foreign-born population - Scotland (%)
Place of birth for the foreign-born population - Other Northern Europe (%)
Place of birth for the foreign-born population - Austria (%)
Place of birth for the foreign-born population - Belgium (%)
Place of birth for the foreign-born population - France (%)
Place of birth for the foreign-born population - Germany (%)
Place of birth for the foreign-born population - Netherlands (%)
Place of birth for the foreign-born population - Switzerland (%)
Place of birth for the foreign-born population - Other Western Europe (%)
Place of birth for the foreign-born population - Greece (%)
Place of birth for the foreign-born population - Italy (%)
Place of birth for the foreign-born population - Portugal (%)
Place of birth for the foreign-born population - Spain (%)
Place of birth for the foreign-born population - Other Southern Europe (%)
Place of birth for the foreign-born population - Albania (%)
Place of birth for the foreign-born population - Belarus (%)
Place of birth for the foreign-born population - Bosnia and Herzegovina (%)
Place of birth for the foreign-born population - Bulgaria (%)
Place of birth for the foreign-born population - Croatia (%)
Place of birth for the foreign-born population - Czechoslovakia (%)
Place of birth for the foreign-born population - Hungary (%)
Place of birth for the foreign-born population - Latvia (%)
Place of birth for the foreign-born population - Lithuania (%)
Place of birth for the foreign-born population - North Macedonia (Macedonia) (%)
Place of birth for the foreign-born population - Moldova (%)
Place of birth for the foreign-born population - Poland (%)
Place of birth for the foreign-born population - Romania (%)
Place of birth for the foreign-born population - Russia (%)
Place of birth for the foreign-born population - Serbia (%)
Place of birth for the foreign-born population - Ukraine (%)
Place of birth for the foreign-born population - Other Eastern Europe (%)
Place of birth for the foreign-born population - China (%)
Place of birth for the foreign-born population - Hong Kong (%)
Place of birth for the foreign-born population - Taiwan (%)
Place of birth for the foreign-born population - Japan (%)
Place of birth for the foreign-born population - Korea (%)
Place of birth for the foreign-born population - Other Eastern Asia (%)
Place of birth for the foreign-born population - Afghanistan (%)
Place of birth for the foreign-born population - Bangladesh (%)
Place of birth for the foreign-born population - India (%)
Place of birth for the foreign-born population - Iran (%)
Place of birth for the foreign-born population - Kazakhstan (%)
Place of birth for the foreign-born population - Nepal (%)
Place of birth for the foreign-born population - Pakistan (%)
Place of birth for the foreign-born population - Sri Lanka (%)
Place of birth for the foreign-born population - Uzbekistan (%)
Place of birth for the foreign-born population - Other South Central Asia (%)
Place of birth for the foreign-born population - Burma (%)
Place of birth for the foreign-born population - Cambodia (%)
Place of birth for the foreign-born population - Indonesia (%)
Place of birth for the foreign-born population - Laos (%)
Place of birth for the foreign-born population - Malaysia (%)
Place of birth for the foreign-born population - Philippines (%)
Place of birth for the foreign-born population - Singapore (%)
Place of birth for the foreign-born population - Thailand (%)
Place of birth for the foreign-born population - Vietnam (%)
Place of birth for the foreign-born population - Other South Eastern Asia (%)
Place of birth for the foreign-born population - Armenia (%)
Place of birth for the foreign-born population - Iraq (%)
Place of birth for the foreign-born population - Israel (%)
Place of birth for the foreign-born population - Jordan (%)
Place of birth for the foreign-born population - Kuwait (%)
Place of birth for the foreign-born population - Lebanon (%)
Place of birth for the foreign-born population - Saudi Arabia (%)
Place of birth for the foreign-born population - Syria (%)
Place of birth for the foreign-born population - Turkey (%)
Place of birth for the foreign-born population - Yemen (%)
Place of birth for the foreign-born population - Other Western Asia (%)
Place of birth for the foreign-born population - Eritrea (%)
Place of birth for the foreign-born population - Ethiopia (%)
Place of birth for the foreign-born population - Kenya (%)
Place of birth for the foreign-born population - Somalia (%)
Place of birth for the foreign-born population - Uganda (%)
Place of birth for the foreign-born population - Zimbabwe (%)
Place of birth for the foreign-born population - Other Eastern Africa (%)
Place of birth for the foreign-born population - Cameroon (%)
Place of birth for the foreign-born population - Congo (%)
Place of birth for the foreign-born population - Democratic Republic of Congo (Zaire) (%)
Place of birth for the foreign-born population - Other Middle Africa (%)
Place of birth for the foreign-born population - Egypt (%)
Place of birth for the foreign-born population - Morocco (%)
Place of birth for the foreign-born population - Sudan (%)
Place of birth for the foreign-born population - Other Northern Africa (%)
Place of birth for the foreign-born population - South Africa (%)
Place of birth for the foreign-born population - Other Southern Africa (%)
Place of birth for the foreign-born population - Cabo Verde (%)
Place of birth for the foreign-born population - Ghana (%)
Place of birth for the foreign-born population - Liberia (%)
Place of birth for the foreign-born population - Nigeria (%)
Place of birth for the foreign-born population - Senegal (%)
Place of birth for the foreign-born population - Sierra Leone (%)
Place of birth for the foreign-born population - Other Western Africa (%)
Place of birth for the foreign-born population - Australia (%)
Place of birth for the foreign-born population - New Zealand (%)
Place of birth for the foreign-born population - Fiji (%)
Place of birth for the foreign-born population - Micronesia (%)
Place of birth for the foreign-born population - Bahamas (%)
Place of birth for the foreign-born population - Barbados (%)
Place of birth for the foreign-born population - Cuba (%)
Place of birth for the foreign-born population - Dominica (%)
Place of birth for the foreign-born population - Dominican Republic (%)
Place of birth for the foreign-born population - Grenada (%)
Place of birth for the foreign-born population - Haiti (%)
Place of birth for the foreign-born population - Jamaica (%)
Place of birth for the foreign-born population - St. Vincent and the Grenadines (%)
Place of birth for the foreign-born population - Trinidad and Tobago (%)
Place of birth for the foreign-born population - West Indies (%)
Place of birth for the foreign-born population - Other Caribbean (%)
Place of birth for the foreign-born population - Belize (%)
Place of birth for the foreign-born population - Costa Rica (%)
Place of birth for the foreign-born population - El Salvador (%)
Place of birth for the foreign-born population - Guatemala (%)
Place of birth for the foreign-born population - Honduras (%)
Place of birth for the foreign-born population - Mexico (%)
Place of birth for the foreign-born population - Nicaragua (%)
Place of birth for the foreign-born population - Panama (%)
Place of birth for the foreign-born population - Other Central America (%)
Place of birth for the foreign-born population - Argentina (%)
Place of birth for the foreign-born population - Bolivia (%)
Place of birth for the foreign-born population - Brazil (%)
Place of birth for the foreign-born population - Chile (%)
Place of birth for the foreign-born population - Colombia (%)
Place of birth for the foreign-born population - Ecuador (%)
Place of birth for the foreign-born population - Guyana (%)
Place of birth for the foreign-born population - Peru (%)
Place of birth for the foreign-born population - Uruguay (%)
Place of birth for the foreign-born population - Venezuela (%)
Place of birth for the foreign-born population - Other South America (%)
Place of birth for the foreign-born population - Canada (%)
Place of birth for the foreign-born population - Other Northern America (%)
Place of birth for the foreign-born population - Other (%)
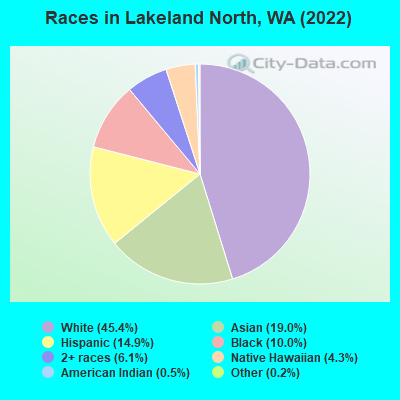
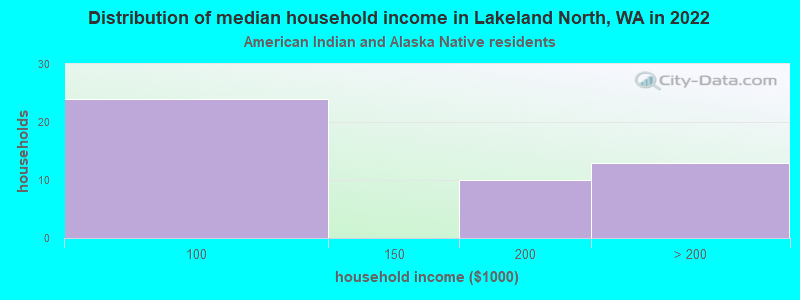
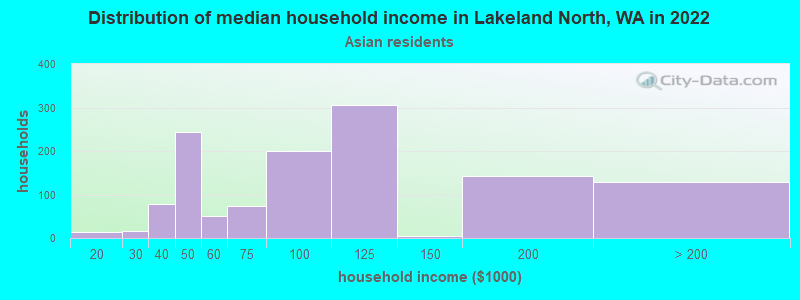
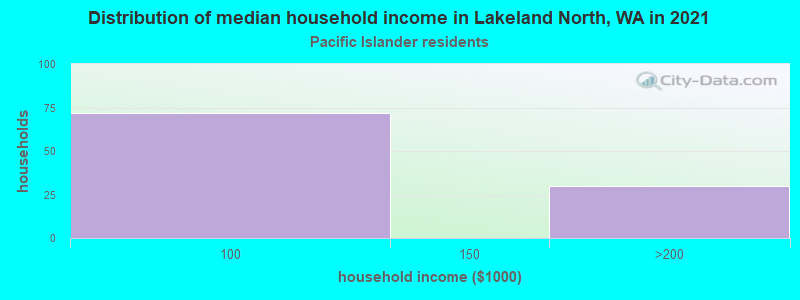
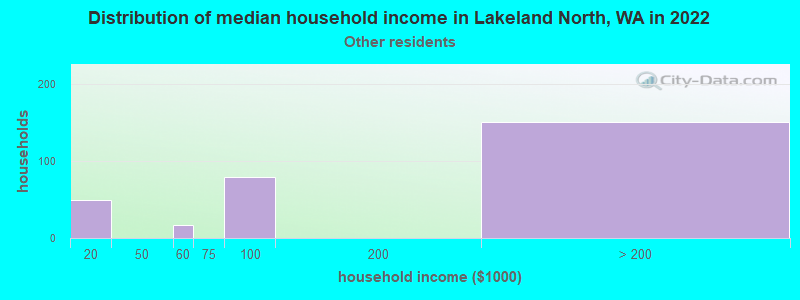
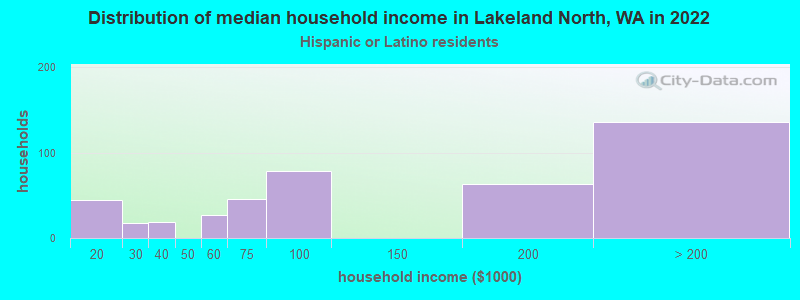
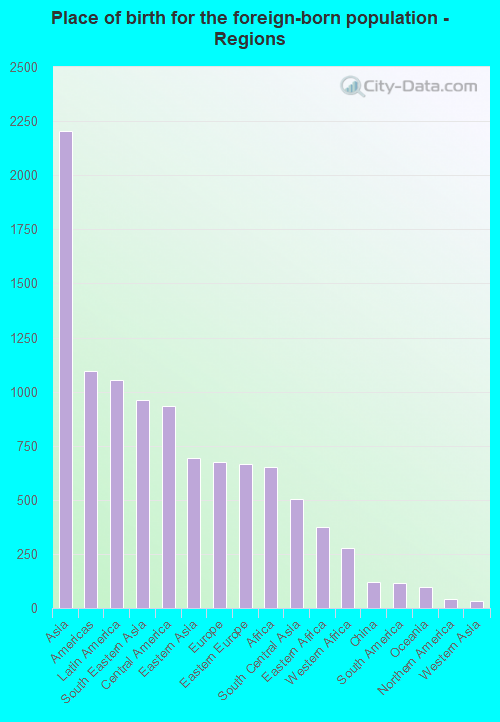
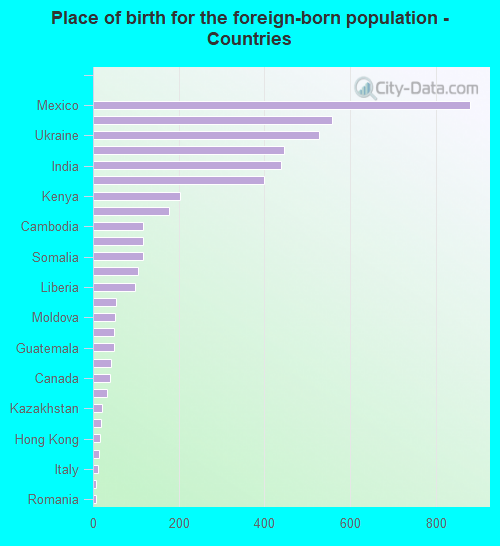
According to 2022 data, the most numerous races in Lakeland North, WA are White alone (6,834 residents), Hispanic (2,244 residents), and Asian alone (2,851 residents). 61.8% of Lakeland North residents speak English at home. 31.4% of Lakeland North, WA residents are foreign-born (14.1% born in Asia, 6.7% born in Latin America, 4.3% born in Europe, 4.1% born in Africa), which is 52.2% greater than the foreign-born rate of 15.0% across the entire state of Washington.
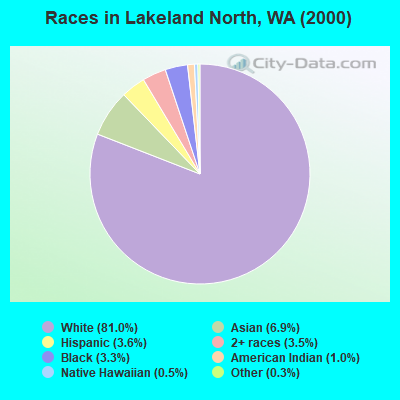
Race distribution in Lakeland North
2000 2022
4,652,490 78.9% White alone 441,509 7.5% Hispanic 319,401 5.4% Asian alone 184,631 3.1% Black alone 175,926 3.0% Two or more races 85,396 1.4% American Indian alone 22,779 0.4% Native Hawaiian and Other 11,989 0.2% Other race alone
4,941,456 63.5% White alone 1,093,313 14.0% Hispanic 755,832 9.7% Asian alone 523,448 6.7% Two or more races 299,537 3.8% Black alone 69,024 0.9% American Indian alone 52,231 0.7% Native Hawaiian and Other 50,945 0.7% Other race alone
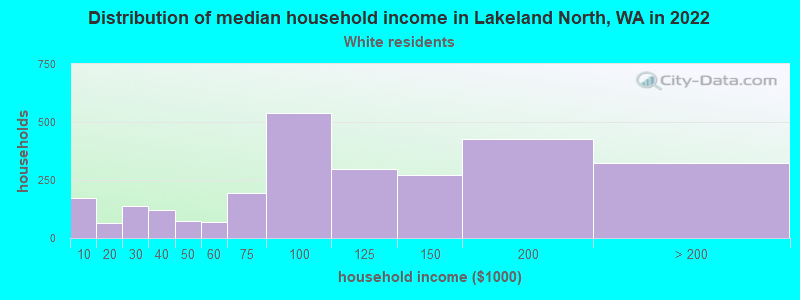
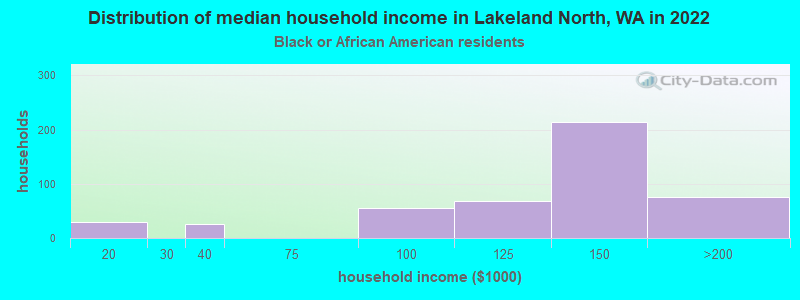
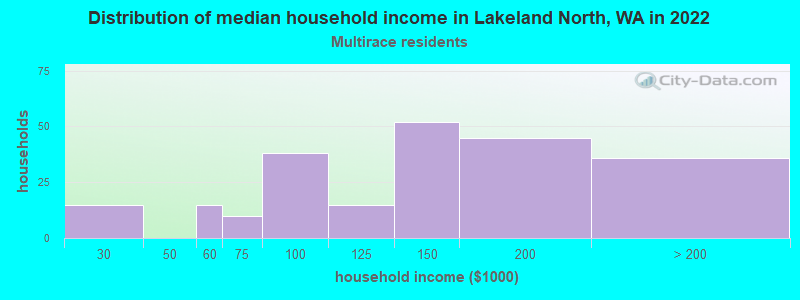
Income and house value in Lakeland North Median household income in 2022 $100,074 White non-Hispanic householders$137,090 Black householders$98,478 Asian householders$140,248 Two or more races householders$86,125 Hispanic or Latino race householdersMedian 2022 house value $524,831 White Non-Hispanic householders$545,479 Black or African American householders$577,838 American Indian or Alaska Native householders $582,768 Asian householders$500,792 Native Hawaiian and other Pacific Islander householders$539,315 Some other race householders$640,090 Two or more races householders$536,850 Hispanic or Latino householders
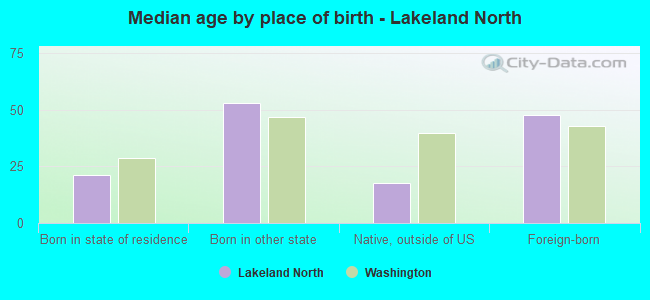
Median age by race in Lakeland North
44.3 Median age for White residents43.8 44.6 32.0 Median age for Black or African American residents39.9 32.5 53.3 Median age for American Indian / Alaska Native residents50.4 69.0 46.0 Median age for Asian residents43.2 46.1 17.4 Median age for Native Hawaiian / Pacific Islander residents17.8 11.4 44.0 Median age for Other race residents27.5 48.9 21.6 Median age for Two or more races residents19.6 28.5 46.2 Median age for White alone residents46.0 46.6 32.6 Median age for Hispanic or Latino residents17.8 43.4
Owner/renter occupied households by race in Lakeland North
House owners and renters - White residents 2,079 76.9% Owner occupied626 23.1% Renter occupiedHouse owners and renters - Black or African American residents 313 75.4% Owner occupied102 24.6% Renter occupiedHouse owners and renters - American Indian / Alaska Native residents 30 100.0% Owner occupiedHouse owners and renters - Asian residents 914 74.1% Owner occupied320 25.9% Renter occupiedHouse owners and renters - Native Hawaiian / Pacific Islander residents 31 24.6% Owner occupied94 75.4% Renter occupiedHouse owners and renters - Other race residents 180 58.2% Owner occupied129 41.8% Renter occupiedHouse owners and renters - Two or more races residents 256 100.0% Owner occupiedHouse owners and renters - White alone residents 2,021 77.5% Owner occupied587 22.5% Renter occupiedHouse owners and renters - Hispanic or Latino residents 279 61.6% Owner occupied174 38.4% Renter occupied
Language usage in Lakeland North
English speakers - Total 61.8% of residents of Lakeland North speak English at home.
9.7% of residents speak Spanish at home 935 66.6% Speak English very well469 33.4% Speak English less than very well29.1% of residents speak other language at home 2,560 60.8% Speak English very well1,650 39.2% Speak English less than very well
English speakers - Born in the United States 88.1% of residents of Lakeland North speak English at home.
8.5% of residents speak Spanish at home 302 100.0% Speak English very well3.5% of residents speak other language at home 126 100.0% Speak English very well
English speakers - Native, born elsewhere 82.2% of residents of Lakeland North speak English at home.
12.2% of residents speak other language at home 98 100.0% Speak English very well
English speakers - Foreign-born 16.3% of residents of Lakeland North speak English at home.
17.4% of residents speak Spanish at home 438 53.5% Speak English very well381 46.5% Speak English less than very well66.2% of residents speak other language at home 1,544 49.4% Speak English very well1,579 50.6% Speak English less than very well
White (Caucasian) - Speak only English Native:
89.0% (5,504)Foreign-born:
12.8% (121)
White (Caucasian) - Speak another language Native:
10.9% (674)Foreign-born:
87.8% (830)
Black or African American - Speak only English Native:
95.1% (805)Foreign-born:
55.9% (354)
Black or African American - Speak another language Native:
5.1% (43)Foreign-born:
50.9% (322)
Asian - Speak only English Native:
37.6% (242)Foreign-born:
8.4% (184)
Asian - Speak another language Native:
65.1% (418)Foreign-born:
91.6% (2,004)
Native Hawaiian / Pacific Islander - Speak only English Native:
82.2% (309)Foreign-born:
52.3% (129)
Native Hawaiian / Pacific Islander - Speak another language Native:
6.6% (25)Foreign-born:
52.8% (130)
Other race - Speak only English Native:
61.9% (458)Foreign-born:
9.9% (62)
Other race - Speak another language Native:
39.1% (289)Foreign-born:
88.8% (552)
Two or more races - Speak another language Native:
15.5% (148)Foreign-born:
100.0% (66)
White alone - Speak only English Native:
91.0% (5,372)Foreign-born:
11.6% (82)
White alone - Speak another language Native:
9.5% (563)Foreign-born:
91.9% (653)
Hispanic or Latino - Speak only English Native:
55.9% (659)Foreign-born:
11.3% (103)
Hispanic or Latino - Speak another language Native:
44.0% (519)Foreign-born:
88.0% (796)
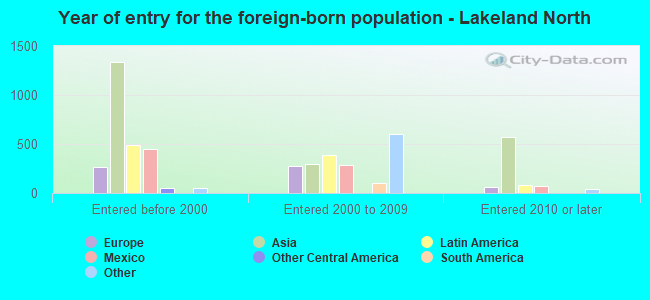
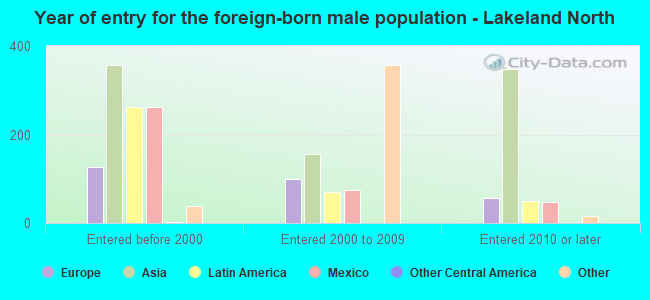
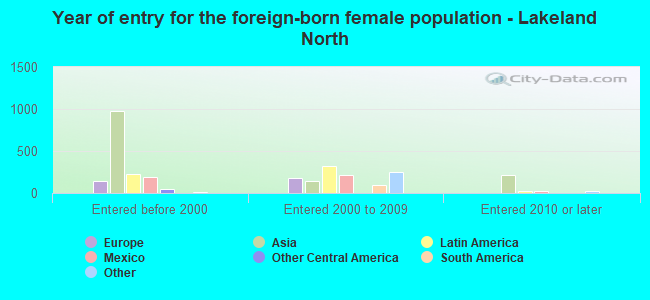
Foreign-born residents in Lakeland North 4,721 residents are foreign born (14.1% Asia , 6.7% Latin America , 4.3% Europe , 4.1% Africa ).
This city:
31.4%Washington:
14.9%
Marital status for residents in Lakeland North Marital status - White (Caucasian) population 15 years and over
Males 29.3% Never married57.6% Now married1.4% Separated1.7% Widowed10.0% DivorcedFemales 28.1% Never married49.0% Now married0.7% Separated6.7% Widowed15.5% DivorcedWomen who gave birth in the past 12 months Now married:
88.2% (69)Unmarried:
11.8% (9)
Women who did not give birth in the past 12 months Now married:
39.6% (588)Unmarried:
60.4% (896)
Marital status - Black or African American population 15 years and over
Males 30.9% Never married69.1% Now married0.0% Separated0.0% Widowed0.0% DivorcedFemales 40.3% Never married59.7% Now married0.0% Separated0.0% Widowed0.0% DivorcedWomen who did not give birth in the past 12 months Now married:
55.7% (289)Unmarried:
44.3% (230)
Marital status - American Indian / Alaska Native population 15 years and over
Males 15.2% Never married60.6% Now married24.2% Separated0.0% Widowed0.0% DivorcedFemales 0.0% Never married52.3% Now married0.0% Separated0.0% Widowed47.7% DivorcedMarital status - Asian population 15 years and over
Males 27.4% Never married72.6% Now married0.0% Separated0.0% Widowed0.0% DivorcedFemales 35.6% Never married37.6% Now married6.8% Separated5.7% Widowed14.3% DivorcedWomen who gave birth in the past 12 months Now married:
100.0% (22)Unmarried:
0.0% (0)
Women who did not give birth in the past 12 months Now married:
40.9% (407)Unmarried:
59.1% (588)
Marital status - Native Hawaiian / Pacific Islander population 15 years and over
Males 62.7% Never married37.3% Now married0.0% Separated0.0% Widowed0.0% DivorcedFemales 10.9% Never married89.1% Now married0.0% Separated0.0% Widowed0.0% DivorcedWomen who did not give birth in the past 12 months Now married:
87.5% (121)Unmarried:
12.5% (17)
Marital status - Other race population 15 years and over
Males 35.6% Never married48.2% Now married9.7% Separated6.5% Widowed0.0% DivorcedFemales 23.9% Never married23.1% Now married0.0% Separated37.8% Widowed15.3% DivorcedWomen who gave birth in the past 12 months Now married:
100.0% (30)Unmarried:
0.0% (0)
Women who did not give birth in the past 12 months Now married:
19.4% (63)Unmarried:
80.6% (262)
Marital status - Two or more races population 15 years and over
Males 67.6% Never married32.4% Now married0.0% Separated0.0% Widowed0.0% DivorcedFemales 57.8% Never married30.5% Now married0.0% Separated0.0% Widowed11.7% DivorcedWomen who did not give birth in the past 12 months Now married:
16.7% (48)Unmarried:
83.3% (238)
Marital status - White alone, not Hispanic / Latino population 15 years and over
Males 27.6% Never married61.2% Now married0.0% Separated1.5% Widowed9.6% DivorcedFemales 25.6% Never married50.1% Now married0.8% Separated7.1% Widowed16.5% DivorcedWomen who gave birth in the past 12 months Now married:
88.2% (71)Unmarried:
11.8% (10)
Women who did not give birth in the past 12 months Now married:
40.6% (542)Unmarried:
59.4% (794)
Marital status - Hispanic or Latino population 15 years and over
Males 42.0% Never married35.8% Now married10.7% Separated4.4% Widowed7.2% DivorcedFemales 37.2% Never married26.0% Now married0.0% Separated26.2% Widowed10.6% DivorcedWomen who gave birth in the past 12 months Now married:
100.0% (25)Unmarried:
0.0% (0)
Women who did not give birth in the past 12 months Now married:
22.8% (123)Unmarried:
77.2% (416)
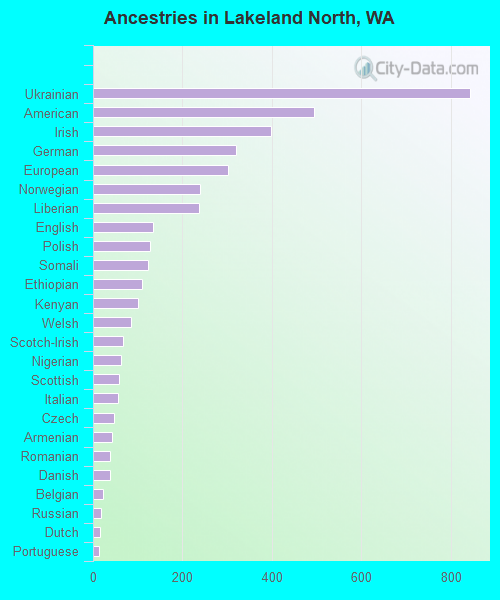
Ancestries in Lakeland North
843 10.0% Ukrainian493 5.9% American398 4.7% Irish320 3.8% German301 3.6% European240 2.8% Norwegian236 2.8% Liberian134 1.6% English128 1.5% Polish123 1.5% Somali110 1.3% Ethiopian101 1.2% Kenyan86 1.0% Welsh67 0.8% Scotch-Irish63 0.7% Nigerian59 0.7% Scottish56 0.7% Italian47 0.6% Czech43 0.5% Armenian38 0.5% Romanian37 0.4% Danish23 0.3% Belgian18 0.2% Russian15 0.2% Dutch13 0.2% Portuguese12 0.1% French Canadian10 0.1% Greek9 0.1% Bulgarian9 0.1% Icelander8 0.09% Northern European7 0.08% Scandinavian7 0.08% Swiss
Geographical mobility in Lakeland North Same house 1 year ago 6,716 91.8% White (Caucasian)1,035 68.9% Black or African American79 96.7% American Indian / Alaska Native2,798 97.9% Asian656 100.0% Native Hawaiian / Pacific Islander1,191 86.3% Other race1,008 84.9% Two or more races6,131 91.0% White alone, not Hispanic / Latino2,000 90.4% Hispanic or LatinoMoved within same county 451 6.2% White / Caucasian412 27.4% Black or African American36 1.3% Asian152 11.0% Other race100 8.4% Two or more races460 6.8% White alone, not Hispanic / Latino175 7.9% Hispanic or LatinoMoved within same state 140 1.9% White / Caucasian21 1.5% Other race105 8.8% Two or more races122 1.8% White alone, not Hispanic / Latino47 2.1% Hispanic or LatinoMoved from different state 50 0.7% White / Caucasian7 0.4% Black or African American52 0.8% White alone, not Hispanic / LatinoMoved from abroad 11 0.2% White12 0.2% White alone, not Hispanic / Latino
Children Nativity (place of birth) in Lakeland North
Children under 6 years - Living with two parents Both parents native 116 100.0% NativeBoth parents foreign-born 140 100.0% NativeOne native, one foreign-born parent 246 100.0% NativeChildren under 6 years - Living with one parent Native parent 149 100.0% NativeChildren 6 to 17 years - Living with two parents Both parents native 511 100.0% NativeBoth parents foreign-born 1,108 81.6% Native250 18.4% Foreign-bornOne native, one foreign-born parent 306 100.0% NativeChildren 6 to 17 years - Living with one parent Native parent 251 100.0% NativeForeign-born parent 269 50.9% Native260 49.1% Foreign-born
Grandparents responsible for own grandchildren in Lakeland North
Grandparents (30 to 59 years) White / Caucasian 92 36.4% Responsible for grandchildren161 63.6% Not responsible for grandchildrenBlack or African American 28 100.0% Not responsible for grandchildrenAsian 9 100.0% Not responsible for grandchildrenWhite alone, not Hispanic / Latino 51 29.8% Responsible for grandchildren120 70.2% Not responsible for grandchildrenHispanic or Latino 64 59.6% Responsible for grandchildren44 40.4% Not responsible for grandchildrenGrandparents (60 years and over) White / Caucasian 16 17.8% Responsible for grandchildren72 82.2% Not responsible for grandchildrenAsian 21 30.5% Responsible for grandchildren48 69.5% Not responsible for grandchildrenWhite alone, not Hispanic / Latino 15 17.4% Responsible for grandchildren73 82.6% Not responsible for grandchildrenHispanic or Latino 61 100.0% Not responsible for grandchildren