Races in Laredo, Texas (TX) Detailed Stats
Data:
Races - White alone (%)
Races - White alone (% change since 2000)
Races - Black alone (%)
Races - Black alone (% change since 2000)
Races - American Indian alone (%)
Races - American Indian alone (% change since 2000)
Races - Asian alone (%)
Races - Asian alone (% change since 2000)
Races - Hispanic (%)
Races - Hispanic (% change since 2000)
Races - Native Hawaiian and Other Pacific Islander alone (%)
Races - Native Hawaiian and Other Pacific Islander alone (% change since 2000)
Races - Two or more races(%)
Races - Two or more races(% change since 2000)
Races - Other race alone (%)
Races - Other race alone (% change since 2000)
Racial diversity
Place of birth - Born in state of residence (%)
Place of birth - Born in state of residence (%) - White
Place of birth - Born in state of residence (%) - Black or African American
Place of birth - Born in state of residence (%) - Asian
Place of birth - Born in state of residence (%) - Hispanic or Latino
Place of birth - Born in state of residence (%) - American Indian and Alaska Native
Place of birth - Born in state of residence (%) - Multirace
Place of birth - Born in state of residence (%) - Other Race
Place of birth - Born in other state (%)
Place of birth - Born in other state (%) - White
Place of birth - Born in other state (%) - Black or African American
Place of birth - Born in other state (%) - Asian
Place of birth - Born in other state (%) - Hispanic or Latino
Place of birth - Born in other state (%) - American Indian and Alaska Native
Place of birth - Born in other state (%) - Multirace
Place of birth - Born in other state (%) - Other Race
Place of birth - Native, outside of US (%)
Place of birth - Native, outside of US (%) - White
Place of birth - Native, outside of US (%) - Black or African American
Place of birth - Native, outside of US (%) - Asian
Place of birth - Native, outside of US (%) - Hispanic or Latino
Place of birth - Native, outside of US (%) - American Indian and Alaska Native
Place of birth - Native, outside of US (%) - Multirace
Place of birth - Native, outside of US (%) - Other Race
Place of birth - Foreign born (%)
Place of birth - Foreign born (%) - White
Place of birth - Foreign born (%) - Black or African American
Place of birth - Foreign born (%) - Asian
Place of birth - Foreign born (%) - Hispanic or Latino
Place of birth - Foreign born (%) - American Indian and Alaska Native
Place of birth - Foreign born (%) - Multirace
Place of birth - Foreign born (%) - Other Race
Residents speaking English at home (%)
Residents speaking English at home - Born in the United States (%)
Residents speaking English at home - Native, born elsewhere (%)
Residents speaking English at home - Foreign born (%)
Residents speaking Spanish at home (%)
Residents speaking Spanish at home - Born in the United States (%)
Residents speaking Spanish at home - Native, born elsewhere (%)
Residents speaking Spanish at home - Foreign born (%)
Residents speaking other language at home (%)
Residents speaking other language at home - Born in the United States (%)
Residents speaking other language at home - Native, born elsewhere (%)
Residents speaking other language at home - Foreign born (%)
Marital status - Never married (%)
Marital status - Now married (%)
Marital status - Separated (%)
Marital status - Widowed (%)
Marital status - Divorced (%)
Ancestries Reported - Arab (%)
Ancestries Reported - Czech (%)
Ancestries Reported - Danish (%)
Ancestries Reported - Dutch (%)
Ancestries Reported - English (%)
Ancestries Reported - French (%)
Ancestries Reported - French Canadian (%)
Ancestries Reported - German (%)
Ancestries Reported - Greek (%)
Ancestries Reported - Hungarian (%)
Ancestries Reported - Irish (%)
Ancestries Reported - Italian (%)
Ancestries Reported - Lithuanian (%)
Ancestries Reported - Norwegian (%)
Ancestries Reported - Polish (%)
Ancestries Reported - Portuguese (%)
Ancestries Reported - Russian (%)
Ancestries Reported - Scotch-Irish (%)
Ancestries Reported - Scottish (%)
Ancestries Reported - Slovak (%)
Ancestries Reported - Subsaharan African (%)
Ancestries Reported - Swedish (%)
Ancestries Reported - Swiss (%)
Ancestries Reported - Ukrainian (%)
Ancestries Reported - United States (%)
Ancestries Reported - Welsh (%)
Ancestries Reported - West Indian (%)
Ancestries Reported - Other (%)
Geographical mobility - Same house 1 year ago (%)
Geographical mobility - Same house 1 year ago (%) - White
Geographical mobility - Same house 1 year ago (%) - Black or African American
Geographical mobility - Same house 1 year ago (%) - Asian
Geographical mobility - Same house 1 year ago (%) - Hispanic or Latino
Geographical mobility - Same house 1 year ago (%) - American Indian and Alaska Native
Geographical mobility - Same house 1 year ago (%) - Multirace
Geographical mobility - Same house 1 year ago (%) - Other Race
Geographical mobility - Moved within same county (%)
Geographical mobility - Moved within same county (%) - White
Geographical mobility - Moved within same county (%) - Black or African American
Geographical mobility - Moved within same county (%) - Asian
Geographical mobility - Moved within same county (%) - Hispanic or Latino
Geographical mobility - Moved within same county (%) - American Indian and Alaska Native
Geographical mobility - Moved within same county (%) - Multirace
Geographical mobility - Moved within same county (%) - Other Race
Geographical mobility - Moved from different county within same state (%)
Geographical mobility - Moved from different county within same state (%) - White
Geographical mobility - Moved from different county within same state (%) - Black or African American
Geographical mobility - Moved from different county within same state (%) - Asian
Geographical mobility - Moved from different county within same state (%) - Hispanic or Latino
Geographical mobility - Moved from different county within same state (%) - American Indian and Alaska Native
Geographical mobility - Moved from different county within same state (%) - Multirace
Geographical mobility - Moved from different county within same state (%) - Other Race
Geographical mobility - Moved from different state (%)
Geographical mobility - Moved from different state (%) - White
Geographical mobility - Moved from different state (%) - Black or African American
Geographical mobility - Moved from different state (%) - Asian
Geographical mobility - Moved from different state (%) - Hispanic or Latino
Geographical mobility - Moved from different state (%) - American Indian and Alaska Native
Geographical mobility - Moved from different state (%) - Multirace
Geographical mobility - Moved from different state (%) - Other Race
Geographical mobility - Moved from abroad (%)
Geographical mobility - Moved from abroad (%) - White
Geographical mobility - Moved from abroad (%) - Black or African American
Geographical mobility - Moved from abroad (%) - Asian
Geographical mobility - Moved from abroad (%) - Hispanic or Latino
Geographical mobility - Moved from abroad (%) - American Indian and Alaska Native
Geographical mobility - Moved from abroad (%) - Multirace
Geographical mobility - Moved from abroad (%) - Other Race
Place of birth for the foreign-born population - Ireland (%)
Place of birth for the foreign-born population - Denmark (%)
Place of birth for the foreign-born population - Norway (%)
Place of birth for the foreign-born population - Sweden (%)
Place of birth for the foreign-born population - United Kingdom (%)
Place of birth for the foreign-born population - England (%)
Place of birth for the foreign-born population - Scotland (%)
Place of birth for the foreign-born population - Other Northern Europe (%)
Place of birth for the foreign-born population - Austria (%)
Place of birth for the foreign-born population - Belgium (%)
Place of birth for the foreign-born population - France (%)
Place of birth for the foreign-born population - Germany (%)
Place of birth for the foreign-born population - Netherlands (%)
Place of birth for the foreign-born population - Switzerland (%)
Place of birth for the foreign-born population - Other Western Europe (%)
Place of birth for the foreign-born population - Greece (%)
Place of birth for the foreign-born population - Italy (%)
Place of birth for the foreign-born population - Portugal (%)
Place of birth for the foreign-born population - Spain (%)
Place of birth for the foreign-born population - Other Southern Europe (%)
Place of birth for the foreign-born population - Albania (%)
Place of birth for the foreign-born population - Belarus (%)
Place of birth for the foreign-born population - Bosnia and Herzegovina (%)
Place of birth for the foreign-born population - Bulgaria (%)
Place of birth for the foreign-born population - Croatia (%)
Place of birth for the foreign-born population - Czechoslovakia (%)
Place of birth for the foreign-born population - Hungary (%)
Place of birth for the foreign-born population - Latvia (%)
Place of birth for the foreign-born population - Lithuania (%)
Place of birth for the foreign-born population - North Macedonia (Macedonia) (%)
Place of birth for the foreign-born population - Moldova (%)
Place of birth for the foreign-born population - Poland (%)
Place of birth for the foreign-born population - Romania (%)
Place of birth for the foreign-born population - Russia (%)
Place of birth for the foreign-born population - Serbia (%)
Place of birth for the foreign-born population - Ukraine (%)
Place of birth for the foreign-born population - Other Eastern Europe (%)
Place of birth for the foreign-born population - China (%)
Place of birth for the foreign-born population - Hong Kong (%)
Place of birth for the foreign-born population - Taiwan (%)
Place of birth for the foreign-born population - Japan (%)
Place of birth for the foreign-born population - Korea (%)
Place of birth for the foreign-born population - Other Eastern Asia (%)
Place of birth for the foreign-born population - Afghanistan (%)
Place of birth for the foreign-born population - Bangladesh (%)
Place of birth for the foreign-born population - India (%)
Place of birth for the foreign-born population - Iran (%)
Place of birth for the foreign-born population - Kazakhstan (%)
Place of birth for the foreign-born population - Nepal (%)
Place of birth for the foreign-born population - Pakistan (%)
Place of birth for the foreign-born population - Sri Lanka (%)
Place of birth for the foreign-born population - Uzbekistan (%)
Place of birth for the foreign-born population - Other South Central Asia (%)
Place of birth for the foreign-born population - Burma (%)
Place of birth for the foreign-born population - Cambodia (%)
Place of birth for the foreign-born population - Indonesia (%)
Place of birth for the foreign-born population - Laos (%)
Place of birth for the foreign-born population - Malaysia (%)
Place of birth for the foreign-born population - Philippines (%)
Place of birth for the foreign-born population - Singapore (%)
Place of birth for the foreign-born population - Thailand (%)
Place of birth for the foreign-born population - Vietnam (%)
Place of birth for the foreign-born population - Other South Eastern Asia (%)
Place of birth for the foreign-born population - Armenia (%)
Place of birth for the foreign-born population - Iraq (%)
Place of birth for the foreign-born population - Israel (%)
Place of birth for the foreign-born population - Jordan (%)
Place of birth for the foreign-born population - Kuwait (%)
Place of birth for the foreign-born population - Lebanon (%)
Place of birth for the foreign-born population - Saudi Arabia (%)
Place of birth for the foreign-born population - Syria (%)
Place of birth for the foreign-born population - Turkey (%)
Place of birth for the foreign-born population - Yemen (%)
Place of birth for the foreign-born population - Other Western Asia (%)
Place of birth for the foreign-born population - Eritrea (%)
Place of birth for the foreign-born population - Ethiopia (%)
Place of birth for the foreign-born population - Kenya (%)
Place of birth for the foreign-born population - Somalia (%)
Place of birth for the foreign-born population - Uganda (%)
Place of birth for the foreign-born population - Zimbabwe (%)
Place of birth for the foreign-born population - Other Eastern Africa (%)
Place of birth for the foreign-born population - Cameroon (%)
Place of birth for the foreign-born population - Congo (%)
Place of birth for the foreign-born population - Democratic Republic of Congo (Zaire) (%)
Place of birth for the foreign-born population - Other Middle Africa (%)
Place of birth for the foreign-born population - Egypt (%)
Place of birth for the foreign-born population - Morocco (%)
Place of birth for the foreign-born population - Sudan (%)
Place of birth for the foreign-born population - Other Northern Africa (%)
Place of birth for the foreign-born population - South Africa (%)
Place of birth for the foreign-born population - Other Southern Africa (%)
Place of birth for the foreign-born population - Cabo Verde (%)
Place of birth for the foreign-born population - Ghana (%)
Place of birth for the foreign-born population - Liberia (%)
Place of birth for the foreign-born population - Nigeria (%)
Place of birth for the foreign-born population - Senegal (%)
Place of birth for the foreign-born population - Sierra Leone (%)
Place of birth for the foreign-born population - Other Western Africa (%)
Place of birth for the foreign-born population - Australia (%)
Place of birth for the foreign-born population - New Zealand (%)
Place of birth for the foreign-born population - Fiji (%)
Place of birth for the foreign-born population - Micronesia (%)
Place of birth for the foreign-born population - Bahamas (%)
Place of birth for the foreign-born population - Barbados (%)
Place of birth for the foreign-born population - Cuba (%)
Place of birth for the foreign-born population - Dominica (%)
Place of birth for the foreign-born population - Dominican Republic (%)
Place of birth for the foreign-born population - Grenada (%)
Place of birth for the foreign-born population - Haiti (%)
Place of birth for the foreign-born population - Jamaica (%)
Place of birth for the foreign-born population - St. Vincent and the Grenadines (%)
Place of birth for the foreign-born population - Trinidad and Tobago (%)
Place of birth for the foreign-born population - West Indies (%)
Place of birth for the foreign-born population - Other Caribbean (%)
Place of birth for the foreign-born population - Belize (%)
Place of birth for the foreign-born population - Costa Rica (%)
Place of birth for the foreign-born population - El Salvador (%)
Place of birth for the foreign-born population - Guatemala (%)
Place of birth for the foreign-born population - Honduras (%)
Place of birth for the foreign-born population - Mexico (%)
Place of birth for the foreign-born population - Nicaragua (%)
Place of birth for the foreign-born population - Panama (%)
Place of birth for the foreign-born population - Other Central America (%)
Place of birth for the foreign-born population - Argentina (%)
Place of birth for the foreign-born population - Bolivia (%)
Place of birth for the foreign-born population - Brazil (%)
Place of birth for the foreign-born population - Chile (%)
Place of birth for the foreign-born population - Colombia (%)
Place of birth for the foreign-born population - Ecuador (%)
Place of birth for the foreign-born population - Guyana (%)
Place of birth for the foreign-born population - Peru (%)
Place of birth for the foreign-born population - Uruguay (%)
Place of birth for the foreign-born population - Venezuela (%)
Place of birth for the foreign-born population - Other South America (%)
Place of birth for the foreign-born population - Canada (%)
Place of birth for the foreign-born population - Other Northern America (%)
Place of birth for the foreign-born population - Other (%)
Latest news about races in Laredo, TX collected exclusively by city-data.com from local newspapers, TV, and radio stations
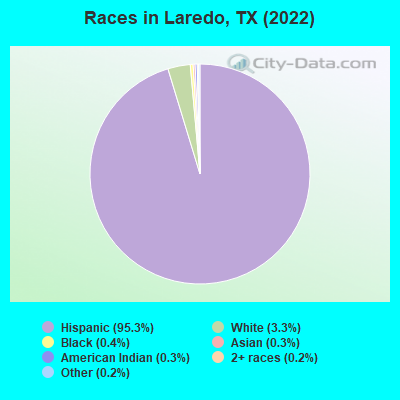
According to 2022 data, the most numerous races in Laredo, TX are Hispanic (242,186 residents), White alone (8,406 residents), and Black alone (1,074 residents). 13.8% of Laredo residents speak English at home. 26.0% of Laredo, TX residents are foreign-born (24.5% born in Latin America), which is 34.5% greater than the foreign-born rate of 17.0% across the entire state of Texas.
Race distribution in Laredo
2000 2022
10,933,313 52.4% White alone 6,669,666 32.0% Hispanic 2,364,255 11.3% Black alone 554,445 2.7% Asian alone 230,567 1.1% Two or more races 68,859 0.3% American Indian alone 19,958 0.10% Other race alone 10,757 0.05% Native Hawaiian and Other
12,070,642 40.2% Hispanic 11,683,430 38.9% White alone 3,508,706 11.7% Black alone 1,608,173 5.4% Asian alone 956,560 3.2% Two or more races 125,763 0.4% Other race alone 47,023 0.2% American Indian alone 29,275 0.10% Native Hawaiian and Other
Income and house value in Laredo Median household income in 2022 $94,338 White non-Hispanic householders$98,848 Black householdersover $200,000 American Indian and Alaska Native householders$110,159 Asian householders$58,767 Some other race householders$57,348 Two or more races householders$58,236 Hispanic or Latino race householdersMedian 2022 house value $243,171 White Non-Hispanic householders$153,803 Black or African American householders$149,606 American Indian or Alaska Native householders $315,753 Asian householders$186,637 Some other race householders$172,318 Two or more races householders$188,118 Hispanic or Latino householders
Median age by race in Laredo
31.7 Median age for White residents27.7 33.1 43.7 Median age for Black or African American residents42.2 53.9 56.0 Median age for American Indian / Alaska Native residents60.1 23.4 48.5 Median age for Asian residents43.8 49.9 -666,666,666.0 Median age for Native Hawaiian / Pacific Islander residents-666,666,666.0 -666,666,666.0 31.1 Median age for Other race residents31.6 29.5 29.7 Median age for Two or more races residents28.5 31.2 42.4 Median age for White alone residents33.7 44.7 29.6 Median age for Hispanic or Latino residents28.5 30.8
Owner/renter occupied households by race in Laredo
House owners and renters - White residents 9,146 65.7% Owner occupied4,778 34.3% Renter occupiedHouse owners and renters - Black or African American residents 320 43.5% Owner occupied415 56.5% Renter occupiedHouse owners and renters - American Indian / Alaska Native residents 278 68.9% Owner occupied126 31.1% Renter occupiedHouse owners and renters - Asian residents 481 65.3% Owner occupied255 34.7% Renter occupiedHouse owners and renters - Other race residents 4,558 58.9% Owner occupied3,183 41.1% Renter occupiedHouse owners and renters - Two or more races residents 34,598 62.3% Owner occupied20,946 37.7% Renter occupiedHouse owners and renters - White alone residents 1,822 62.0% Owner occupied1,116 38.0% Renter occupiedHouse owners and renters - Hispanic or Latino residents 46,376 62.4% Owner occupied27,903 37.6% Renter occupied
Language usage in Laredo
English speakers - Total 13.8% of residents of Laredo speak English at home.
85.5% of residents speak Spanish at home 108,660 54.3% Speak English very well91,459 45.7% Speak English less than very well0.8% of residents speak other language at home 1,104 61.9% Speak English very well679 38.1% Speak English less than very well
English speakers - Born in the United States 31.3% of residents of Laredo speak English at home.
65.8% of residents speak Spanish at home 5,268 83.3% Speak English very well1,058 16.7% Speak English less than very well2.8% of residents speak other language at home 195 71.4% Speak English very well78 28.6% Speak English less than very well
English speakers - Native, born elsewhere 7.9% of residents of Laredo speak English at home.
92.1% of residents speak Spanish at home 2,212 61.0% Speak English very well1,416 39.0% Speak English less than very well
English speakers - Foreign-born 6.1% of residents of Laredo speak English at home.
92.5% of residents speak Spanish at home 13,027 21.9% Speak English very well46,327 78.1% Speak English less than very well1.4% of residents speak other language at home 329 35.4% Speak English very well601 64.6% Speak English less than very well
White (Caucasian) - Speak only English Native:
27.8% (9,459)Foreign-born:
10.1% (713)
White (Caucasian) - Speak another language Native:
72.2% (24,522)Foreign-born:
89.9% (6,337)
Black or African American - Speak only English Native:
81.4% (631)Foreign-born:
39.4% (193)
Black or African American - Speak another language Native:
18.5% (143)Foreign-born:
59.4% (291)
American Indian / Alaska Native - Speak only English Native:
44.5% (280)Foreign-born:
8.6% (43)
American Indian / Alaska Native - Speak another language Native:
57.5% (362)Foreign-born:
91.7% (455)
Asian - Speak only English Native:
15.0% (92)Foreign-born:
17.4% (154)
Asian - Speak another language Native:
84.2% (514)Foreign-born:
82.8% (733)
Other race - Speak only English Native:
11.8% (1,909)Foreign-born:
20.4% (1,682)
Other race - Speak another language Native:
88.2% (14,215)Foreign-born:
79.6% (6,552)
Two or more races - Speak only English Native:
12.8% (14,996)Foreign-born:
2.7% (1,279)
Two or more races - Speak another language Native:
87.2% (102,132)Foreign-born:
97.3% (46,380)
White alone - Speak another language Native:
41.0% (3,138)Foreign-born:
100.0% (376)
Hispanic or Latino - Speak only English Native:
13.6% (21,760)Foreign-born:
6.0% (3,768)
Hispanic or Latino - Speak another language Native:
86.4% (137,958)Foreign-born:
94.0% (59,240)
Foreign-born residents in Laredo 66,397 residents are foreign born (24.5% Latin America ).
This city:
26.0%Texas:
17.1%
Marital status for residents in Laredo Marital status - White (Caucasian) population 15 years and over
Males 44.0% Never married50.6% Now married1.8% Separated2.1% Widowed1.5% DivorcedFemales 33.4% Never married43.9% Now married3.5% Separated10.7% Widowed8.5% DivorcedWomen who gave birth in the past 12 months Now married:
81.1% (219)Unmarried:
18.9% (51)
Women who did not give birth in the past 12 months Now married:
42.0% (4,646)Unmarried:
58.0% (6,405)
Marital status - Black or African American population 15 years and over
Males 32.2% Never married36.9% Now married5.8% Separated0.0% Widowed25.2% DivorcedFemales 52.5% Never married32.6% Now married8.3% Separated0.0% Widowed6.5% DivorcedWomen who gave birth in the past 12 months Now married:
27.6% (8)Unmarried:
72.4% (21)
Women who did not give birth in the past 12 months Now married:
43.0% (99)Unmarried:
57.0% (131)
Marital status - American Indian / Alaska Native population 15 years and over
Males 39.3% Never married48.8% Now married0.0% Separated0.0% Widowed11.8% DivorcedFemales 22.6% Never married67.1% Now married2.1% Separated4.9% Widowed3.3% DivorcedWomen who did not give birth in the past 12 months Now married:
65.7% (135)Unmarried:
34.3% (70)
Marital status - Asian population 15 years and over
Males 72.2% Never married27.8% Now married0.0% Separated0.0% Widowed0.0% DivorcedFemales 28.2% Never married57.0% Now married13.6% Separated0.0% Widowed1.2% DivorcedWomen who did not give birth in the past 12 months Now married:
60.9% (315)Unmarried:
39.1% (202)
Marital status - Other race population 15 years and over
Males 41.5% Never married46.3% Now married4.1% Separated2.9% Widowed5.3% DivorcedFemales 37.4% Never married42.5% Now married4.7% Separated8.4% Widowed7.0% DivorcedWomen who gave birth in the past 12 months Now married:
50.0% (96)Unmarried:
50.0% (96)
Women who did not give birth in the past 12 months Now married:
42.1% (2,714)Unmarried:
57.9% (3,730)
Marital status - Two or more races population 15 years and over
Males 38.4% Never married51.7% Now married2.4% Separated2.6% Widowed4.9% DivorcedFemales 34.8% Never married44.9% Now married3.4% Separated8.7% Widowed8.2% DivorcedWomen who gave birth in the past 12 months Now married:
41.7% (879)Unmarried:
58.3% (1,231)
Women who did not give birth in the past 12 months Now married:
45.4% (19,592)Unmarried:
54.6% (23,582)
Marital status - White alone, not Hispanic / Latino population 15 years and over
Males 38.5% Never married53.6% Now married5.6% Separated2.3% Widowed0.0% DivorcedFemales 13.9% Never married42.2% Now married0.7% Separated24.8% Widowed18.4% DivorcedWomen who gave birth in the past 12 months Now married:
88.5% (100)Unmarried:
11.5% (13)
Women who did not give birth in the past 12 months Now married:
38.4% (653)Unmarried:
61.6% (1,046)
Marital status - Hispanic or Latino population 15 years and over
Males 39.9% Never married51.0% Now married2.3% Separated2.4% Widowed4.4% DivorcedFemales 35.9% Never married44.2% Now married3.7% Separated8.5% Widowed7.7% DivorcedWomen who gave birth in the past 12 months Now married:
44.5% (1,094)Unmarried:
55.5% (1,365)
Women who did not give birth in the past 12 months Now married:
44.2% (26,153)Unmarried:
55.8% (33,066)
Ancestries in Laredo
2,462 1.2% American585 0.3% German446 0.2% English432 0.2% Irish243 0.1% Italian141 0.07% African135 0.06% Scotch-Irish121 0.06% Bulgarian63 0.03% Scottish56 0.03% French Canadian47 0.02% European45 0.02% Polish43 0.02% Russian40 0.02% Austrian40 0.02% Nigerian37 0.02% Yugoslavian33 0.02% Ukrainian32 0.02% Iraqi28 0.01% Norwegian28 0.01% Slovak20 0.01% Greek18 0.01% Brazilian15 0.01% Syrian15 0.01% British14 0.01% Scandinavian
Geographical mobility in Laredo Same house 1 year ago 40,538 92.6% White (Caucasian)1,082 81.6% Black or African American1,040 96.5% American Indian / Alaska Native1,290 85.2% Asian22,520 87.1% Other race160,540 90.1% Two or more races7,176 88.7% White alone, not Hispanic / Latino216,725 90.3% Hispanic or LatinoMoved within same county 1,418 3.2% White / Caucasian62 4.7% Black or African American20 1.9% American Indian / Alaska Native80 5.3% Asian2,443 9.5% Other race14,380 8.1% Two or more races465 5.7% White alone, not Hispanic / Latino18,150 7.6% Hispanic or LatinoMoved within same state 815 1.9% White / Caucasian41 3.1% Black or African American15 1.4% American Indian / Alaska Native59 3.9% Asian243 0.9% Other race1,095 0.6% Two or more races240 3.0% White alone, not Hispanic / Latino1,740 0.7% Hispanic or LatinoMoved from different state 831 1.9% White / Caucasian130 9.8% Black or African American16 1.5% American Indian / Alaska Native25 0.1% Other race95 0.1% Two or more races183 2.3% White alone, not Hispanic / Latino367 0.2% Hispanic or LatinoMoved from abroad 164 0.4% White33 2.5% Black or African American4 0.4% American Indian / Alaska Native80 5.3% Asian270 1.0% Other race2,144 1.2% Two or more races27 0.3% White alone, not Hispanic / Latino2,977 1.2% Hispanic or Latino
Children Nativity (place of birth) in Laredo
Children under 6 years - Living with two parents Both parents native 3,988 100.0% NativeBoth parents foreign-born 1,963 91.2% Native189 8.8% Foreign-bornOne native, one foreign-born parent 4,835 100.0% NativeChildren under 6 years - Living with one parent Native parent 8,756 100.0% NativeForeign-born parent 1,651 96.2% Native66 3.8% Foreign-bornChildren 6 to 17 years - Living with two parents Both parents native 14,150 100.0% NativeBoth parents foreign-born 8,182 88.0% Native1,121 12.0% Foreign-bornOne native, one foreign-born parent 7,697 97.3% Native210 2.7% Foreign-bornChildren 6 to 17 years - Living with one parent Native parent 14,321 100.0% NativeForeign-born parent 5,688 51.3% Native5,403 48.7% Foreign-born
Place of birth for residents in Laredo 64,883 Americas64,795 Latin America63,403 Central America920 Asia785 South America606 Caribbean476 Eastern Asia361 Europe330 South Eastern Asia242 China232 Africa205 Eastern Europe117 Eastern Africa88 Northern America76 Middle Africa74 Northern Europe65 Southern Europe63 Western Asia49 South Central Asia38 Western Africa16 Western Europe
Grandparents responsible for own grandchildren in Laredo
Grandparents (30 to 59 years) White / Caucasian 142 52.2% Responsible for grandchildren130 47.8% Not responsible for grandchildrenAmerican Indian / Alaska Native 53 100.0% Not responsible for grandchildrenOther race 115 49.0% Responsible for grandchildren120 51.0% Not responsible for grandchildrenTwo or more races 813 24.4% Responsible for grandchildren2,519 75.6% Not responsible for grandchildrenWhite alone, not Hispanic / Latino 94 100.0% Not responsible for grandchildrenHispanic or Latino 1,176 30.7% Responsible for grandchildren2,649 69.3% Not responsible for grandchildrenGrandparents (60 years and over) White / Caucasian 333 32.1% Responsible for grandchildren703 67.9% Not responsible for grandchildrenOther race 139 19.4% Responsible for grandchildren577 80.6% Not responsible for grandchildrenTwo or more races 768 23.4% Responsible for grandchildren2,511 76.6% Not responsible for grandchildrenWhite alone, not Hispanic / Latino 86 22.0% Responsible for grandchildren304 78.0% Not responsible for grandchildrenHispanic or Latino 895 19.6% Responsible for grandchildren3,673 80.4% Not responsible for grandchildren