Races in Lincolnia, Virginia (VA) Detailed Stats
Data:
Races - White alone (%)
Races - White alone (% change since 2000)
Races - Black alone (%)
Races - Black alone (% change since 2000)
Races - American Indian alone (%)
Races - American Indian alone (% change since 2000)
Races - Asian alone (%)
Races - Asian alone (% change since 2000)
Races - Hispanic (%)
Races - Hispanic (% change since 2000)
Races - Native Hawaiian and Other Pacific Islander alone (%)
Races - Native Hawaiian and Other Pacific Islander alone (% change since 2000)
Races - Two or more races(%)
Races - Two or more races(% change since 2000)
Races - Other race alone (%)
Races - Other race alone (% change since 2000)
Racial diversity
Place of birth - Born in state of residence (%)
Place of birth - Born in state of residence (%) - White
Place of birth - Born in state of residence (%) - Black or African American
Place of birth - Born in state of residence (%) - Asian
Place of birth - Born in state of residence (%) - Hispanic or Latino
Place of birth - Born in state of residence (%) - American Indian and Alaska Native
Place of birth - Born in state of residence (%) - Multirace
Place of birth - Born in state of residence (%) - Other Race
Place of birth - Born in other state (%)
Place of birth - Born in other state (%) - White
Place of birth - Born in other state (%) - Black or African American
Place of birth - Born in other state (%) - Asian
Place of birth - Born in other state (%) - Hispanic or Latino
Place of birth - Born in other state (%) - American Indian and Alaska Native
Place of birth - Born in other state (%) - Multirace
Place of birth - Born in other state (%) - Other Race
Place of birth - Native, outside of US (%)
Place of birth - Native, outside of US (%) - White
Place of birth - Native, outside of US (%) - Black or African American
Place of birth - Native, outside of US (%) - Asian
Place of birth - Native, outside of US (%) - Hispanic or Latino
Place of birth - Native, outside of US (%) - American Indian and Alaska Native
Place of birth - Native, outside of US (%) - Multirace
Place of birth - Native, outside of US (%) - Other Race
Place of birth - Foreign born (%)
Place of birth - Foreign born (%) - White
Place of birth - Foreign born (%) - Black or African American
Place of birth - Foreign born (%) - Asian
Place of birth - Foreign born (%) - Hispanic or Latino
Place of birth - Foreign born (%) - American Indian and Alaska Native
Place of birth - Foreign born (%) - Multirace
Place of birth - Foreign born (%) - Other Race
Residents speaking English at home (%)
Residents speaking English at home - Born in the United States (%)
Residents speaking English at home - Native, born elsewhere (%)
Residents speaking English at home - Foreign born (%)
Residents speaking Spanish at home (%)
Residents speaking Spanish at home - Born in the United States (%)
Residents speaking Spanish at home - Native, born elsewhere (%)
Residents speaking Spanish at home - Foreign born (%)
Residents speaking other language at home (%)
Residents speaking other language at home - Born in the United States (%)
Residents speaking other language at home - Native, born elsewhere (%)
Residents speaking other language at home - Foreign born (%)
Marital status - Never married (%)
Marital status - Now married (%)
Marital status - Separated (%)
Marital status - Widowed (%)
Marital status - Divorced (%)
Ancestries Reported - Arab (%)
Ancestries Reported - Czech (%)
Ancestries Reported - Danish (%)
Ancestries Reported - Dutch (%)
Ancestries Reported - English (%)
Ancestries Reported - French (%)
Ancestries Reported - French Canadian (%)
Ancestries Reported - German (%)
Ancestries Reported - Greek (%)
Ancestries Reported - Hungarian (%)
Ancestries Reported - Irish (%)
Ancestries Reported - Italian (%)
Ancestries Reported - Lithuanian (%)
Ancestries Reported - Norwegian (%)
Ancestries Reported - Polish (%)
Ancestries Reported - Portuguese (%)
Ancestries Reported - Russian (%)
Ancestries Reported - Scotch-Irish (%)
Ancestries Reported - Scottish (%)
Ancestries Reported - Slovak (%)
Ancestries Reported - Subsaharan African (%)
Ancestries Reported - Swedish (%)
Ancestries Reported - Swiss (%)
Ancestries Reported - Ukrainian (%)
Ancestries Reported - United States (%)
Ancestries Reported - Welsh (%)
Ancestries Reported - West Indian (%)
Ancestries Reported - Other (%)
Geographical mobility - Same house 1 year ago (%)
Geographical mobility - Same house 1 year ago (%) - White
Geographical mobility - Same house 1 year ago (%) - Black or African American
Geographical mobility - Same house 1 year ago (%) - Asian
Geographical mobility - Same house 1 year ago (%) - Hispanic or Latino
Geographical mobility - Same house 1 year ago (%) - American Indian and Alaska Native
Geographical mobility - Same house 1 year ago (%) - Multirace
Geographical mobility - Same house 1 year ago (%) - Other Race
Geographical mobility - Moved within same county (%)
Geographical mobility - Moved within same county (%) - White
Geographical mobility - Moved within same county (%) - Black or African American
Geographical mobility - Moved within same county (%) - Asian
Geographical mobility - Moved within same county (%) - Hispanic or Latino
Geographical mobility - Moved within same county (%) - American Indian and Alaska Native
Geographical mobility - Moved within same county (%) - Multirace
Geographical mobility - Moved within same county (%) - Other Race
Geographical mobility - Moved from different county within same state (%)
Geographical mobility - Moved from different county within same state (%) - White
Geographical mobility - Moved from different county within same state (%) - Black or African American
Geographical mobility - Moved from different county within same state (%) - Asian
Geographical mobility - Moved from different county within same state (%) - Hispanic or Latino
Geographical mobility - Moved from different county within same state (%) - American Indian and Alaska Native
Geographical mobility - Moved from different county within same state (%) - Multirace
Geographical mobility - Moved from different county within same state (%) - Other Race
Geographical mobility - Moved from different state (%)
Geographical mobility - Moved from different state (%) - White
Geographical mobility - Moved from different state (%) - Black or African American
Geographical mobility - Moved from different state (%) - Asian
Geographical mobility - Moved from different state (%) - Hispanic or Latino
Geographical mobility - Moved from different state (%) - American Indian and Alaska Native
Geographical mobility - Moved from different state (%) - Multirace
Geographical mobility - Moved from different state (%) - Other Race
Geographical mobility - Moved from abroad (%)
Geographical mobility - Moved from abroad (%) - White
Geographical mobility - Moved from abroad (%) - Black or African American
Geographical mobility - Moved from abroad (%) - Asian
Geographical mobility - Moved from abroad (%) - Hispanic or Latino
Geographical mobility - Moved from abroad (%) - American Indian and Alaska Native
Geographical mobility - Moved from abroad (%) - Multirace
Geographical mobility - Moved from abroad (%) - Other Race
Place of birth for the foreign-born population - Ireland (%)
Place of birth for the foreign-born population - Denmark (%)
Place of birth for the foreign-born population - Norway (%)
Place of birth for the foreign-born population - Sweden (%)
Place of birth for the foreign-born population - United Kingdom (%)
Place of birth for the foreign-born population - England (%)
Place of birth for the foreign-born population - Scotland (%)
Place of birth for the foreign-born population - Other Northern Europe (%)
Place of birth for the foreign-born population - Austria (%)
Place of birth for the foreign-born population - Belgium (%)
Place of birth for the foreign-born population - France (%)
Place of birth for the foreign-born population - Germany (%)
Place of birth for the foreign-born population - Netherlands (%)
Place of birth for the foreign-born population - Switzerland (%)
Place of birth for the foreign-born population - Other Western Europe (%)
Place of birth for the foreign-born population - Greece (%)
Place of birth for the foreign-born population - Italy (%)
Place of birth for the foreign-born population - Portugal (%)
Place of birth for the foreign-born population - Spain (%)
Place of birth for the foreign-born population - Other Southern Europe (%)
Place of birth for the foreign-born population - Albania (%)
Place of birth for the foreign-born population - Belarus (%)
Place of birth for the foreign-born population - Bosnia and Herzegovina (%)
Place of birth for the foreign-born population - Bulgaria (%)
Place of birth for the foreign-born population - Croatia (%)
Place of birth for the foreign-born population - Czechoslovakia (%)
Place of birth for the foreign-born population - Hungary (%)
Place of birth for the foreign-born population - Latvia (%)
Place of birth for the foreign-born population - Lithuania (%)
Place of birth for the foreign-born population - North Macedonia (Macedonia) (%)
Place of birth for the foreign-born population - Moldova (%)
Place of birth for the foreign-born population - Poland (%)
Place of birth for the foreign-born population - Romania (%)
Place of birth for the foreign-born population - Russia (%)
Place of birth for the foreign-born population - Serbia (%)
Place of birth for the foreign-born population - Ukraine (%)
Place of birth for the foreign-born population - Other Eastern Europe (%)
Place of birth for the foreign-born population - China (%)
Place of birth for the foreign-born population - Hong Kong (%)
Place of birth for the foreign-born population - Taiwan (%)
Place of birth for the foreign-born population - Japan (%)
Place of birth for the foreign-born population - Korea (%)
Place of birth for the foreign-born population - Other Eastern Asia (%)
Place of birth for the foreign-born population - Afghanistan (%)
Place of birth for the foreign-born population - Bangladesh (%)
Place of birth for the foreign-born population - India (%)
Place of birth for the foreign-born population - Iran (%)
Place of birth for the foreign-born population - Kazakhstan (%)
Place of birth for the foreign-born population - Nepal (%)
Place of birth for the foreign-born population - Pakistan (%)
Place of birth for the foreign-born population - Sri Lanka (%)
Place of birth for the foreign-born population - Uzbekistan (%)
Place of birth for the foreign-born population - Other South Central Asia (%)
Place of birth for the foreign-born population - Burma (%)
Place of birth for the foreign-born population - Cambodia (%)
Place of birth for the foreign-born population - Indonesia (%)
Place of birth for the foreign-born population - Laos (%)
Place of birth for the foreign-born population - Malaysia (%)
Place of birth for the foreign-born population - Philippines (%)
Place of birth for the foreign-born population - Singapore (%)
Place of birth for the foreign-born population - Thailand (%)
Place of birth for the foreign-born population - Vietnam (%)
Place of birth for the foreign-born population - Other South Eastern Asia (%)
Place of birth for the foreign-born population - Armenia (%)
Place of birth for the foreign-born population - Iraq (%)
Place of birth for the foreign-born population - Israel (%)
Place of birth for the foreign-born population - Jordan (%)
Place of birth for the foreign-born population - Kuwait (%)
Place of birth for the foreign-born population - Lebanon (%)
Place of birth for the foreign-born population - Saudi Arabia (%)
Place of birth for the foreign-born population - Syria (%)
Place of birth for the foreign-born population - Turkey (%)
Place of birth for the foreign-born population - Yemen (%)
Place of birth for the foreign-born population - Other Western Asia (%)
Place of birth for the foreign-born population - Eritrea (%)
Place of birth for the foreign-born population - Ethiopia (%)
Place of birth for the foreign-born population - Kenya (%)
Place of birth for the foreign-born population - Somalia (%)
Place of birth for the foreign-born population - Uganda (%)
Place of birth for the foreign-born population - Zimbabwe (%)
Place of birth for the foreign-born population - Other Eastern Africa (%)
Place of birth for the foreign-born population - Cameroon (%)
Place of birth for the foreign-born population - Congo (%)
Place of birth for the foreign-born population - Democratic Republic of Congo (Zaire) (%)
Place of birth for the foreign-born population - Other Middle Africa (%)
Place of birth for the foreign-born population - Egypt (%)
Place of birth for the foreign-born population - Morocco (%)
Place of birth for the foreign-born population - Sudan (%)
Place of birth for the foreign-born population - Other Northern Africa (%)
Place of birth for the foreign-born population - South Africa (%)
Place of birth for the foreign-born population - Other Southern Africa (%)
Place of birth for the foreign-born population - Cabo Verde (%)
Place of birth for the foreign-born population - Ghana (%)
Place of birth for the foreign-born population - Liberia (%)
Place of birth for the foreign-born population - Nigeria (%)
Place of birth for the foreign-born population - Senegal (%)
Place of birth for the foreign-born population - Sierra Leone (%)
Place of birth for the foreign-born population - Other Western Africa (%)
Place of birth for the foreign-born population - Australia (%)
Place of birth for the foreign-born population - New Zealand (%)
Place of birth for the foreign-born population - Fiji (%)
Place of birth for the foreign-born population - Micronesia (%)
Place of birth for the foreign-born population - Bahamas (%)
Place of birth for the foreign-born population - Barbados (%)
Place of birth for the foreign-born population - Cuba (%)
Place of birth for the foreign-born population - Dominica (%)
Place of birth for the foreign-born population - Dominican Republic (%)
Place of birth for the foreign-born population - Grenada (%)
Place of birth for the foreign-born population - Haiti (%)
Place of birth for the foreign-born population - Jamaica (%)
Place of birth for the foreign-born population - St. Vincent and the Grenadines (%)
Place of birth for the foreign-born population - Trinidad and Tobago (%)
Place of birth for the foreign-born population - West Indies (%)
Place of birth for the foreign-born population - Other Caribbean (%)
Place of birth for the foreign-born population - Belize (%)
Place of birth for the foreign-born population - Costa Rica (%)
Place of birth for the foreign-born population - El Salvador (%)
Place of birth for the foreign-born population - Guatemala (%)
Place of birth for the foreign-born population - Honduras (%)
Place of birth for the foreign-born population - Mexico (%)
Place of birth for the foreign-born population - Nicaragua (%)
Place of birth for the foreign-born population - Panama (%)
Place of birth for the foreign-born population - Other Central America (%)
Place of birth for the foreign-born population - Argentina (%)
Place of birth for the foreign-born population - Bolivia (%)
Place of birth for the foreign-born population - Brazil (%)
Place of birth for the foreign-born population - Chile (%)
Place of birth for the foreign-born population - Colombia (%)
Place of birth for the foreign-born population - Ecuador (%)
Place of birth for the foreign-born population - Guyana (%)
Place of birth for the foreign-born population - Peru (%)
Place of birth for the foreign-born population - Uruguay (%)
Place of birth for the foreign-born population - Venezuela (%)
Place of birth for the foreign-born population - Other South America (%)
Place of birth for the foreign-born population - Canada (%)
Place of birth for the foreign-born population - Other Northern America (%)
Place of birth for the foreign-born population - Other (%)
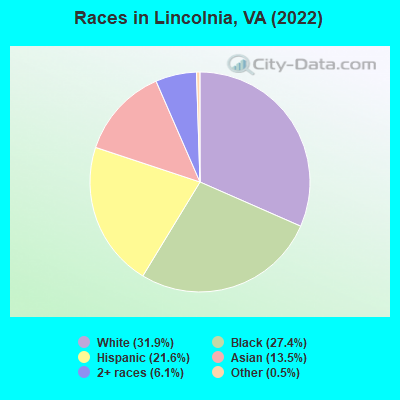
According to 2022 data, the most numerous races in Lincolnia, VA are White alone (6,273 residents), Black alone (5,402 residents), and Hispanic (4,247 residents). 57.1% of Lincolnia residents speak English at home. 36.5% of Lincolnia, VA residents are foreign-born (11.8% born in Latin America, 11.7% born in Asia, 11.4% born in Africa), which is 67.1% greater than the foreign-born rate of 12.0% across the entire state of Virginia.
Race distribution in Lincolnia
2000 2022
4,965,637 70.2% White alone 1,376,378 19.4% Black alone 329,540 4.7% Hispanic 259,277 3.7% Asian alone 114,022 1.6% Two or more races 18,596 0.3% American Indian alone 11,685 0.2% Other race alone 3,380 0.05% Native Hawaiian and Other
5,095,130 58.7% White alone 1,594,785 18.4% Black alone 905,750 10.4% Hispanic 602,881 6.9% Asian alone 406,047 4.7% Two or more races 60,419 0.7% Other race alone 11,738 0.1% American Indian alone 6,869 0.08% Native Hawaiian and Other
Income and house value in Lincolnia Median household income in 2022 $152,033 White non-Hispanic householders$93,566 Black householders$114,481 Asian householders$43,463 Some other race householders$167,020 Two or more races householders$92,509 Hispanic or Latino race householdersMedian 2022 house value $626,941 White Non-Hispanic householders$618,102 Black or African American householders$213,827 American Indian or Alaska Native householders $599,286 Asian householders$611,260 Some other race householders$547,682 Two or more races householders$610,405 Hispanic or Latino householders
Median age by race in Lincolnia
41.2 Median age for White residents41.7 40.6 37.6 Median age for Black or African American residents35.6 39.3 35.9 Median age for American Indian / Alaska Native residents-964,539,006.1 31.7 45.7 Median age for Asian residents47.6 42.2 -666,666,666.0 Median age for Native Hawaiian / Pacific Islander residents-558,791,801.0 -584,518,166.9 36.7 Median age for Other race residents34.2 38.7 33.1 Median age for Two or more races residents33.8 36.8 42.1 Median age for White alone residents41.2 42.8 35.3 Median age for Hispanic or Latino residents37.5 31.7
Owner/renter occupied households by race in Lincolnia
House owners and renters - White residents 2,539 72.2% Owner occupied978 27.8% Renter occupiedHouse owners and renters - Black or African American residents 562 26.6% Owner occupied1,548 73.4% Renter occupiedHouse owners and renters - American Indian / Alaska Native residents 8 100.0% Owner occupiedHouse owners and renters - Asian residents 666 70.3% Owner occupied281 29.7% Renter occupiedHouse owners and renters - Native Hawaiian / Pacific Islander residents 12 100.0% Renter occupiedHouse owners and renters - Other race residents 99 24.9% Owner occupied297 75.1% Renter occupiedHouse owners and renters - Two or more races residents 401 55.4% Owner occupied323 44.6% Renter occupiedHouse owners and renters - White alone residents 2,347 73.5% Owner occupied848 26.5% Renter occupiedHouse owners and renters - Hispanic or Latino residents 468 44.8% Owner occupied575 55.2% Renter occupied
Language usage in Lincolnia
English speakers - Total 57.1% of residents of Lincolnia speak English at home.
17.7% of residents speak Spanish at home 1,825 55.0% Speak English very well1,491 45.0% Speak English less than very well24.9% of residents speak other language at home 3,006 64.2% Speak English very well1,673 35.8% Speak English less than very well
English speakers - Born in the United States 89.5% of residents of Lincolnia speak English at home.
7.9% of residents speak Spanish at home 341 67.0% Speak English very well168 33.0% Speak English less than very well3.3% of residents speak other language at home 148 70.1% Speak English very well63 29.9% Speak English less than very well
English speakers - Native, born elsewhere 62.5% of residents of Lincolnia speak English at home.
8.4% of residents speak Spanish at home 41 100.0% Speak English very well29.5% of residents speak other language at home 145 100.0% Speak English very well
English speakers - Foreign-born 15.8% of residents of Lincolnia speak English at home.
29.4% of residents speak Spanish at home 963 45.9% Speak English very well1,136 54.1% Speak English less than very well54.8% of residents speak other language at home 2,321 59.2% Speak English very well1,597 40.8% Speak English less than very well
White (Caucasian) - Speak only English Native:
88.6% (5,167)Foreign-born:
19.6% (248)
White (Caucasian) - Speak another language Native:
10.0% (583)Foreign-born:
78.2% (987)
Black or African American - Speak only English Native:
93.6% (2,623)Foreign-born:
18.3% (443)
Black or African American - Speak another language Native:
5.3% (149)Foreign-born:
80.3% (1,937)
American Indian / Alaska Native - Speak another language Native:
97.8% (30)Foreign-born:
100.0% (32)
Asian - Speak only English Native:
52.1% (363)Foreign-born:
15.6% (300)
Asian - Speak another language Native:
47.7% (332)Foreign-born:
84.7% (1,628)
Other race - Speak only English Native:
23.4% (175)Foreign-born:
7.7% (56)
Other race - Speak another language Native:
70.5% (527)Foreign-born:
92.2% (674)
Two or more races - Speak only English Native:
81.2% (1,384)Foreign-born:
19.7% (142)
Two or more races - Speak another language Native:
18.3% (312)Foreign-born:
80.1% (577)
White alone - Speak only English Native:
93.0% (4,950)Foreign-born:
37.4% (253)
White alone - Speak another language Native:
6.9% (365)Foreign-born:
63.9% (433)
Hispanic or Latino - Speak only English Native:
39.9% (714)Foreign-born:
4.3% (92)
Hispanic or Latino - Speak another language Native:
58.8% (1,052)Foreign-born:
95.7% (2,058)
Foreign-born residents in Lincolnia 7,192 residents are foreign born (11.8% Latin America , 11.7% Asia , 11.4% Africa ).
This city:
36.5%Virginia:
12.6%
Marital status for residents in Lincolnia Marital status - White (Caucasian) population 15 years and over
Males 27.2% Never married60.8% Now married2.6% Separated2.3% Widowed7.1% DivorcedFemales 31.2% Never married52.4% Now married2.6% Separated6.1% Widowed7.6% DivorcedWomen who gave birth in the past 12 months Now married:
100.0% (61)Unmarried:
0.0% (0)
Women who did not give birth in the past 12 months Now married:
53.0% (1,016)Unmarried:
47.0% (900)
Marital status - Black or African American population 15 years and over
Males 41.2% Never married36.5% Now married5.7% Separated4.3% Widowed12.4% DivorcedFemales 43.5% Never married31.1% Now married4.3% Separated2.5% Widowed18.5% DivorcedWomen who gave birth in the past 12 months Now married:
71.6% (72)Unmarried:
28.4% (29)
Women who did not give birth in the past 12 months Now married:
21.8% (279)Unmarried:
78.2% (999)
Marital status - American Indian / Alaska Native population 15 years and over
Males 0.0% Never married0.0% Now married0.0% Separated0.0% Widowed100.0% DivorcedFemales 13.6% Never married86.4% Now married0.0% Separated0.0% Widowed0.0% DivorcedWomen who did not give birth in the past 12 months Now married:
82.9% (31)Unmarried:
17.1% (6)
Marital status - Asian population 15 years and over
Males 21.0% Never married70.7% Now married3.1% Separated0.9% Widowed4.4% DivorcedFemales 22.4% Never married59.0% Now married0.0% Separated7.8% Widowed10.9% DivorcedWomen who gave birth in the past 12 months Now married:
100.0% (34)Unmarried:
0.0% (0)
Women who did not give birth in the past 12 months Now married:
53.4% (381)Unmarried:
46.6% (332)
Marital status - Other race population 15 years and over
Males 39.1% Never married50.4% Now married4.1% Separated0.0% Widowed6.4% DivorcedFemales 40.2% Never married34.6% Now married0.0% Separated0.2% Widowed25.0% DivorcedWomen who gave birth in the past 12 months Now married:
100.0% (84)Unmarried:
0.0% (0)
Women who did not give birth in the past 12 months Now married:
28.4% (71)Unmarried:
71.6% (179)
Marital status - Two or more races population 15 years and over
Males 52.6% Never married41.7% Now married4.3% Separated0.0% Widowed1.4% DivorcedFemales 40.7% Never married45.7% Now married0.0% Separated4.2% Widowed9.4% DivorcedWomen who did not give birth in the past 12 months Now married:
45.1% (245)Unmarried:
54.9% (298)
Marital status - White alone, not Hispanic / Latino population 15 years and over
Males 28.9% Never married59.5% Now married0.9% Separated1.8% Widowed8.8% DivorcedFemales 30.5% Never married51.2% Now married2.1% Separated6.9% Widowed9.3% DivorcedWomen who gave birth in the past 12 months Now married:
100.0% (48)Unmarried:
0.0% (0)
Women who did not give birth in the past 12 months Now married:
54.3% (890)Unmarried:
45.7% (748)
Marital status - Hispanic or Latino population 15 years and over
Males 32.9% Never married55.3% Now married7.7% Separated1.8% Widowed2.3% DivorcedFemales 40.3% Never married48.6% Now married2.1% Separated1.2% Widowed7.8% DivorcedWomen who gave birth in the past 12 months Now married:
100.0% (87)Unmarried:
0.0% (0)
Women who did not give birth in the past 12 months Now married:
41.9% (368)Unmarried:
58.1% (510)
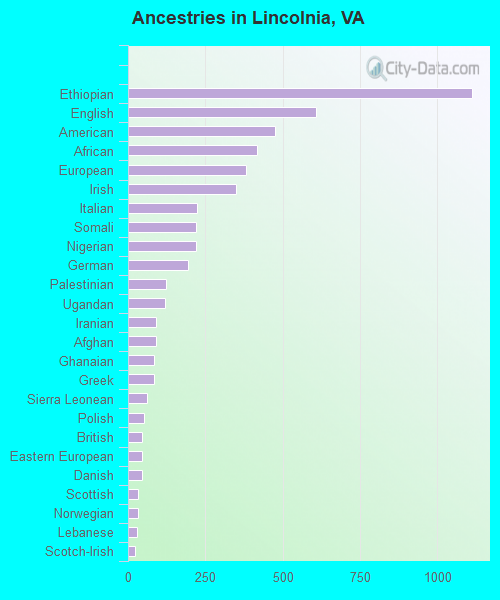
Ancestries in Lincolnia
1,112 9.2% Ethiopian609 5.1% English477 4.0% American418 3.5% African382 3.2% European348 2.9% Irish223 1.9% Italian221 1.8% Somali220 1.8% Nigerian193 1.6% German124 1.0% Palestinian120 1.0% Ugandan91 0.8% Iranian90 0.7% Afghan84 0.7% Ghanaian83 0.7% Greek63 0.5% Sierra Leonean51 0.4% Polish45 0.4% British44 0.4% Eastern European44 0.4% Danish33 0.3% Scottish31 0.3% Norwegian28 0.2% Lebanese22 0.2% Scotch-Irish22 0.2% Slavic20 0.2% Armenian19 0.2% Northern European19 0.2% Russian19 0.2% Ukrainian17 0.1% French16 0.1% Portuguese15 0.1% Jamaican14 0.1% Egyptian14 0.1% Dutch12 0.10% Lithuanian12 0.10% Swedish12 0.10% Turkish11 0.09% Romanian10 0.08% Moroccan9 0.07% Belgian6 0.05% Arab5 0.04% Sudanese4 0.03% Scandinavian4 0.03% Bulgarian4 0.03% Brazilian3 0.02% Latvian3 0.02% Welsh
Geographical mobility in Lincolnia Same house 1 year ago 6,536 86.2% White (Caucasian)4,718 89.2% Black or African American55 96.1% American Indian / Alaska Native2,382 89.6% Asian14 95.3% Native Hawaiian / Pacific Islander1,409 91.1% Other race2,394 89.0% Two or more races5,225 84.0% White alone, not Hispanic / Latino3,741 89.2% Hispanic or LatinoMoved within same county 369 4.9% White / Caucasian166 3.1% Black or African American89 3.4% Asian11 0.7% Other race39 1.4% Two or more races319 5.1% White alone, not Hispanic / Latino140 3.3% Hispanic or LatinoMoved within same state 427 5.6% White / Caucasian54 1.0% Black or African American74 2.8% Asian16 1.0% Other race124 4.6% Two or more races452 7.3% White alone, not Hispanic / Latino17 0.4% Hispanic or LatinoMoved from different state 252 3.3% White / Caucasian324 6.1% Black or African American106 6.9% Other race54 2.0% Two or more races229 3.7% White alone, not Hispanic / Latino209 5.0% Hispanic or LatinoMoved from abroad 24 0.3% White103 2.0% Black or African American137 5.1% Asian52 3.4% Other race27 0.4% White alone, not Hispanic / Latino53 1.3% Hispanic or Latino
Children Nativity (place of birth) in Lincolnia
Children under 6 years - Living with two parents Both parents native 322 100.0% NativeBoth parents foreign-born 207 85.2% Native36 14.8% Foreign-bornOne native, one foreign-born parent 191 100.0% NativeChildren under 6 years - Living with one parent Native parent 188 100.0% NativeForeign-born parent 133 100.0% NativeChildren 6 to 17 years - Living with two parents Both parents native 419 100.0% NativeBoth parents foreign-born 623 66.4% Native314 33.6% Foreign-bornOne native, one foreign-born parent 54 100.0% NativeChildren 6 to 17 years - Living with one parent Native parent 247 100.0% NativeForeign-born parent 407 55.2% Native330 44.8% Foreign-born
Grandparents responsible for own grandchildren in Lincolnia
Grandparents (30 to 59 years) White / Caucasian 44 100.0% Not responsible for grandchildrenBlack or African American 11 100.0% Not responsible for grandchildrenOther race 98 100.0% Not responsible for grandchildrenWhite alone, not Hispanic / Latino 13 100.0% Not responsible for grandchildrenHispanic or Latino 120 100.0% Not responsible for grandchildrenGrandparents (60 years and over) White / Caucasian 109 100.0% Not responsible for grandchildrenBlack or African American 79 47.0% Responsible for grandchildren89 53.0% Not responsible for grandchildrenWhite alone, not Hispanic / Latino 43 100.0% Not responsible for grandchildrenHispanic or Latino 143 100.0% Not responsible for grandchildren