Races in Longview, Texas (TX) Detailed Stats
Data:
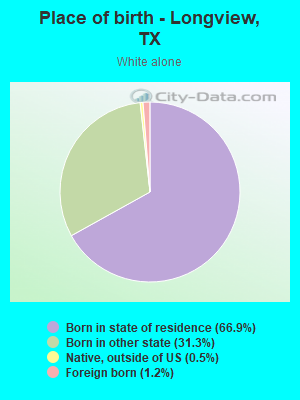
Races - White alone (%)
Races - White alone (% change since 2000)
Races - Black alone (%)
Races - Black alone (% change since 2000)
Races - American Indian alone (%)
Races - American Indian alone (% change since 2000)
Races - Asian alone (%)
Races - Asian alone (% change since 2000)
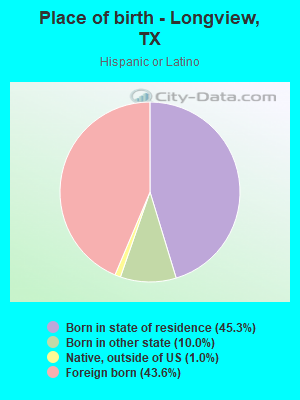
Races - Hispanic (%)
Races - Hispanic (% change since 2000)
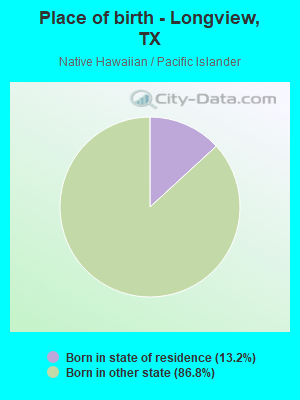
Races - Native Hawaiian and Other Pacific Islander alone (%)
Races - Native Hawaiian and Other Pacific Islander alone (% change since 2000)
Races - Two or more races(%)
Races - Two or more races(% change since 2000)
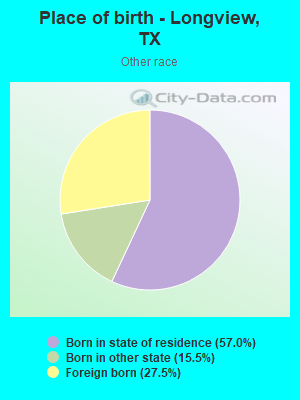
Races - Other race alone (%)
Races - Other race alone (% change since 2000)
Racial diversity
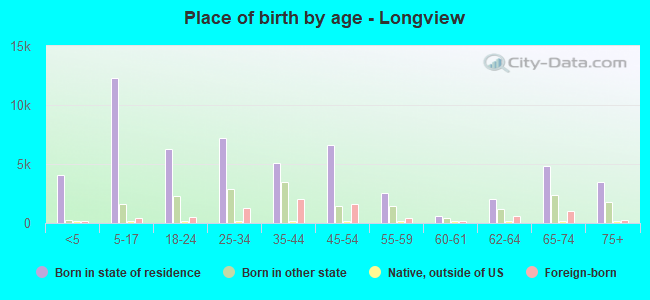
Place of birth - Born in state of residence (%)
Place of birth - Born in state of residence (%) - White
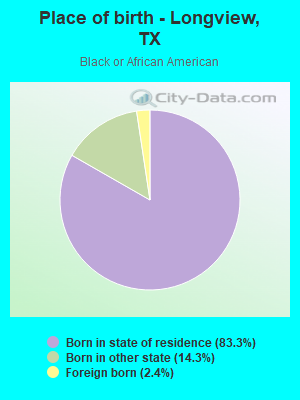
Place of birth - Born in state of residence (%) - Black or African American
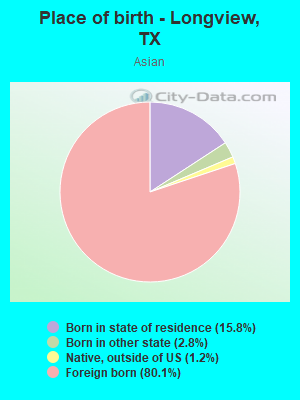
Place of birth - Born in state of residence (%) - Asian
Place of birth - Born in state of residence (%) - Hispanic or Latino
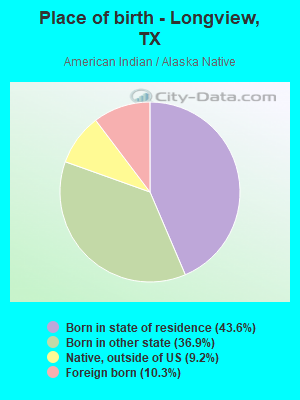
Place of birth - Born in state of residence (%) - American Indian and Alaska Native
Place of birth - Born in state of residence (%) - Multirace
Place of birth - Born in state of residence (%) - Other Race
Place of birth - Born in other state (%)
Place of birth - Born in other state (%) - White
Place of birth - Born in other state (%) - Black or African American
Place of birth - Born in other state (%) - Asian
Place of birth - Born in other state (%) - Hispanic or Latino
Place of birth - Born in other state (%) - American Indian and Alaska Native
Place of birth - Born in other state (%) - Multirace
Place of birth - Born in other state (%) - Other Race
Place of birth - Native, outside of US (%)
Place of birth - Native, outside of US (%) - White
Place of birth - Native, outside of US (%) - Black or African American
Place of birth - Native, outside of US (%) - Asian
Place of birth - Native, outside of US (%) - Hispanic or Latino
Place of birth - Native, outside of US (%) - American Indian and Alaska Native
Place of birth - Native, outside of US (%) - Multirace
Place of birth - Native, outside of US (%) - Other Race
Place of birth - Foreign born (%)
Place of birth - Foreign born (%) - White
Place of birth - Foreign born (%) - Black or African American
Place of birth - Foreign born (%) - Asian
Place of birth - Foreign born (%) - Hispanic or Latino
Place of birth - Foreign born (%) - American Indian and Alaska Native
Place of birth - Foreign born (%) - Multirace
Place of birth - Foreign born (%) - Other Race
Residents speaking English at home (%)
Residents speaking English at home - Born in the United States (%)
Residents speaking English at home - Native, born elsewhere (%)
Residents speaking English at home - Foreign born (%)
Residents speaking Spanish at home (%)
Residents speaking Spanish at home - Born in the United States (%)
Residents speaking Spanish at home - Native, born elsewhere (%)
Residents speaking Spanish at home - Foreign born (%)
Residents speaking other language at home (%)
Residents speaking other language at home - Born in the United States (%)
Residents speaking other language at home - Native, born elsewhere (%)
Residents speaking other language at home - Foreign born (%)
Marital status - Never married (%)
Marital status - Now married (%)
Marital status - Separated (%)
Marital status - Widowed (%)
Marital status - Divorced (%)
Ancestries Reported - Arab (%)
Ancestries Reported - Czech (%)
Ancestries Reported - Danish (%)
Ancestries Reported - Dutch (%)
Ancestries Reported - English (%)
Ancestries Reported - French (%)
Ancestries Reported - French Canadian (%)
Ancestries Reported - German (%)
Ancestries Reported - Greek (%)
Ancestries Reported - Hungarian (%)
Ancestries Reported - Irish (%)
Ancestries Reported - Italian (%)
Ancestries Reported - Lithuanian (%)
Ancestries Reported - Norwegian (%)
Ancestries Reported - Polish (%)
Ancestries Reported - Portuguese (%)
Ancestries Reported - Russian (%)
Ancestries Reported - Scotch-Irish (%)
Ancestries Reported - Scottish (%)
Ancestries Reported - Slovak (%)
Ancestries Reported - Subsaharan African (%)
Ancestries Reported - Swedish (%)
Ancestries Reported - Swiss (%)
Ancestries Reported - Ukrainian (%)
Ancestries Reported - United States (%)
Ancestries Reported - Welsh (%)
Ancestries Reported - West Indian (%)
Ancestries Reported - Other (%)
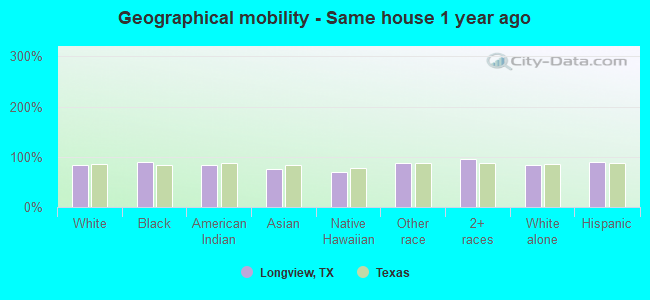
Geographical mobility - Same house 1 year ago (%)
Geographical mobility - Same house 1 year ago (%) - White
Geographical mobility - Same house 1 year ago (%) - Black or African American
Geographical mobility - Same house 1 year ago (%) - Asian
Geographical mobility - Same house 1 year ago (%) - Hispanic or Latino
Geographical mobility - Same house 1 year ago (%) - American Indian and Alaska Native
Geographical mobility - Same house 1 year ago (%) - Multirace
Geographical mobility - Same house 1 year ago (%) - Other Race
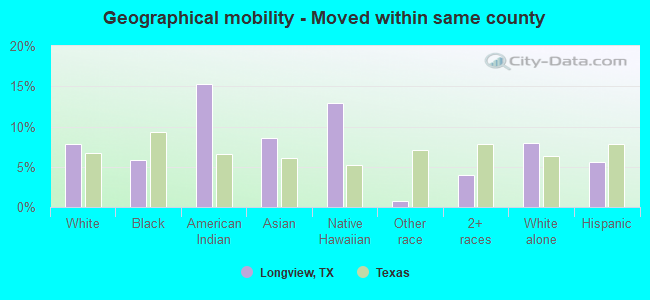
Geographical mobility - Moved within same county (%)
Geographical mobility - Moved within same county (%) - White
Geographical mobility - Moved within same county (%) - Black or African American
Geographical mobility - Moved within same county (%) - Asian
Geographical mobility - Moved within same county (%) - Hispanic or Latino
Geographical mobility - Moved within same county (%) - American Indian and Alaska Native
Geographical mobility - Moved within same county (%) - Multirace
Geographical mobility - Moved within same county (%) - Other Race
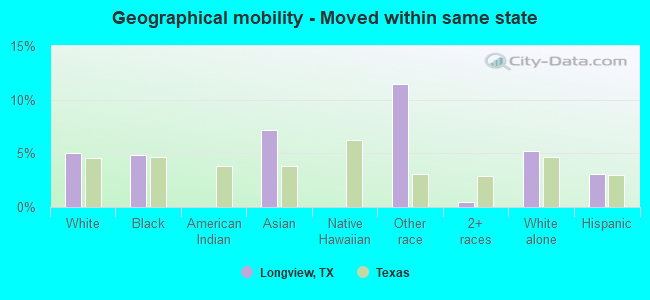
Geographical mobility - Moved from different county within same state (%)
Geographical mobility - Moved from different county within same state (%) - White
Geographical mobility - Moved from different county within same state (%) - Black or African American
Geographical mobility - Moved from different county within same state (%) - Asian
Geographical mobility - Moved from different county within same state (%) - Hispanic or Latino
Geographical mobility - Moved from different county within same state (%) - American Indian and Alaska Native
Geographical mobility - Moved from different county within same state (%) - Multirace
Geographical mobility - Moved from different county within same state (%) - Other Race
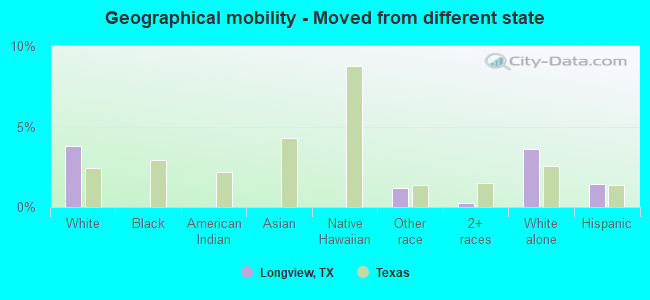
Geographical mobility - Moved from different state (%)
Geographical mobility - Moved from different state (%) - White
Geographical mobility - Moved from different state (%) - Black or African American
Geographical mobility - Moved from different state (%) - Asian
Geographical mobility - Moved from different state (%) - Hispanic or Latino
Geographical mobility - Moved from different state (%) - American Indian and Alaska Native
Geographical mobility - Moved from different state (%) - Multirace
Geographical mobility - Moved from different state (%) - Other Race
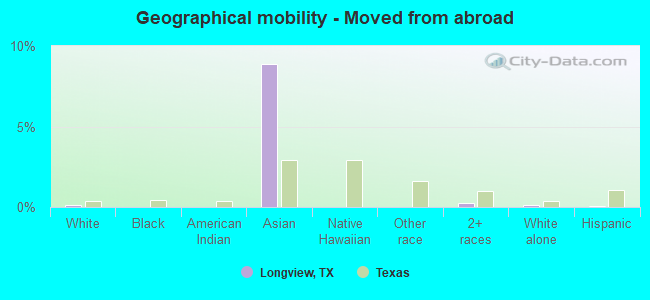
Geographical mobility - Moved from abroad (%)
Geographical mobility - Moved from abroad (%) - White
Geographical mobility - Moved from abroad (%) - Black or African American
Geographical mobility - Moved from abroad (%) - Asian
Geographical mobility - Moved from abroad (%) - Hispanic or Latino
Geographical mobility - Moved from abroad (%) - American Indian and Alaska Native
Geographical mobility - Moved from abroad (%) - Multirace
Geographical mobility - Moved from abroad (%) - Other Race
Place of birth for the foreign-born population - Ireland (%)
Place of birth for the foreign-born population - Denmark (%)
Place of birth for the foreign-born population - Norway (%)
Place of birth for the foreign-born population - Sweden (%)
Place of birth for the foreign-born population - United Kingdom (%)
Place of birth for the foreign-born population - England (%)
Place of birth for the foreign-born population - Scotland (%)
Place of birth for the foreign-born population - Other Northern Europe (%)
Place of birth for the foreign-born population - Austria (%)
Place of birth for the foreign-born population - Belgium (%)
Place of birth for the foreign-born population - France (%)
Place of birth for the foreign-born population - Germany (%)
Place of birth for the foreign-born population - Netherlands (%)
Place of birth for the foreign-born population - Switzerland (%)
Place of birth for the foreign-born population - Other Western Europe (%)
Place of birth for the foreign-born population - Greece (%)
Place of birth for the foreign-born population - Italy (%)
Place of birth for the foreign-born population - Portugal (%)
Place of birth for the foreign-born population - Spain (%)
Place of birth for the foreign-born population - Other Southern Europe (%)
Place of birth for the foreign-born population - Albania (%)
Place of birth for the foreign-born population - Belarus (%)
Place of birth for the foreign-born population - Bosnia and Herzegovina (%)
Place of birth for the foreign-born population - Bulgaria (%)
Place of birth for the foreign-born population - Croatia (%)
Place of birth for the foreign-born population - Czechoslovakia (%)
Place of birth for the foreign-born population - Hungary (%)
Place of birth for the foreign-born population - Latvia (%)
Place of birth for the foreign-born population - Lithuania (%)
Place of birth for the foreign-born population - North Macedonia (Macedonia) (%)
Place of birth for the foreign-born population - Moldova (%)
Place of birth for the foreign-born population - Poland (%)
Place of birth for the foreign-born population - Romania (%)
Place of birth for the foreign-born population - Russia (%)
Place of birth for the foreign-born population - Serbia (%)
Place of birth for the foreign-born population - Ukraine (%)
Place of birth for the foreign-born population - Other Eastern Europe (%)
Place of birth for the foreign-born population - China (%)
Place of birth for the foreign-born population - Hong Kong (%)
Place of birth for the foreign-born population - Taiwan (%)
Place of birth for the foreign-born population - Japan (%)
Place of birth for the foreign-born population - Korea (%)
Place of birth for the foreign-born population - Other Eastern Asia (%)
Place of birth for the foreign-born population - Afghanistan (%)
Place of birth for the foreign-born population - Bangladesh (%)
Place of birth for the foreign-born population - India (%)
Place of birth for the foreign-born population - Iran (%)
Place of birth for the foreign-born population - Kazakhstan (%)
Place of birth for the foreign-born population - Nepal (%)
Place of birth for the foreign-born population - Pakistan (%)
Place of birth for the foreign-born population - Sri Lanka (%)
Place of birth for the foreign-born population - Uzbekistan (%)
Place of birth for the foreign-born population - Other South Central Asia (%)
Place of birth for the foreign-born population - Burma (%)
Place of birth for the foreign-born population - Cambodia (%)
Place of birth for the foreign-born population - Indonesia (%)
Place of birth for the foreign-born population - Laos (%)
Place of birth for the foreign-born population - Malaysia (%)
Place of birth for the foreign-born population - Philippines (%)
Place of birth for the foreign-born population - Singapore (%)
Place of birth for the foreign-born population - Thailand (%)
Place of birth for the foreign-born population - Vietnam (%)
Place of birth for the foreign-born population - Other South Eastern Asia (%)
Place of birth for the foreign-born population - Armenia (%)
Place of birth for the foreign-born population - Iraq (%)
Place of birth for the foreign-born population - Israel (%)
Place of birth for the foreign-born population - Jordan (%)
Place of birth for the foreign-born population - Kuwait (%)
Place of birth for the foreign-born population - Lebanon (%)
Place of birth for the foreign-born population - Saudi Arabia (%)
Place of birth for the foreign-born population - Syria (%)
Place of birth for the foreign-born population - Turkey (%)
Place of birth for the foreign-born population - Yemen (%)
Place of birth for the foreign-born population - Other Western Asia (%)
Place of birth for the foreign-born population - Eritrea (%)
Place of birth for the foreign-born population - Ethiopia (%)
Place of birth for the foreign-born population - Kenya (%)
Place of birth for the foreign-born population - Somalia (%)
Place of birth for the foreign-born population - Uganda (%)
Place of birth for the foreign-born population - Zimbabwe (%)
Place of birth for the foreign-born population - Other Eastern Africa (%)
Place of birth for the foreign-born population - Cameroon (%)
Place of birth for the foreign-born population - Congo (%)
Place of birth for the foreign-born population - Democratic Republic of Congo (Zaire) (%)
Place of birth for the foreign-born population - Other Middle Africa (%)
Place of birth for the foreign-born population - Egypt (%)
Place of birth for the foreign-born population - Morocco (%)
Place of birth for the foreign-born population - Sudan (%)
Place of birth for the foreign-born population - Other Northern Africa (%)
Place of birth for the foreign-born population - South Africa (%)
Place of birth for the foreign-born population - Other Southern Africa (%)
Place of birth for the foreign-born population - Cabo Verde (%)
Place of birth for the foreign-born population - Ghana (%)
Place of birth for the foreign-born population - Liberia (%)
Place of birth for the foreign-born population - Nigeria (%)
Place of birth for the foreign-born population - Senegal (%)
Place of birth for the foreign-born population - Sierra Leone (%)
Place of birth for the foreign-born population - Other Western Africa (%)
Place of birth for the foreign-born population - Australia (%)
Place of birth for the foreign-born population - New Zealand (%)
Place of birth for the foreign-born population - Fiji (%)
Place of birth for the foreign-born population - Micronesia (%)
Place of birth for the foreign-born population - Bahamas (%)
Place of birth for the foreign-born population - Barbados (%)
Place of birth for the foreign-born population - Cuba (%)
Place of birth for the foreign-born population - Dominica (%)
Place of birth for the foreign-born population - Dominican Republic (%)
Place of birth for the foreign-born population - Grenada (%)
Place of birth for the foreign-born population - Haiti (%)
Place of birth for the foreign-born population - Jamaica (%)
Place of birth for the foreign-born population - St. Vincent and the Grenadines (%)
Place of birth for the foreign-born population - Trinidad and Tobago (%)
Place of birth for the foreign-born population - West Indies (%)
Place of birth for the foreign-born population - Other Caribbean (%)
Place of birth for the foreign-born population - Belize (%)
Place of birth for the foreign-born population - Costa Rica (%)
Place of birth for the foreign-born population - El Salvador (%)
Place of birth for the foreign-born population - Guatemala (%)
Place of birth for the foreign-born population - Honduras (%)
Place of birth for the foreign-born population - Mexico (%)
Place of birth for the foreign-born population - Nicaragua (%)
Place of birth for the foreign-born population - Panama (%)
Place of birth for the foreign-born population - Other Central America (%)
Place of birth for the foreign-born population - Argentina (%)
Place of birth for the foreign-born population - Bolivia (%)
Place of birth for the foreign-born population - Brazil (%)
Place of birth for the foreign-born population - Chile (%)
Place of birth for the foreign-born population - Colombia (%)
Place of birth for the foreign-born population - Ecuador (%)
Place of birth for the foreign-born population - Guyana (%)
Place of birth for the foreign-born population - Peru (%)
Place of birth for the foreign-born population - Uruguay (%)
Place of birth for the foreign-born population - Venezuela (%)
Place of birth for the foreign-born population - Other South America (%)
Place of birth for the foreign-born population - Canada (%)
Place of birth for the foreign-born population - Other Northern America (%)
Place of birth for the foreign-born population - Other (%)
Latest news about races in Longview, TX collected exclusively by city-data.com from local newspapers, TV, and radio stations
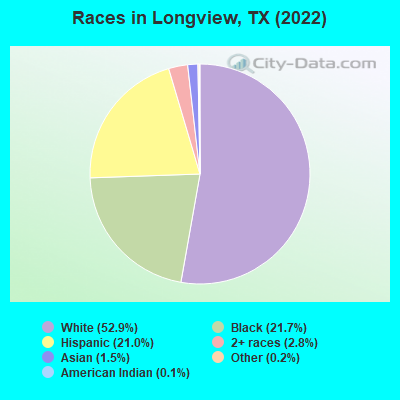
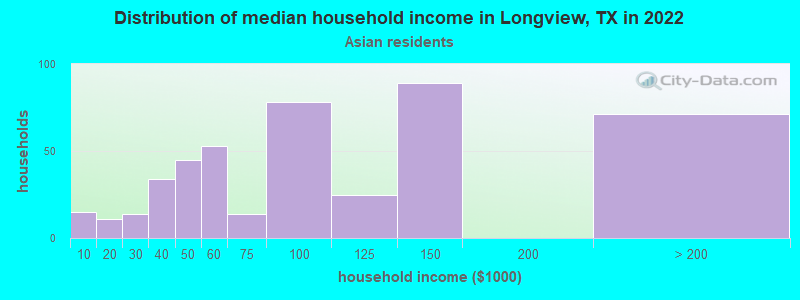
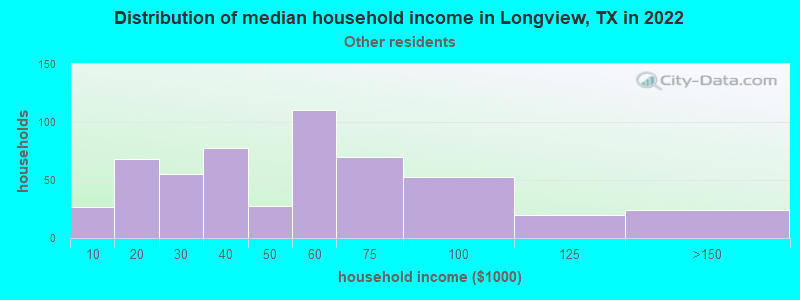
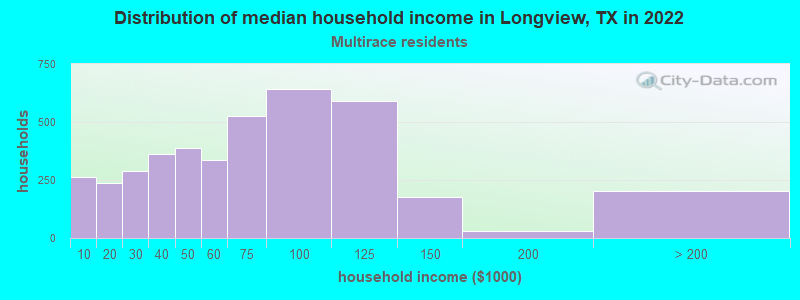
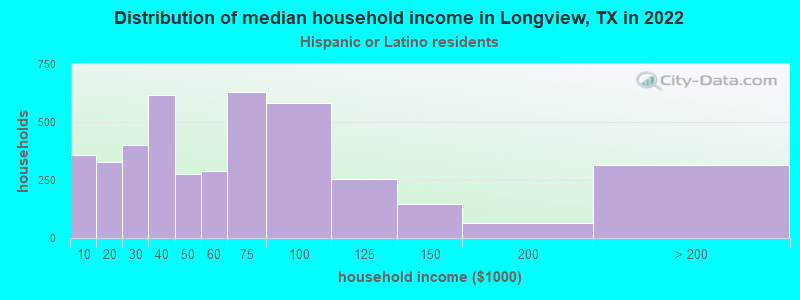
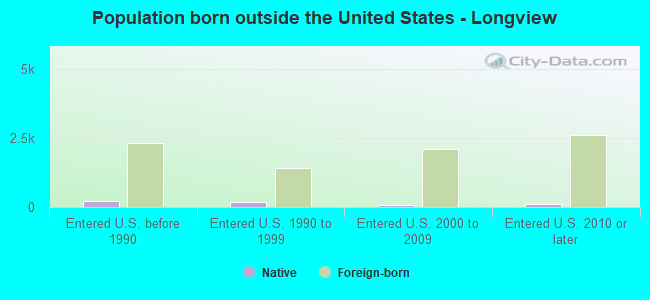
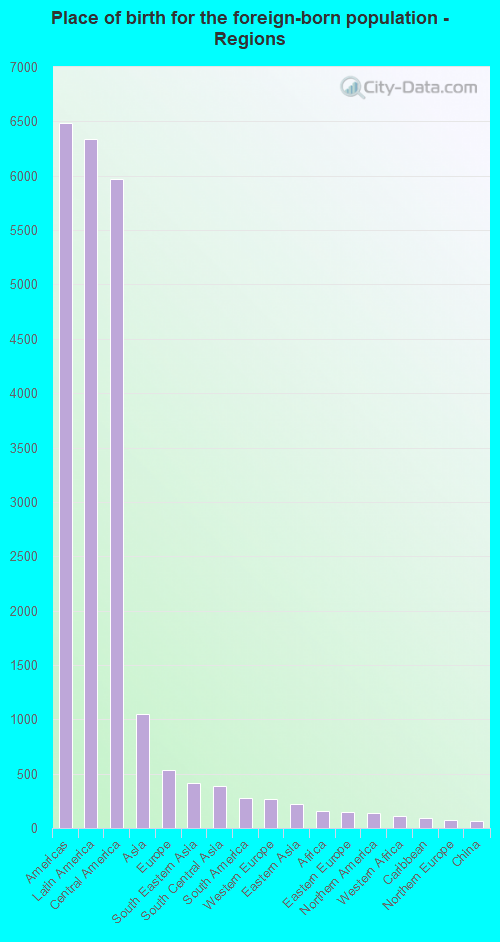
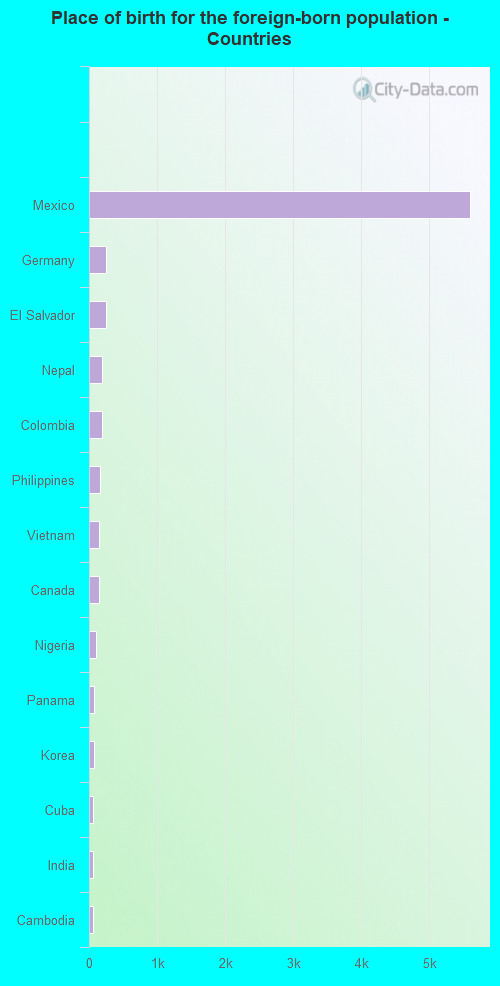
According to 2022 data, the most numerous races in Longview, TX are Hispanic (17,448 residents), White alone (43,876 residents), and Black alone (18,015 residents). 82.4% of Longview residents speak English at home. 9.9% of Longview, TX residents are foreign-born (7.4% born in Latin America, 1.2% born in Asia), which is 71.4% less than the foreign-born rate of 17.0% across the entire state of Texas.
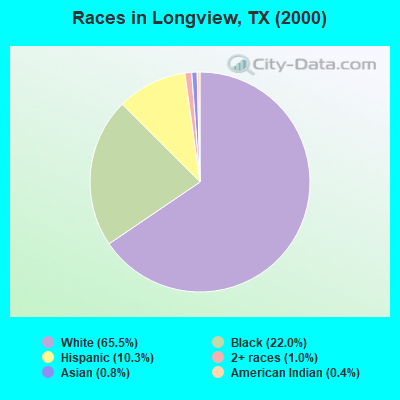
Race distribution in Longview
2000 2022
10,933,313 52.4% White alone 6,669,666 32.0% Hispanic 2,364,255 11.3% Black alone 554,445 2.7% Asian alone 230,567 1.1% Two or more races 68,859 0.3% American Indian alone 19,958 0.10% Other race alone 10,757 0.05% Native Hawaiian and Other
12,070,642 40.2% Hispanic 11,683,430 38.9% White alone 3,508,706 11.7% Black alone 1,608,173 5.4% Asian alone 956,560 3.2% Two or more races 125,763 0.4% Other race alone 47,023 0.2% American Indian alone 29,275 0.10% Native Hawaiian and Other
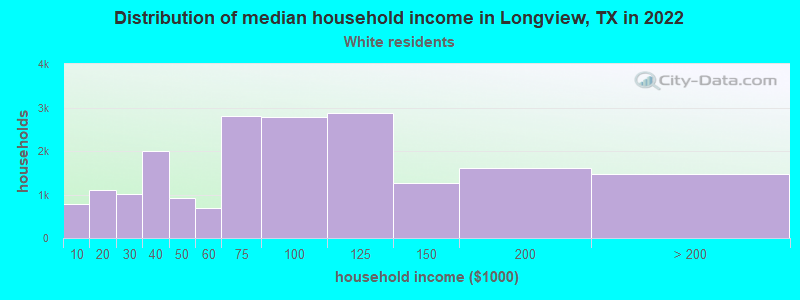
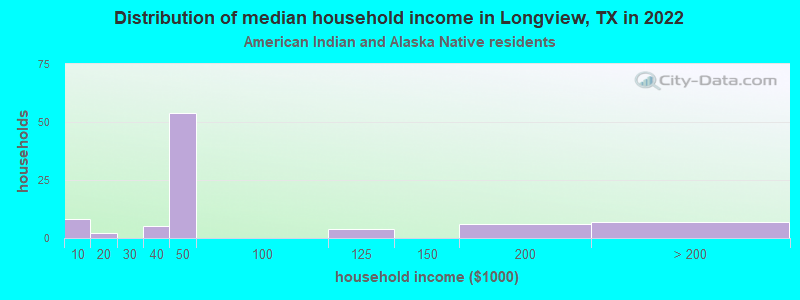
Income and house value in Longview Median household income in 2022 $76,119 White non-Hispanic householders$44,433 Black householders$46,026 Asian householders$57,616 Some other race householders$64,955 Two or more races householders$59,798 Hispanic or Latino race householdersMedian 2022 house value $237,578 White Non-Hispanic householders$117,523 Black or African American householders$57,074 American Indian or Alaska Native householders $220,427 Asian householders$107,120 Some other race householders$205,244 Two or more races householders$127,364 Hispanic or Latino householders
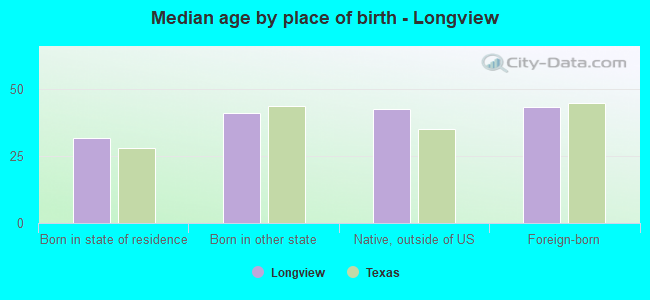
Median age by race in Longview
40.7 Median age for White residents38.9 44.4 32.0 Median age for Black or African American residents28.9 33.6 45.6 Median age for American Indian / Alaska Native residents-666,666,666.0 50.8 41.9 Median age for Asian residents46.5 41.8 -666,666,666.0 Median age for Native Hawaiian / Pacific Islander residents-666,666,666.0 -666,666,666.0 32.4 Median age for Other race residents44.1 25.6 30.9 Median age for Two or more races residents30.7 31.2 40.8 Median age for White alone residents38.9 44.4 31.5 Median age for Hispanic or Latino residents32.9 29.2
Owner/renter occupied households by race in Longview
House owners and renters - White residents 11,178 57.9% Owner occupied8,142 42.1% Renter occupiedHouse owners and renters - Black or African American residents 3,246 33.9% Owner occupied6,339 66.1% Renter occupiedHouse owners and renters - American Indian / Alaska Native residents 15 20.5% Owner occupied57 79.5% Renter occupiedHouse owners and renters - Asian residents 303 63.2% Owner occupied176 36.8% Renter occupiedHouse owners and renters - Native Hawaiian / Pacific Islander residents 10 100.0% Renter occupiedHouse owners and renters - Other race residents 282 72.0% Owner occupied110 28.0% Renter occupiedHouse owners and renters - Two or more races residents 2,172 63.5% Owner occupied1,247 36.5% Renter occupiedHouse owners and renters - White alone residents 11,013 57.7% Owner occupied8,085 42.3% Renter occupiedHouse owners and renters - Hispanic or Latino residents 2,324 63.4% Owner occupied1,342 36.6% Renter occupied
Language usage in Longview
English speakers - Total 82.4% of residents of Longview speak English at home.
14.1% of residents speak Spanish at home 6,486 58.3% Speak English very well4,631 41.7% Speak English less than very well3.5% of residents speak other language at home 2,103 76.6% Speak English very well641 23.4% Speak English less than very well
English speakers - Born in the United States 91.2% of residents of Longview speak English at home.
5.0% of residents speak Spanish at home 799 84.9% Speak English very well142 15.1% Speak English less than very well3.9% of residents speak other language at home 733 100.0% Speak English very well
English speakers - Native, born elsewhere 78.7% of residents of Longview speak English at home.
21.3% of residents speak Spanish at home 118 100.0% Speak English very well
English speakers - Foreign-born 9.3% of residents of Longview speak English at home.
71.7% of residents speak Spanish at home 1,881 31.2% Speak English very well4,146 68.8% Speak English less than very well19.0% of residents speak other language at home 1,131 70.8% Speak English very well467 29.2% Speak English less than very well
White (Caucasian) - Speak only English Native:
96.3% (40,979)Foreign-born:
27.3% (204)
White (Caucasian) - Speak another language Native:
3.7% (1,592)Foreign-born:
72.7% (543)
Black or African American - Speak only English Native:
98.6% (16,925)Foreign-born:
70.3% (104)
Black or African American - Speak another language Native:
1.4% (237)Foreign-born:
23.6% (35)
American Indian / Alaska Native - Speak another language Native:
76.7% (167)Foreign-born:
98.9% (25)
Asian - Speak only English Native:
49.0% (107)Foreign-born:
26.1% (243)
Asian - Speak another language Native:
51.0% (111)Foreign-born:
74.4% (695)
Other race - Speak another language Native:
61.0% (548)Foreign-born:
100.0% (363)
Two or more races - Speak only English Native:
58.7% (4,060)Foreign-born:
2.9% (161)
Two or more races - Speak another language Native:
41.3% (2,855)Foreign-born:
97.1% (5,470)
White alone - Speak only English Native:
97.0% (40,596)Foreign-born:
37.5% (204)
White alone - Speak another language Native:
3.0% (1,240)Foreign-born:
62.5% (340)
Hispanic or Latino - Speak only English Native:
33.5% (2,376)Foreign-born:
2.6% (161)
Hispanic or Latino - Speak another language Native:
66.5% (4,719)Foreign-born:
97.4% (6,027)
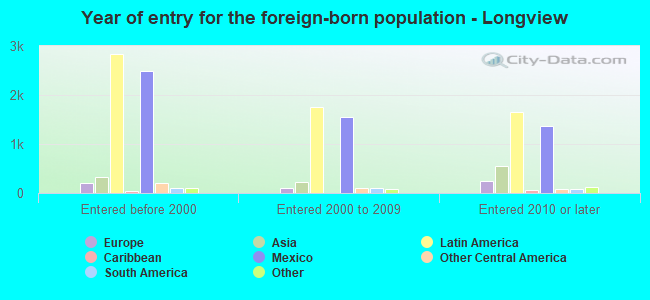
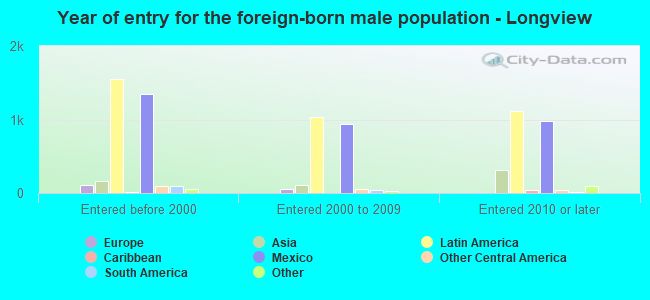
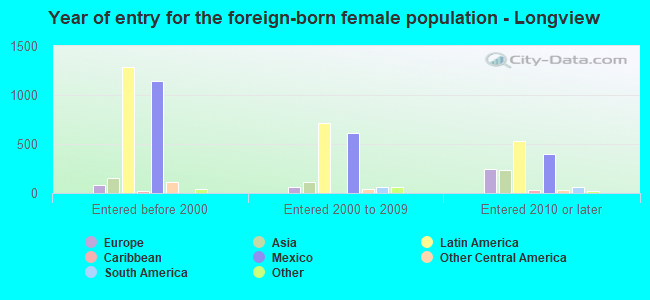
Foreign-born residents in Longview 8,230 residents are foreign born (7.4% Latin America , 1.2% Asia ).
This city:
9.9%Texas:
17.1%
Marital status for residents in Longview Marital status - White (Caucasian) population 15 years and over
Males 33.4% Never married50.2% Now married1.9% Separated4.5% Widowed9.9% DivorcedFemales 21.3% Never married44.8% Now married2.6% Separated12.7% Widowed18.7% DivorcedWomen who gave birth in the past 12 months Now married:
100.0% (251)Unmarried:
0.0% (0)
Women who did not give birth in the past 12 months Now married:
45.7% (4,554)Unmarried:
54.3% (5,418)
Marital status - Black or African American population 15 years and over
Males 43.4% Never married38.2% Now married2.5% Separated0.3% Widowed15.5% DivorcedFemales 47.9% Never married30.4% Now married0.3% Separated10.2% Widowed11.2% DivorcedWomen who gave birth in the past 12 months Now married:
14.9% (13)Unmarried:
85.1% (75)
Women who did not give birth in the past 12 months Now married:
32.2% (1,596)Unmarried:
67.8% (3,359)
Marital status - American Indian / Alaska Native population 15 years and over
Males 77.4% Never married8.1% Now married0.0% Separated0.0% Widowed14.5% DivorcedFemales 19.2% Never married80.8% Now married0.0% Separated0.0% Widowed0.0% DivorcedWomen who gave birth in the past 12 months Now married:
0.0% (0)Unmarried:
100.0% (10)
Women who did not give birth in the past 12 months Now married:
85.1% (57)Unmarried:
14.9% (10)
Marital status - Asian population 15 years and over
Males 45.4% Never married44.3% Now married2.3% Separated2.8% Widowed5.3% DivorcedFemales 18.6% Never married71.2% Now married0.0% Separated2.8% Widowed7.5% DivorcedWomen who gave birth in the past 12 months Now married:
100.0% (23)Unmarried:
0.0% (0)
Women who did not give birth in the past 12 months Now married:
66.1% (218)Unmarried:
33.9% (112)
Marital status - Native Hawaiian / Pacific Islander population 15 years and over
Males 0.0% Never married100.0% Now married0.0% Separated0.0% Widowed0.0% DivorcedFemales 50.0% Never married50.0% Now married0.0% Separated0.0% Widowed0.0% DivorcedWomen who did not give birth in the past 12 months Now married:
50.0% (10)Unmarried:
50.0% (10)
Marital status - Other race population 15 years and over
Males 44.2% Never married53.1% Now married1.2% Separated1.5% Widowed0.0% DivorcedFemales 39.5% Never married42.1% Now married5.3% Separated3.8% Widowed9.3% DivorcedWomen who gave birth in the past 12 months Now married:
58.1% (25)Unmarried:
41.9% (18)
Women who did not give birth in the past 12 months Now married:
48.4% (363)Unmarried:
51.6% (386)
Marital status - Two or more races population 15 years and over
Males 39.2% Never married55.1% Now married0.2% Separated0.3% Widowed5.1% DivorcedFemales 41.5% Never married44.0% Now married1.6% Separated3.4% Widowed9.6% DivorcedWomen who gave birth in the past 12 months Now married:
13.5% (29)Unmarried:
86.5% (187)
Women who did not give birth in the past 12 months Now married:
36.6% (1,392)Unmarried:
63.4% (2,409)
Marital status - White alone, not Hispanic / Latino population 15 years and over
Males 32.6% Never married50.4% Now married2.0% Separated4.7% Widowed10.3% DivorcedFemales 21.1% Never married44.9% Now married2.6% Separated12.8% Widowed18.5% DivorcedWomen who gave birth in the past 12 months Now married:
100.0% (251)Unmarried:
0.0% (0)
Women who did not give birth in the past 12 months Now married:
45.4% (4,450)Unmarried:
54.6% (5,362)
Marital status - Hispanic or Latino population 15 years and over
Males 30.3% Never married65.2% Now married0.0% Separated0.3% Widowed4.2% DivorcedFemales 46.0% Never married40.9% Now married3.8% Separated4.1% Widowed5.2% DivorcedWomen who gave birth in the past 12 months Now married:
28.6% (58)Unmarried:
71.4% (146)
Women who did not give birth in the past 12 months Now married:
42.9% (1,908)Unmarried:
57.1% (2,543)
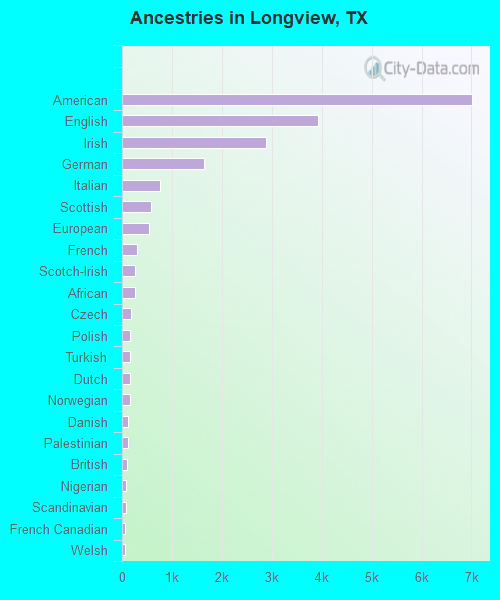
Ancestries in Longview
7,001 13.3% American3,931 7.5% English2,891 5.5% Irish1,647 3.1% German766 1.5% Italian571 1.1% Scottish537 1.0% European291 0.6% French256 0.5% Scotch-Irish253 0.5% African189 0.4% Czech170 0.3% Polish169 0.3% Turkish166 0.3% Dutch161 0.3% Norwegian117 0.2% Danish111 0.2% Palestinian91 0.2% British87 0.2% Nigerian82 0.2% Scandinavian70 0.1% French Canadian67 0.1% Welsh52 0.10% Swedish35 0.07% Lebanese34 0.06% Armenian29 0.06% Eastern European26 0.05% Iranian26 0.05% Slovak26 0.05% Kenyan22 0.04% Lithuanian22 0.04% Serbian22 0.04% Brazilian21 0.04% Russian20 0.04% Greek16 0.03% Croatian13 0.02% Canadian12 0.02% Northern European11 0.02% Hungarian11 0.02% Jamaican10 0.02% Ukrainian9 0.02% Luxembourger6 0.01% Romanian5 0.01% Albanian
Geographical mobility in Longview Same house 1 year ago 37,534 83.2% White (Caucasian)18,875 89.3% Black or African American221 83.3% American Indian / Alaska Native870 75.4% Asian49 69.6% Native Hawaiian / Pacific Islander1,887 86.6% Other race12,379 95.1% Two or more races36,666 83.2% White alone, not Hispanic / Latino15,199 89.8% Hispanic or LatinoMoved within same county 3,541 7.8% White / Caucasian1,221 5.8% Black or African American40 15.3% American Indian / Alaska Native98 8.5% Asian9 12.9% Native Hawaiian / Pacific Islander16 0.7% Other race517 4.0% Two or more races3,497 7.9% White alone, not Hispanic / Latino942 5.6% Hispanic or LatinoMoved within same state 2,283 5.1% White / Caucasian1,030 4.9% Black or African American82 7.2% Asian249 11.4% Other race62 0.5% Two or more races2,283 5.2% White alone, not Hispanic / Latino522 3.1% Hispanic or LatinoMoved from different state 1,719 3.8% White / Caucasian26 1.2% Other race33 0.3% Two or more races1,584 3.6% White alone, not Hispanic / Latino242 1.4% Hispanic or LatinoMoved from abroad 50 0.1% White102 8.9% Asian29 0.2% Two or more races50 0.1% White alone, not Hispanic / Latino11 0.1% Hispanic or Latino
Children Nativity (place of birth) in Longview
Children under 6 years - Living with two parents Both parents native 1,964 100.0% NativeBoth parents foreign-born 296 100.0% NativeOne native, one foreign-born parent 555 100.0% NativeChildren under 6 years - Living with one parent Native parent 2,481 100.0% NativeForeign-born parent 642 89.2% Native78 10.8% Foreign-bornChildren 6 to 17 years - Living with two parents Both parents native 5,590 100.0% NativeBoth parents foreign-born 613 60.4% Native402 39.6% Foreign-bornOne native, one foreign-born parent 779 100.0% NativeChildren 6 to 17 years - Living with one parent Native parent 3,316 100.0% NativeForeign-born parent 2,056 52.1% Native1,891 47.9% Foreign-born
Grandparents responsible for own grandchildren in Longview
Grandparents (30 to 59 years) White / Caucasian 306 39.1% Responsible for grandchildren476 60.9% Not responsible for grandchildrenBlack or African American 156 78.4% Responsible for grandchildren43 21.6% Not responsible for grandchildrenOther race 28 100.0% Not responsible for grandchildrenTwo or more races 232 92.7% Responsible for grandchildren18 7.3% Not responsible for grandchildrenWhite alone, not Hispanic / Latino 194 30.0% Responsible for grandchildren453 70.0% Not responsible for grandchildrenHispanic or Latino 243 79.5% Responsible for grandchildren62 20.5% Not responsible for grandchildrenGrandparents (60 years and over) White / Caucasian 253 38.5% Responsible for grandchildren404 61.5% Not responsible for grandchildrenBlack or African American 107 68.7% Responsible for grandchildren49 31.3% Not responsible for grandchildrenOther race 30 100.0% Not responsible for grandchildrenTwo or more races 25 100.0% Not responsible for grandchildrenWhite alone, not Hispanic / Latino 159 54.2% Responsible for grandchildren134 45.8% Not responsible for grandchildrenHispanic or Latino 113 43.6% Responsible for grandchildren146 56.4% Not responsible for grandchildren