Races in Loon Lake, Washington (WA) Detailed Stats
Ancestries, Foreign-born residents, place of birth

Data:
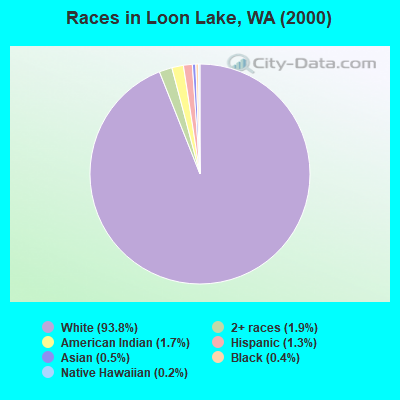
Race distribution in Loon Lake

- 8,02393.8%White alone
- 1651.9%Two or more races
- 1461.7%American Indian alone
- 1141.3%Hispanic
- 460.5%Asian alone
- 380.4%Black alone
- 210.2%Native Hawaiian and Other
Pacific Islander alone
- 10.01%Other race alone
2000
2022
-
- 4,652,49078.9%White alone
- 441,5097.5%Hispanic
- 319,4015.4%Asian alone
- 184,6313.1%Black alone
- 175,9263.0%Two or more races
- 85,3961.4%American Indian alone
- 22,7790.4%Native Hawaiian and Other
Pacific Islander alone
- 11,9890.2%Other race alone
-
- 4,941,45663.5%White alone
- 1,093,31314.0%Hispanic
- 755,8329.7%Asian alone
- 523,4486.7%Two or more races
- 299,5373.8%Black alone
- 69,0240.9%American Indian alone
- 52,2310.7%Native Hawaiian and Other
Pacific Islander alone
- 50,9450.7%Other race alone
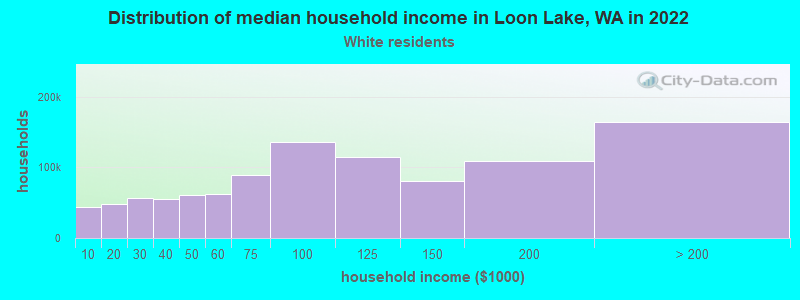
Income and house value in Loon Lake
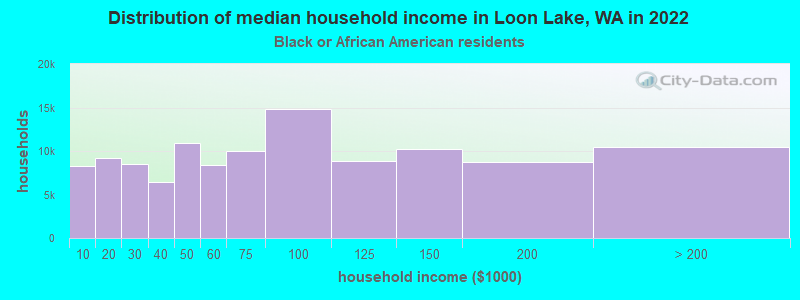
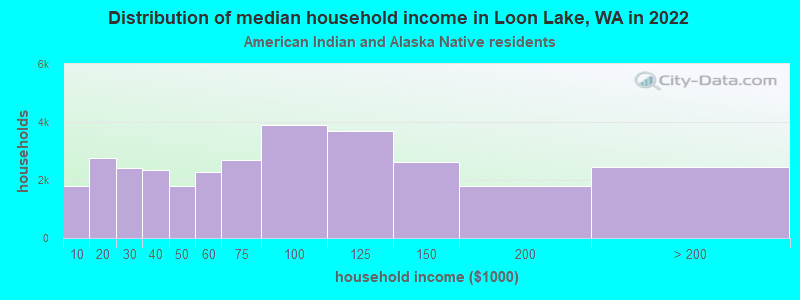
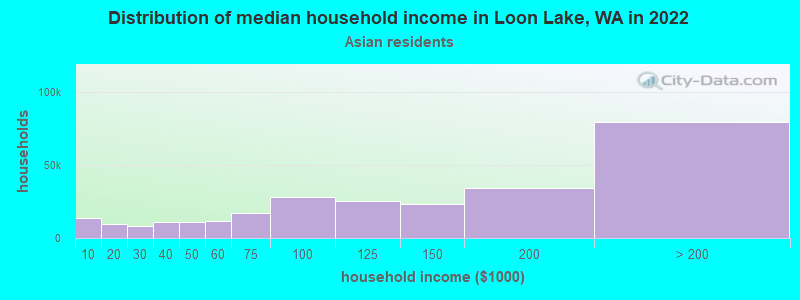
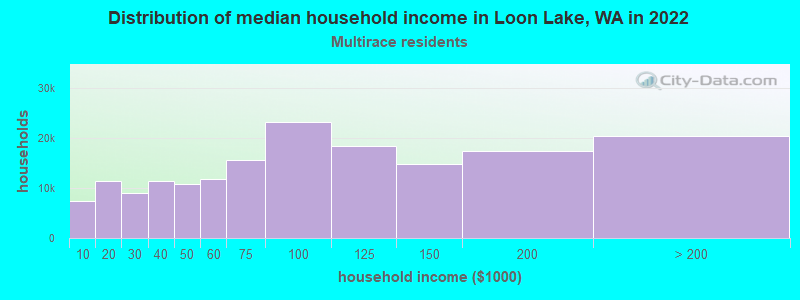
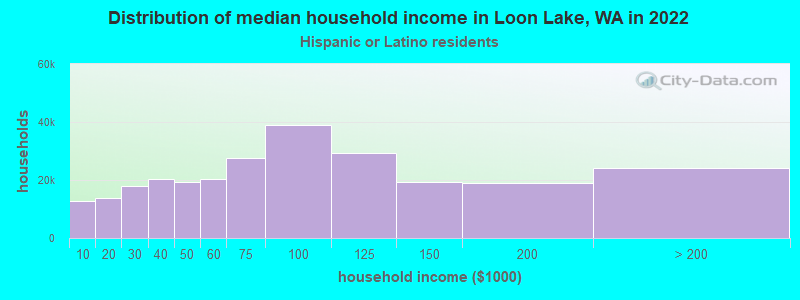
- Median household income in 2022
- $82,219White non-Hispanic householders
- $51,947Black householders
- $132,680American Indian and Alaska Native householders
- $185,409Asian householders
- $143,385Some other race householders
- $106,164Two or more races householders
- $131,481Hispanic or Latino race householders
- Median 2022 house value
- $436,021White Non-Hispanic householders
- $274,795Black or African American householders
- $397,029American Indian or Alaska Native householders
- $451,184Two or more races householders
- $444,995Hispanic or Latino householders