Races in Manvel, Texas (TX) Detailed Stats
Data:
Races - White alone (%)
Races - White alone (% change since 2000)
Races - Black alone (%)
Races - Black alone (% change since 2000)
Races - American Indian alone (%)
Races - American Indian alone (% change since 2000)
Races - Asian alone (%)
Races - Asian alone (% change since 2000)
Races - Hispanic (%)
Races - Hispanic (% change since 2000)
Races - Native Hawaiian and Other Pacific Islander alone (%)
Races - Native Hawaiian and Other Pacific Islander alone (% change since 2000)
Races - Two or more races(%)
Races - Two or more races(% change since 2000)
Races - Other race alone (%)
Races - Other race alone (% change since 2000)
Racial diversity
Place of birth - Born in state of residence (%)
Place of birth - Born in state of residence (%) - White
Place of birth - Born in state of residence (%) - Black or African American
Place of birth - Born in state of residence (%) - Asian
Place of birth - Born in state of residence (%) - Hispanic or Latino
Place of birth - Born in state of residence (%) - American Indian and Alaska Native
Place of birth - Born in state of residence (%) - Multirace
Place of birth - Born in state of residence (%) - Other Race
Place of birth - Born in other state (%)
Place of birth - Born in other state (%) - White
Place of birth - Born in other state (%) - Black or African American
Place of birth - Born in other state (%) - Asian
Place of birth - Born in other state (%) - Hispanic or Latino
Place of birth - Born in other state (%) - American Indian and Alaska Native
Place of birth - Born in other state (%) - Multirace
Place of birth - Born in other state (%) - Other Race
Place of birth - Native, outside of US (%)
Place of birth - Native, outside of US (%) - White
Place of birth - Native, outside of US (%) - Black or African American
Place of birth - Native, outside of US (%) - Asian
Place of birth - Native, outside of US (%) - Hispanic or Latino
Place of birth - Native, outside of US (%) - American Indian and Alaska Native
Place of birth - Native, outside of US (%) - Multirace
Place of birth - Native, outside of US (%) - Other Race
Place of birth - Foreign born (%)
Place of birth - Foreign born (%) - White
Place of birth - Foreign born (%) - Black or African American
Place of birth - Foreign born (%) - Asian
Place of birth - Foreign born (%) - Hispanic or Latino
Place of birth - Foreign born (%) - American Indian and Alaska Native
Place of birth - Foreign born (%) - Multirace
Place of birth - Foreign born (%) - Other Race
Residents speaking English at home (%)
Residents speaking English at home - Born in the United States (%)
Residents speaking English at home - Native, born elsewhere (%)
Residents speaking English at home - Foreign born (%)
Residents speaking Spanish at home (%)
Residents speaking Spanish at home - Born in the United States (%)
Residents speaking Spanish at home - Native, born elsewhere (%)
Residents speaking Spanish at home - Foreign born (%)
Residents speaking other language at home (%)
Residents speaking other language at home - Born in the United States (%)
Residents speaking other language at home - Native, born elsewhere (%)
Residents speaking other language at home - Foreign born (%)
Marital status - Never married (%)
Marital status - Now married (%)
Marital status - Separated (%)
Marital status - Widowed (%)
Marital status - Divorced (%)
Ancestries Reported - Arab (%)
Ancestries Reported - Czech (%)
Ancestries Reported - Danish (%)
Ancestries Reported - Dutch (%)
Ancestries Reported - English (%)
Ancestries Reported - French (%)
Ancestries Reported - French Canadian (%)
Ancestries Reported - German (%)
Ancestries Reported - Greek (%)
Ancestries Reported - Hungarian (%)
Ancestries Reported - Irish (%)
Ancestries Reported - Italian (%)
Ancestries Reported - Lithuanian (%)
Ancestries Reported - Norwegian (%)
Ancestries Reported - Polish (%)
Ancestries Reported - Portuguese (%)
Ancestries Reported - Russian (%)
Ancestries Reported - Scotch-Irish (%)
Ancestries Reported - Scottish (%)
Ancestries Reported - Slovak (%)
Ancestries Reported - Subsaharan African (%)
Ancestries Reported - Swedish (%)
Ancestries Reported - Swiss (%)
Ancestries Reported - Ukrainian (%)
Ancestries Reported - United States (%)
Ancestries Reported - Welsh (%)
Ancestries Reported - West Indian (%)
Ancestries Reported - Other (%)
Geographical mobility - Same house 1 year ago (%)
Geographical mobility - Same house 1 year ago (%) - White
Geographical mobility - Same house 1 year ago (%) - Black or African American
Geographical mobility - Same house 1 year ago (%) - Asian
Geographical mobility - Same house 1 year ago (%) - Hispanic or Latino
Geographical mobility - Same house 1 year ago (%) - American Indian and Alaska Native
Geographical mobility - Same house 1 year ago (%) - Multirace
Geographical mobility - Same house 1 year ago (%) - Other Race
Geographical mobility - Moved within same county (%)
Geographical mobility - Moved within same county (%) - White
Geographical mobility - Moved within same county (%) - Black or African American
Geographical mobility - Moved within same county (%) - Asian
Geographical mobility - Moved within same county (%) - Hispanic or Latino
Geographical mobility - Moved within same county (%) - American Indian and Alaska Native
Geographical mobility - Moved within same county (%) - Multirace
Geographical mobility - Moved within same county (%) - Other Race
Geographical mobility - Moved from different county within same state (%)
Geographical mobility - Moved from different county within same state (%) - White
Geographical mobility - Moved from different county within same state (%) - Black or African American
Geographical mobility - Moved from different county within same state (%) - Asian
Geographical mobility - Moved from different county within same state (%) - Hispanic or Latino
Geographical mobility - Moved from different county within same state (%) - American Indian and Alaska Native
Geographical mobility - Moved from different county within same state (%) - Multirace
Geographical mobility - Moved from different county within same state (%) - Other Race
Geographical mobility - Moved from different state (%)
Geographical mobility - Moved from different state (%) - White
Geographical mobility - Moved from different state (%) - Black or African American
Geographical mobility - Moved from different state (%) - Asian
Geographical mobility - Moved from different state (%) - Hispanic or Latino
Geographical mobility - Moved from different state (%) - American Indian and Alaska Native
Geographical mobility - Moved from different state (%) - Multirace
Geographical mobility - Moved from different state (%) - Other Race
Geographical mobility - Moved from abroad (%)
Geographical mobility - Moved from abroad (%) - White
Geographical mobility - Moved from abroad (%) - Black or African American
Geographical mobility - Moved from abroad (%) - Asian
Geographical mobility - Moved from abroad (%) - Hispanic or Latino
Geographical mobility - Moved from abroad (%) - American Indian and Alaska Native
Geographical mobility - Moved from abroad (%) - Multirace
Geographical mobility - Moved from abroad (%) - Other Race
Place of birth for the foreign-born population - Ireland (%)
Place of birth for the foreign-born population - Denmark (%)
Place of birth for the foreign-born population - Norway (%)
Place of birth for the foreign-born population - Sweden (%)
Place of birth for the foreign-born population - United Kingdom (%)
Place of birth for the foreign-born population - England (%)
Place of birth for the foreign-born population - Scotland (%)
Place of birth for the foreign-born population - Other Northern Europe (%)
Place of birth for the foreign-born population - Austria (%)
Place of birth for the foreign-born population - Belgium (%)
Place of birth for the foreign-born population - France (%)
Place of birth for the foreign-born population - Germany (%)
Place of birth for the foreign-born population - Netherlands (%)
Place of birth for the foreign-born population - Switzerland (%)
Place of birth for the foreign-born population - Other Western Europe (%)
Place of birth for the foreign-born population - Greece (%)
Place of birth for the foreign-born population - Italy (%)
Place of birth for the foreign-born population - Portugal (%)
Place of birth for the foreign-born population - Spain (%)
Place of birth for the foreign-born population - Other Southern Europe (%)
Place of birth for the foreign-born population - Albania (%)
Place of birth for the foreign-born population - Belarus (%)
Place of birth for the foreign-born population - Bosnia and Herzegovina (%)
Place of birth for the foreign-born population - Bulgaria (%)
Place of birth for the foreign-born population - Croatia (%)
Place of birth for the foreign-born population - Czechoslovakia (%)
Place of birth for the foreign-born population - Hungary (%)
Place of birth for the foreign-born population - Latvia (%)
Place of birth for the foreign-born population - Lithuania (%)
Place of birth for the foreign-born population - North Macedonia (Macedonia) (%)
Place of birth for the foreign-born population - Moldova (%)
Place of birth for the foreign-born population - Poland (%)
Place of birth for the foreign-born population - Romania (%)
Place of birth for the foreign-born population - Russia (%)
Place of birth for the foreign-born population - Serbia (%)
Place of birth for the foreign-born population - Ukraine (%)
Place of birth for the foreign-born population - Other Eastern Europe (%)
Place of birth for the foreign-born population - China (%)
Place of birth for the foreign-born population - Hong Kong (%)
Place of birth for the foreign-born population - Taiwan (%)
Place of birth for the foreign-born population - Japan (%)
Place of birth for the foreign-born population - Korea (%)
Place of birth for the foreign-born population - Other Eastern Asia (%)
Place of birth for the foreign-born population - Afghanistan (%)
Place of birth for the foreign-born population - Bangladesh (%)
Place of birth for the foreign-born population - India (%)
Place of birth for the foreign-born population - Iran (%)
Place of birth for the foreign-born population - Kazakhstan (%)
Place of birth for the foreign-born population - Nepal (%)
Place of birth for the foreign-born population - Pakistan (%)
Place of birth for the foreign-born population - Sri Lanka (%)
Place of birth for the foreign-born population - Uzbekistan (%)
Place of birth for the foreign-born population - Other South Central Asia (%)
Place of birth for the foreign-born population - Burma (%)
Place of birth for the foreign-born population - Cambodia (%)
Place of birth for the foreign-born population - Indonesia (%)
Place of birth for the foreign-born population - Laos (%)
Place of birth for the foreign-born population - Malaysia (%)
Place of birth for the foreign-born population - Philippines (%)
Place of birth for the foreign-born population - Singapore (%)
Place of birth for the foreign-born population - Thailand (%)
Place of birth for the foreign-born population - Vietnam (%)
Place of birth for the foreign-born population - Other South Eastern Asia (%)
Place of birth for the foreign-born population - Armenia (%)
Place of birth for the foreign-born population - Iraq (%)
Place of birth for the foreign-born population - Israel (%)
Place of birth for the foreign-born population - Jordan (%)
Place of birth for the foreign-born population - Kuwait (%)
Place of birth for the foreign-born population - Lebanon (%)
Place of birth for the foreign-born population - Saudi Arabia (%)
Place of birth for the foreign-born population - Syria (%)
Place of birth for the foreign-born population - Turkey (%)
Place of birth for the foreign-born population - Yemen (%)
Place of birth for the foreign-born population - Other Western Asia (%)
Place of birth for the foreign-born population - Eritrea (%)
Place of birth for the foreign-born population - Ethiopia (%)
Place of birth for the foreign-born population - Kenya (%)
Place of birth for the foreign-born population - Somalia (%)
Place of birth for the foreign-born population - Uganda (%)
Place of birth for the foreign-born population - Zimbabwe (%)
Place of birth for the foreign-born population - Other Eastern Africa (%)
Place of birth for the foreign-born population - Cameroon (%)
Place of birth for the foreign-born population - Congo (%)
Place of birth for the foreign-born population - Democratic Republic of Congo (Zaire) (%)
Place of birth for the foreign-born population - Other Middle Africa (%)
Place of birth for the foreign-born population - Egypt (%)
Place of birth for the foreign-born population - Morocco (%)
Place of birth for the foreign-born population - Sudan (%)
Place of birth for the foreign-born population - Other Northern Africa (%)
Place of birth for the foreign-born population - South Africa (%)
Place of birth for the foreign-born population - Other Southern Africa (%)
Place of birth for the foreign-born population - Cabo Verde (%)
Place of birth for the foreign-born population - Ghana (%)
Place of birth for the foreign-born population - Liberia (%)
Place of birth for the foreign-born population - Nigeria (%)
Place of birth for the foreign-born population - Senegal (%)
Place of birth for the foreign-born population - Sierra Leone (%)
Place of birth for the foreign-born population - Other Western Africa (%)
Place of birth for the foreign-born population - Australia (%)
Place of birth for the foreign-born population - New Zealand (%)
Place of birth for the foreign-born population - Fiji (%)
Place of birth for the foreign-born population - Micronesia (%)
Place of birth for the foreign-born population - Bahamas (%)
Place of birth for the foreign-born population - Barbados (%)
Place of birth for the foreign-born population - Cuba (%)
Place of birth for the foreign-born population - Dominica (%)
Place of birth for the foreign-born population - Dominican Republic (%)
Place of birth for the foreign-born population - Grenada (%)
Place of birth for the foreign-born population - Haiti (%)
Place of birth for the foreign-born population - Jamaica (%)
Place of birth for the foreign-born population - St. Vincent and the Grenadines (%)
Place of birth for the foreign-born population - Trinidad and Tobago (%)
Place of birth for the foreign-born population - West Indies (%)
Place of birth for the foreign-born population - Other Caribbean (%)
Place of birth for the foreign-born population - Belize (%)
Place of birth for the foreign-born population - Costa Rica (%)
Place of birth for the foreign-born population - El Salvador (%)
Place of birth for the foreign-born population - Guatemala (%)
Place of birth for the foreign-born population - Honduras (%)
Place of birth for the foreign-born population - Mexico (%)
Place of birth for the foreign-born population - Nicaragua (%)
Place of birth for the foreign-born population - Panama (%)
Place of birth for the foreign-born population - Other Central America (%)
Place of birth for the foreign-born population - Argentina (%)
Place of birth for the foreign-born population - Bolivia (%)
Place of birth for the foreign-born population - Brazil (%)
Place of birth for the foreign-born population - Chile (%)
Place of birth for the foreign-born population - Colombia (%)
Place of birth for the foreign-born population - Ecuador (%)
Place of birth for the foreign-born population - Guyana (%)
Place of birth for the foreign-born population - Peru (%)
Place of birth for the foreign-born population - Uruguay (%)
Place of birth for the foreign-born population - Venezuela (%)
Place of birth for the foreign-born population - Other South America (%)
Place of birth for the foreign-born population - Canada (%)
Place of birth for the foreign-born population - Other Northern America (%)
Place of birth for the foreign-born population - Other (%)
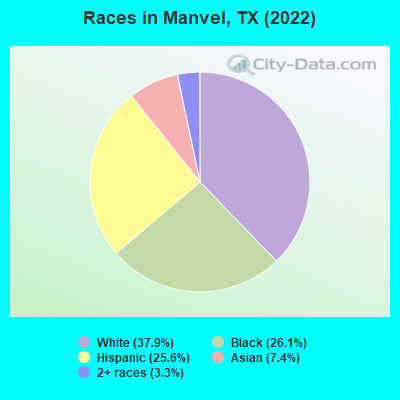
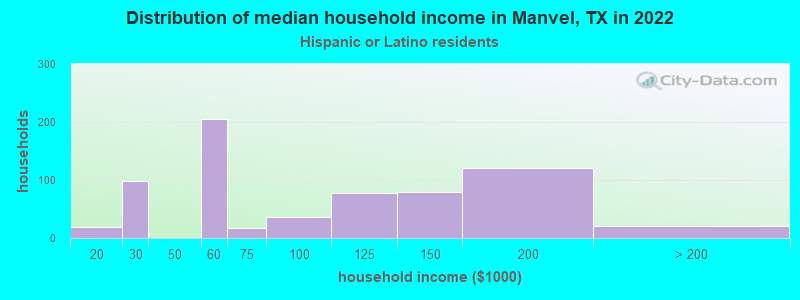
According to 2022 data, the most numerous races in Manvel, TX are Hispanic (2,988 residents), White alone (4,422 residents), and Black alone (3,047 residents). 80.3% of Manvel residents speak English at home. 13.5% of Manvel, TX residents are foreign-born (6.2% born in Asia, 5.3% born in Latin America, 1.6% born in Europe), which is 25.9% less than the foreign-born rate of 17.0% across the entire state of Texas.
Race distribution in Manvel
2000 2022
10,933,313 52.4% White alone 6,669,666 32.0% Hispanic 2,364,255 11.3% Black alone 554,445 2.7% Asian alone 230,567 1.1% Two or more races 68,859 0.3% American Indian alone 19,958 0.10% Other race alone 10,757 0.05% Native Hawaiian and Other
12,070,642 40.2% Hispanic 11,683,430 38.9% White alone 3,508,706 11.7% Black alone 1,608,173 5.4% Asian alone 956,560 3.2% Two or more races 125,763 0.4% Other race alone 47,023 0.2% American Indian alone 29,275 0.10% Native Hawaiian and Other
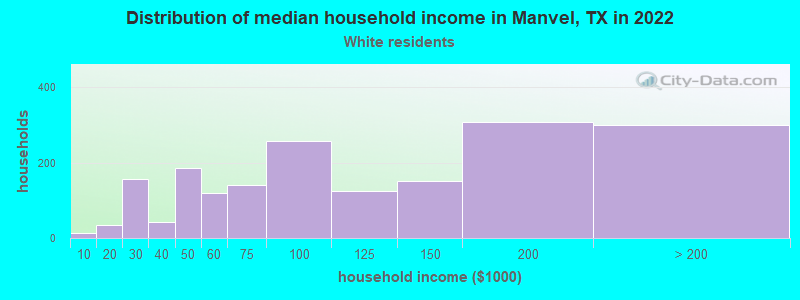
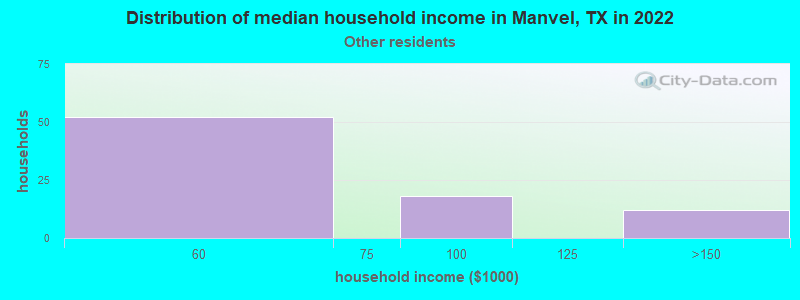
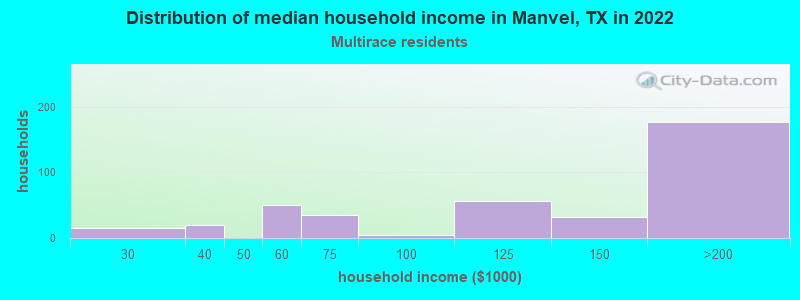
Income and house value in Manvel Median household income in 2022 $97,134 White non-Hispanic householders$88,003 Black householders$159,776 Asian householders$140,593 Two or more races householders$96,440 Hispanic or Latino race householdersMedian 2022 house value $362,846 White Non-Hispanic householders$408,245 Black or African American householders$384,010 Some other race householders$384,010 Two or more races householders$360,116 Hispanic or Latino householders
Median age by race in Manvel
42.7 Median age for White residents42.0 43.6 36.7 Median age for Black or African American residents25.9 42.8 -733,705,772.1 Median age for American Indian / Alaska Native residents-560,150,375.4 -726,368,158.5 37.5 Median age for Asian residents38.6 29.0 -1,307,359,306.1 Median age for Native Hawaiian / Pacific Islander residents-688,430,698.1 -577,777,777.2 17.0 Median age for Other race residents13.1 17.4 13.7 Median age for Two or more races residents11.3 26.1 40.9 Median age for White alone residents40.6 40.8 26.7 Median age for Hispanic or Latino residents22.3 27.4
Owner/renter occupied households by race in Manvel
House owners and renters - White residents 1,551 83.8% Owner occupied301 16.2% Renter occupiedHouse owners and renters - Black or African American residents 1,123 80.5% Owner occupied272 19.5% Renter occupiedHouse owners and renters - Asian residents 187 100.0% Owner occupiedHouse owners and renters - Other race residents 90 100.0% Owner occupiedHouse owners and renters - Two or more races residents 418 100.0% Owner occupiedHouse owners and renters - White alone residents 1,374 80.3% Owner occupied336 19.7% Renter occupiedHouse owners and renters - Hispanic or Latino residents 639 100.0% Owner occupied
Language usage in Manvel
English speakers - Total 80.3% of residents of Manvel speak English at home.
13.3% of residents speak Spanish at home 1,073 72.7% Speak English very well403 27.3% Speak English less than very well6.3% of residents speak other language at home 646 92.9% Speak English very well49 7.1% Speak English less than very well
English speakers - Born in the United States 83.5% of residents of Manvel speak English at home.
12.0% of residents speak Spanish at home 284 100.0% Speak English very well3.1% of residents speak other language at home 73 100.0% Speak English very well
English speakers - Foreign-born 27.9% of residents of Manvel speak English at home.
32.0% of residents speak Spanish at home 197 40.6% Speak English very well288 59.4% Speak English less than very well37.8% of residents speak other language at home 528 92.1% Speak English very well45 7.9% Speak English less than very well
White (Caucasian) - Speak only English Native:
97.5% (4,162)Foreign-born:
51.4% (111)
White (Caucasian) - Speak another language Native:
4.7% (199)Foreign-born:
59.6% (129)
Black or African American - Speak only English Native:
100.0% (3,147)Foreign-born:
24.0% (19)
Asian - Speak another language Native:
100.0% (123)Foreign-born:
65.9% (477)
Other race - Speak another language Native:
34.0% (182)Foreign-born:
98.9% (194)
Two or more races - Speak only English Native:
58.7% (857)Foreign-born:
27.7% (41)
Two or more races - Speak another language Native:
41.2% (600)Foreign-born:
62.2% (92)
White alone - Speak only English Native:
100.0% (4,133)Foreign-born:
48.0% (81)
White alone - Speak another language Native:
0.1% (5)Foreign-born:
48.4% (82)
Hispanic or Latino - Speak only English Native:
52.4% (1,111)Foreign-born:
14.9% (85)
Hispanic or Latino - Speak another language Native:
47.7% (1,012)Foreign-born:
84.5% (484)
Foreign-born residents in Manvel 1,576 residents are foreign born (6.2% Asia , 5.3% Latin America , 1.6% Europe ).
This city:
13.5%Texas:
17.1%
Marital status for residents in Manvel Marital status - White (Caucasian) population 15 years and over
Males 36.8% Never married55.5% Now married1.4% Separated2.7% Widowed3.6% DivorcedFemales 21.8% Never married61.0% Now married0.0% Separated8.1% Widowed9.1% DivorcedWomen who gave birth in the past 12 months Now married:
100.0% (33)Unmarried:
0.0% (0)
Women who did not give birth in the past 12 months Now married:
62.6% (673)Unmarried:
37.4% (402)
Marital status - Black or African American population 15 years and over
Males 48.4% Never married46.8% Now married0.0% Separated4.8% Widowed0.0% DivorcedFemales 29.1% Never married38.5% Now married0.0% Separated0.0% Widowed32.4% DivorcedWomen who gave birth in the past 12 months Now married:
100.0% (64)Unmarried:
0.0% (0)
Women who did not give birth in the past 12 months Now married:
34.1% (364)Unmarried:
65.9% (702)
Marital status - Asian population 15 years and over
Males 41.6% Never married50.3% Now married0.0% Separated0.0% Widowed8.2% DivorcedFemales 19.5% Never married67.1% Now married0.0% Separated0.0% Widowed13.4% DivorcedWomen who gave birth in the past 12 months Now married:
100.0% (10)Unmarried:
0.0% (0)
Women who did not give birth in the past 12 months Now married:
76.5% (192)Unmarried:
23.5% (59)
Marital status - Other race population 15 years and over
Males 36.3% Never married63.7% Now married0.0% Separated0.0% Widowed0.0% DivorcedFemales 55.1% Never married44.9% Now married0.0% Separated0.0% Widowed0.0% DivorcedWomen who did not give birth in the past 12 months Now married:
41.8% (161)Unmarried:
58.2% (224)
Marital status - Two or more races population 15 years and over
Males 11.1% Never married88.9% Now married0.0% Separated0.0% Widowed0.0% DivorcedFemales 9.1% Never married81.1% Now married0.0% Separated3.5% Widowed6.3% DivorcedWomen who did not give birth in the past 12 months Now married:
89.3% (325)Unmarried:
10.7% (39)
Marital status - White alone, not Hispanic / Latino population 15 years and over
Males 35.2% Never married55.5% Now married1.7% Separated3.2% Widowed4.4% DivorcedFemales 21.4% Never married61.2% Now married0.0% Separated9.2% Widowed8.2% DivorcedWomen who gave birth in the past 12 months Now married:
100.0% (39)Unmarried:
0.0% (0)
Women who did not give birth in the past 12 months Now married:
63.4% (655)Unmarried:
36.6% (378)
Marital status - Hispanic or Latino population 15 years and over
Males 28.8% Never married71.2% Now married0.0% Separated0.0% Widowed0.0% DivorcedFemales 30.2% Never married62.1% Now married0.0% Separated2.1% Widowed5.6% DivorcedWomen who did not give birth in the past 12 months Now married:
61.3% (489)Unmarried:
38.7% (308)
Ancestries in Manvel
437 7.2% Irish374 6.2% American351 5.8% German296 4.9% English81 1.3% Ukrainian58 1.0% Trinidadian and Tobagonian51 0.8% European47 0.8% British44 0.7% Nigerian40 0.7% Italian40 0.7% Russian29 0.5% Polish28 0.5% Northern European12 0.2% Canadian
Geographical mobility in Manvel Same house 1 year ago 4,023 87.6% White (Caucasian)2,619 85.3% Black or African American164 100.0% American Indian / Alaska Native752 88.1% Asian718 96.6% Other race1,264 56.6% Two or more races3,755 85.7% White alone, not Hispanic / Latino2,398 79.8% Hispanic or LatinoMoved within same county 311 6.8% White / Caucasian16 0.5% Black or African American131 15.3% Asian351 8.0% White alone, not Hispanic / LatinoMoved within same state 204 4.4% White / Caucasian407 13.3% Black or African American1,179 52.8% Two or more races236 5.4% White alone, not Hispanic / Latino653 21.8% Hispanic or LatinoMoved from different state 45 1.0% White / Caucasian107 3.5% Black or African American45 1.0% White alone, not Hispanic / LatinoMoved from abroad 52 2.3% Two or more races45 1.5% Hispanic or Latino
Children Nativity (place of birth) in Manvel
Children under 6 years - Living with two parents Both parents native 635 100.0% NativeBoth parents foreign-born 61 100.0% NativeChildren under 6 years - Living with one parent Native parent 27 100.0% NativeChildren 6 to 17 years - Living with two parents Both parents native 1,396 100.0% NativeBoth parents foreign-born 84 44.9% Native103 55.1% Foreign-bornOne native, one foreign-born parent 61 100.0% NativeChildren 6 to 17 years - Living with one parent Native parent 511 100.0% NativeForeign-born parent 35 48.9% Native36 51.1% Foreign-born
Grandparents responsible for own grandchildren in Manvel
Grandparents (30 to 59 years) White / Caucasian 23 62.5% Responsible for grandchildren14 37.5% Not responsible for grandchildrenTwo or more races 21 100.0% Not responsible for grandchildrenWhite alone, not Hispanic / Latino 33 59.7% Responsible for grandchildren22 40.3% Not responsible for grandchildrenHispanic or Latino 12 100.0% Not responsible for grandchildren
Grandparents (60 years and over) White / Caucasian 38 100.0% Not responsible for grandchildrenTwo or more races 30 100.0% Not responsible for grandchildrenHispanic or Latino 71 100.0% Not responsible for grandchildren