Races in Mesquite, Texas (TX) Detailed Stats
Data:
Races - White alone (%)
Races - White alone (% change since 2000)
Races - Black alone (%)
Races - Black alone (% change since 2000)
Races - American Indian alone (%)
Races - American Indian alone (% change since 2000)
Races - Asian alone (%)
Races - Asian alone (% change since 2000)
Races - Hispanic (%)
Races - Hispanic (% change since 2000)
Races - Native Hawaiian and Other Pacific Islander alone (%)
Races - Native Hawaiian and Other Pacific Islander alone (% change since 2000)
Races - Two or more races(%)
Races - Two or more races(% change since 2000)
Races - Other race alone (%)
Races - Other race alone (% change since 2000)
Racial diversity
Place of birth - Born in state of residence (%)
Place of birth - Born in state of residence (%) - White
Place of birth - Born in state of residence (%) - Black or African American
Place of birth - Born in state of residence (%) - Asian
Place of birth - Born in state of residence (%) - Hispanic or Latino
Place of birth - Born in state of residence (%) - American Indian and Alaska Native
Place of birth - Born in state of residence (%) - Multirace
Place of birth - Born in state of residence (%) - Other Race
Place of birth - Born in other state (%)
Place of birth - Born in other state (%) - White
Place of birth - Born in other state (%) - Black or African American
Place of birth - Born in other state (%) - Asian
Place of birth - Born in other state (%) - Hispanic or Latino
Place of birth - Born in other state (%) - American Indian and Alaska Native
Place of birth - Born in other state (%) - Multirace
Place of birth - Born in other state (%) - Other Race
Place of birth - Native, outside of US (%)
Place of birth - Native, outside of US (%) - White
Place of birth - Native, outside of US (%) - Black or African American
Place of birth - Native, outside of US (%) - Asian
Place of birth - Native, outside of US (%) - Hispanic or Latino
Place of birth - Native, outside of US (%) - American Indian and Alaska Native
Place of birth - Native, outside of US (%) - Multirace
Place of birth - Native, outside of US (%) - Other Race
Place of birth - Foreign born (%)
Place of birth - Foreign born (%) - White
Place of birth - Foreign born (%) - Black or African American
Place of birth - Foreign born (%) - Asian
Place of birth - Foreign born (%) - Hispanic or Latino
Place of birth - Foreign born (%) - American Indian and Alaska Native
Place of birth - Foreign born (%) - Multirace
Place of birth - Foreign born (%) - Other Race
Residents speaking English at home (%)
Residents speaking English at home - Born in the United States (%)
Residents speaking English at home - Native, born elsewhere (%)
Residents speaking English at home - Foreign born (%)
Residents speaking Spanish at home (%)
Residents speaking Spanish at home - Born in the United States (%)
Residents speaking Spanish at home - Native, born elsewhere (%)
Residents speaking Spanish at home - Foreign born (%)
Residents speaking other language at home (%)
Residents speaking other language at home - Born in the United States (%)
Residents speaking other language at home - Native, born elsewhere (%)
Residents speaking other language at home - Foreign born (%)
Marital status - Never married (%)
Marital status - Now married (%)
Marital status - Separated (%)
Marital status - Widowed (%)
Marital status - Divorced (%)
Ancestries Reported - Arab (%)
Ancestries Reported - Czech (%)
Ancestries Reported - Danish (%)
Ancestries Reported - Dutch (%)
Ancestries Reported - English (%)
Ancestries Reported - French (%)
Ancestries Reported - French Canadian (%)
Ancestries Reported - German (%)
Ancestries Reported - Greek (%)
Ancestries Reported - Hungarian (%)
Ancestries Reported - Irish (%)
Ancestries Reported - Italian (%)
Ancestries Reported - Lithuanian (%)
Ancestries Reported - Norwegian (%)
Ancestries Reported - Polish (%)
Ancestries Reported - Portuguese (%)
Ancestries Reported - Russian (%)
Ancestries Reported - Scotch-Irish (%)
Ancestries Reported - Scottish (%)
Ancestries Reported - Slovak (%)
Ancestries Reported - Subsaharan African (%)
Ancestries Reported - Swedish (%)
Ancestries Reported - Swiss (%)
Ancestries Reported - Ukrainian (%)
Ancestries Reported - United States (%)
Ancestries Reported - Welsh (%)
Ancestries Reported - West Indian (%)
Ancestries Reported - Other (%)
Geographical mobility - Same house 1 year ago (%)
Geographical mobility - Same house 1 year ago (%) - White
Geographical mobility - Same house 1 year ago (%) - Black or African American
Geographical mobility - Same house 1 year ago (%) - Asian
Geographical mobility - Same house 1 year ago (%) - Hispanic or Latino
Geographical mobility - Same house 1 year ago (%) - American Indian and Alaska Native
Geographical mobility - Same house 1 year ago (%) - Multirace
Geographical mobility - Same house 1 year ago (%) - Other Race
Geographical mobility - Moved within same county (%)
Geographical mobility - Moved within same county (%) - White
Geographical mobility - Moved within same county (%) - Black or African American
Geographical mobility - Moved within same county (%) - Asian
Geographical mobility - Moved within same county (%) - Hispanic or Latino
Geographical mobility - Moved within same county (%) - American Indian and Alaska Native
Geographical mobility - Moved within same county (%) - Multirace
Geographical mobility - Moved within same county (%) - Other Race
Geographical mobility - Moved from different county within same state (%)
Geographical mobility - Moved from different county within same state (%) - White
Geographical mobility - Moved from different county within same state (%) - Black or African American
Geographical mobility - Moved from different county within same state (%) - Asian
Geographical mobility - Moved from different county within same state (%) - Hispanic or Latino
Geographical mobility - Moved from different county within same state (%) - American Indian and Alaska Native
Geographical mobility - Moved from different county within same state (%) - Multirace
Geographical mobility - Moved from different county within same state (%) - Other Race
Geographical mobility - Moved from different state (%)
Geographical mobility - Moved from different state (%) - White
Geographical mobility - Moved from different state (%) - Black or African American
Geographical mobility - Moved from different state (%) - Asian
Geographical mobility - Moved from different state (%) - Hispanic or Latino
Geographical mobility - Moved from different state (%) - American Indian and Alaska Native
Geographical mobility - Moved from different state (%) - Multirace
Geographical mobility - Moved from different state (%) - Other Race
Geographical mobility - Moved from abroad (%)
Geographical mobility - Moved from abroad (%) - White
Geographical mobility - Moved from abroad (%) - Black or African American
Geographical mobility - Moved from abroad (%) - Asian
Geographical mobility - Moved from abroad (%) - Hispanic or Latino
Geographical mobility - Moved from abroad (%) - American Indian and Alaska Native
Geographical mobility - Moved from abroad (%) - Multirace
Geographical mobility - Moved from abroad (%) - Other Race
Place of birth for the foreign-born population - Ireland (%)
Place of birth for the foreign-born population - Denmark (%)
Place of birth for the foreign-born population - Norway (%)
Place of birth for the foreign-born population - Sweden (%)
Place of birth for the foreign-born population - United Kingdom (%)
Place of birth for the foreign-born population - England (%)
Place of birth for the foreign-born population - Scotland (%)
Place of birth for the foreign-born population - Other Northern Europe (%)
Place of birth for the foreign-born population - Austria (%)
Place of birth for the foreign-born population - Belgium (%)
Place of birth for the foreign-born population - France (%)
Place of birth for the foreign-born population - Germany (%)
Place of birth for the foreign-born population - Netherlands (%)
Place of birth for the foreign-born population - Switzerland (%)
Place of birth for the foreign-born population - Other Western Europe (%)
Place of birth for the foreign-born population - Greece (%)
Place of birth for the foreign-born population - Italy (%)
Place of birth for the foreign-born population - Portugal (%)
Place of birth for the foreign-born population - Spain (%)
Place of birth for the foreign-born population - Other Southern Europe (%)
Place of birth for the foreign-born population - Albania (%)
Place of birth for the foreign-born population - Belarus (%)
Place of birth for the foreign-born population - Bosnia and Herzegovina (%)
Place of birth for the foreign-born population - Bulgaria (%)
Place of birth for the foreign-born population - Croatia (%)
Place of birth for the foreign-born population - Czechoslovakia (%)
Place of birth for the foreign-born population - Hungary (%)
Place of birth for the foreign-born population - Latvia (%)
Place of birth for the foreign-born population - Lithuania (%)
Place of birth for the foreign-born population - North Macedonia (Macedonia) (%)
Place of birth for the foreign-born population - Moldova (%)
Place of birth for the foreign-born population - Poland (%)
Place of birth for the foreign-born population - Romania (%)
Place of birth for the foreign-born population - Russia (%)
Place of birth for the foreign-born population - Serbia (%)
Place of birth for the foreign-born population - Ukraine (%)
Place of birth for the foreign-born population - Other Eastern Europe (%)
Place of birth for the foreign-born population - China (%)
Place of birth for the foreign-born population - Hong Kong (%)
Place of birth for the foreign-born population - Taiwan (%)
Place of birth for the foreign-born population - Japan (%)
Place of birth for the foreign-born population - Korea (%)
Place of birth for the foreign-born population - Other Eastern Asia (%)
Place of birth for the foreign-born population - Afghanistan (%)
Place of birth for the foreign-born population - Bangladesh (%)
Place of birth for the foreign-born population - India (%)
Place of birth for the foreign-born population - Iran (%)
Place of birth for the foreign-born population - Kazakhstan (%)
Place of birth for the foreign-born population - Nepal (%)
Place of birth for the foreign-born population - Pakistan (%)
Place of birth for the foreign-born population - Sri Lanka (%)
Place of birth for the foreign-born population - Uzbekistan (%)
Place of birth for the foreign-born population - Other South Central Asia (%)
Place of birth for the foreign-born population - Burma (%)
Place of birth for the foreign-born population - Cambodia (%)
Place of birth for the foreign-born population - Indonesia (%)
Place of birth for the foreign-born population - Laos (%)
Place of birth for the foreign-born population - Malaysia (%)
Place of birth for the foreign-born population - Philippines (%)
Place of birth for the foreign-born population - Singapore (%)
Place of birth for the foreign-born population - Thailand (%)
Place of birth for the foreign-born population - Vietnam (%)
Place of birth for the foreign-born population - Other South Eastern Asia (%)
Place of birth for the foreign-born population - Armenia (%)
Place of birth for the foreign-born population - Iraq (%)
Place of birth for the foreign-born population - Israel (%)
Place of birth for the foreign-born population - Jordan (%)
Place of birth for the foreign-born population - Kuwait (%)
Place of birth for the foreign-born population - Lebanon (%)
Place of birth for the foreign-born population - Saudi Arabia (%)
Place of birth for the foreign-born population - Syria (%)
Place of birth for the foreign-born population - Turkey (%)
Place of birth for the foreign-born population - Yemen (%)
Place of birth for the foreign-born population - Other Western Asia (%)
Place of birth for the foreign-born population - Eritrea (%)
Place of birth for the foreign-born population - Ethiopia (%)
Place of birth for the foreign-born population - Kenya (%)
Place of birth for the foreign-born population - Somalia (%)
Place of birth for the foreign-born population - Uganda (%)
Place of birth for the foreign-born population - Zimbabwe (%)
Place of birth for the foreign-born population - Other Eastern Africa (%)
Place of birth for the foreign-born population - Cameroon (%)
Place of birth for the foreign-born population - Congo (%)
Place of birth for the foreign-born population - Democratic Republic of Congo (Zaire) (%)
Place of birth for the foreign-born population - Other Middle Africa (%)
Place of birth for the foreign-born population - Egypt (%)
Place of birth for the foreign-born population - Morocco (%)
Place of birth for the foreign-born population - Sudan (%)
Place of birth for the foreign-born population - Other Northern Africa (%)
Place of birth for the foreign-born population - South Africa (%)
Place of birth for the foreign-born population - Other Southern Africa (%)
Place of birth for the foreign-born population - Cabo Verde (%)
Place of birth for the foreign-born population - Ghana (%)
Place of birth for the foreign-born population - Liberia (%)
Place of birth for the foreign-born population - Nigeria (%)
Place of birth for the foreign-born population - Senegal (%)
Place of birth for the foreign-born population - Sierra Leone (%)
Place of birth for the foreign-born population - Other Western Africa (%)
Place of birth for the foreign-born population - Australia (%)
Place of birth for the foreign-born population - New Zealand (%)
Place of birth for the foreign-born population - Fiji (%)
Place of birth for the foreign-born population - Micronesia (%)
Place of birth for the foreign-born population - Bahamas (%)
Place of birth for the foreign-born population - Barbados (%)
Place of birth for the foreign-born population - Cuba (%)
Place of birth for the foreign-born population - Dominica (%)
Place of birth for the foreign-born population - Dominican Republic (%)
Place of birth for the foreign-born population - Grenada (%)
Place of birth for the foreign-born population - Haiti (%)
Place of birth for the foreign-born population - Jamaica (%)
Place of birth for the foreign-born population - St. Vincent and the Grenadines (%)
Place of birth for the foreign-born population - Trinidad and Tobago (%)
Place of birth for the foreign-born population - West Indies (%)
Place of birth for the foreign-born population - Other Caribbean (%)
Place of birth for the foreign-born population - Belize (%)
Place of birth for the foreign-born population - Costa Rica (%)
Place of birth for the foreign-born population - El Salvador (%)
Place of birth for the foreign-born population - Guatemala (%)
Place of birth for the foreign-born population - Honduras (%)
Place of birth for the foreign-born population - Mexico (%)
Place of birth for the foreign-born population - Nicaragua (%)
Place of birth for the foreign-born population - Panama (%)
Place of birth for the foreign-born population - Other Central America (%)
Place of birth for the foreign-born population - Argentina (%)
Place of birth for the foreign-born population - Bolivia (%)
Place of birth for the foreign-born population - Brazil (%)
Place of birth for the foreign-born population - Chile (%)
Place of birth for the foreign-born population - Colombia (%)
Place of birth for the foreign-born population - Ecuador (%)
Place of birth for the foreign-born population - Guyana (%)
Place of birth for the foreign-born population - Peru (%)
Place of birth for the foreign-born population - Uruguay (%)
Place of birth for the foreign-born population - Venezuela (%)
Place of birth for the foreign-born population - Other South America (%)
Place of birth for the foreign-born population - Canada (%)
Place of birth for the foreign-born population - Other Northern America (%)
Place of birth for the foreign-born population - Other (%)
Latest news about races in Mesquite, TX collected exclusively by city-data.com from local newspapers, TV, and radio stations
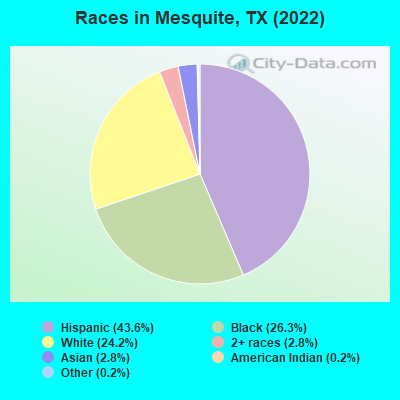
According to 2022 data, the most numerous races in Mesquite, TX are Hispanic (64,357 residents), White alone (35,808 residents), and Black alone (38,837 residents). 59.0% of Mesquite residents speak English at home. 20.7% of Mesquite, TX residents are foreign-born (16.2% born in Latin America, 2.1% born in Asia), which is 18.0% greater than the foreign-born rate of 17.0% across the entire state of Texas.
Race distribution in Mesquite
2000 2022
81,388 65.4% White alone 19,500 15.7% Hispanic 16,422 13.2% Black alone 4,634 3.7% Asian alone 1,744 1.4% Two or more races 620 0.5% American Indian alone 153 0.1% Other race alone 62 0.05% Native Hawaiian and Other
64,357 43.6% Hispanic 38,837 26.3% Black alone 35,808 24.2% White alone 4,111 2.8% Asian alone 4,146 2.8% Two or more races 225 0.2% Other race alone 239 0.2% American Indian alone
2000 2022
10,933,313 52.4% White alone 6,669,666 32.0% Hispanic 2,364,255 11.3% Black alone 554,445 2.7% Asian alone 230,567 1.1% Two or more races 68,859 0.3% American Indian alone 19,958 0.10% Other race alone 10,757 0.05% Native Hawaiian and Other
12,070,642 40.2% Hispanic 11,683,430 38.9% White alone 3,508,706 11.7% Black alone 1,608,173 5.4% Asian alone 956,560 3.2% Two or more races 125,763 0.4% Other race alone 47,023 0.2% American Indian alone 29,275 0.10% Native Hawaiian and Other
Income and house value in Mesquite Median household income in 2022 $76,713 White non-Hispanic householders$62,782 Black householders$83,079 American Indian and Alaska Native householders$96,439 Asian householders$60,969 Some other race householders$74,812 Two or more races householders$62,196 Hispanic or Latino race householdersMedian 2022 house value $260,802 White Non-Hispanic householders$309,099 Black or African American householders$222,165 American Indian or Alaska Native householders $325,614 Asian householders$101,267 Native Hawaiian and other Pacific Islander householders$237,433 Some other race householders$269,215 Two or more races householders$239,614 Hispanic or Latino householders
Median age by race in Mesquite
44.3 Median age for White residents39.7 46.2 31.7 Median age for Black or African American residents31.0 32.6 37.4 Median age for American Indian / Alaska Native residents23.6 43.2 46.0 Median age for Asian residents38.8 56.2 -666,666,666.0 Median age for Native Hawaiian / Pacific Islander residents-666,666,666.0 -666,666,666.0 22.8 Median age for Other race residents26.3 21.2 23.6 Median age for Two or more races residents23.4 23.8 48.6 Median age for White alone residents45.6 50.8 25.7 Median age for Hispanic or Latino residents23.8 28.7
Owner/renter occupied households by race in Mesquite
House owners and renters - White residents 13,827 74.2% Owner occupied4,796 25.8% Renter occupiedHouse owners and renters - Black or African American residents 4,693 29.9% Owner occupied11,002 70.1% Renter occupiedHouse owners and renters - American Indian / Alaska Native residents 344 89.0% Owner occupied42 11.0% Renter occupiedHouse owners and renters - Asian residents 1,118 84.7% Owner occupied202 15.3% Renter occupiedHouse owners and renters - Native Hawaiian / Pacific Islander residents 12 100.0% Owner occupiedHouse owners and renters - Other race residents 3,586 60.3% Owner occupied2,358 39.7% Renter occupiedHouse owners and renters - Two or more races residents 5,970 66.5% Owner occupied3,009 33.5% Renter occupiedHouse owners and renters - White alone residents 11,937 74.4% Owner occupied4,099 25.6% Renter occupiedHouse owners and renters - Hispanic or Latino residents 11,152 64.0% Owner occupied6,265 36.0% Renter occupied
Language usage in Mesquite
English speakers - Total 59.0% of residents of Mesquite speak English at home.
36.6% of residents speak Spanish at home 29,248 58.8% Speak English very well20,482 41.2% Speak English less than very well4.3% of residents speak other language at home 4,216 72.0% Speak English very well1,640 28.0% Speak English less than very well
English speakers - Born in the United States 85.1% of residents of Mesquite speak English at home.
14.4% of residents speak Spanish at home 2,489 67.1% Speak English very well1,222 32.9% Speak English less than very well0.5% of residents speak other language at home 125 100.0% Speak English very well
English speakers - Native, born elsewhere 36.3% of residents of Mesquite speak English at home.
30.3% of residents speak Spanish at home 335 64.1% Speak English very well188 35.9% Speak English less than very well33.4% of residents speak other language at home 231 40.1% Speak English very well345 59.9% Speak English less than very well
English speakers - Foreign-born 7.5% of residents of Mesquite speak English at home.
77.5% of residents speak Spanish at home 5,484 26.3% Speak English very well15,394 73.7% Speak English less than very well15.0% of residents speak other language at home 2,890 71.7% Speak English very well1,139 28.3% Speak English less than very well
White (Caucasian) - Speak only English Native:
85.7% (35,167)Foreign-born:
19.4% (456)
White (Caucasian) - Speak another language Native:
14.3% (5,871)Foreign-born:
80.6% (1,895)
Black or African American - Speak only English Native:
97.5% (31,588)Foreign-born:
24.7% (508)
Black or African American - Speak another language Native:
2.5% (803)Foreign-born:
75.4% (1,550)
American Indian / Alaska Native - Speak only English Native:
60.1% (620)Foreign-born:
3.0% (20)
American Indian / Alaska Native - Speak another language Native:
38.3% (395)Foreign-born:
96.8% (641)
Asian - Speak only English Native:
25.8% (256)Foreign-born:
10.2% (306)
Asian - Speak another language Native:
74.2% (737)Foreign-born:
89.8% (2,689)
Other race - Speak only English Native:
28.9% (3,664)Foreign-born:
2.3% (161)
Other race - Speak another language Native:
71.1% (9,002)Foreign-born:
97.7% (6,784)
Two or more races - Speak only English Native:
33.1% (6,310)Foreign-born:
5.1% (545)
Two or more races - Speak another language Native:
66.9% (12,763)Foreign-born:
94.9% (10,193)
White alone - Speak only English Native:
95.9% (33,149)Foreign-born:
18.4% (94)
White alone - Speak another language Native:
4.1% (1,423)Foreign-born:
81.6% (416)
Hispanic or Latino - Speak only English Native:
26.1% (9,670)Foreign-born:
4.9% (1,068)
Hispanic or Latino - Speak another language Native:
73.9% (27,337)Foreign-born:
95.1% (20,878)
Foreign-born residents in Mesquite 30,957 residents are foreign born (16.2% Latin America , 2.1% Asia ).
This city:
20.7%Texas:
17.1%
Marital status for residents in Mesquite Marital status - White (Caucasian) population 15 years and over
Males 33.7% Never married52.8% Now married1.4% Separated3.1% Widowed9.0% DivorcedFemales 27.3% Never married46.2% Now married0.6% Separated11.0% Widowed14.9% DivorcedWomen who gave birth in the past 12 months Now married:
43.9% (115)Unmarried:
56.1% (147)
Women who did not give birth in the past 12 months Now married:
40.8% (4,093)Unmarried:
59.2% (5,947)
Marital status - Black or African American population 15 years and over
Males 47.7% Never married29.6% Now married6.1% Separated0.7% Widowed15.9% DivorcedFemales 44.9% Never married29.3% Now married4.3% Separated4.0% Widowed17.4% DivorcedWomen who gave birth in the past 12 months Now married:
32.1% (262)Unmarried:
67.9% (554)
Women who did not give birth in the past 12 months Now married:
37.9% (3,692)Unmarried:
62.1% (6,062)
Marital status - American Indian / Alaska Native population 15 years and over
Males 47.9% Never married36.5% Now married11.0% Separated1.4% Widowed3.2% DivorcedFemales 39.6% Never married56.1% Now married1.6% Separated0.9% Widowed1.8% DivorcedWomen who did not give birth in the past 12 months Now married:
49.8% (217)Unmarried:
50.2% (219)
Marital status - Asian population 15 years and over
Males 29.8% Never married65.5% Now married0.0% Separated1.6% Widowed3.0% DivorcedFemales 19.4% Never married71.4% Now married1.0% Separated2.8% Widowed5.5% DivorcedWomen who gave birth in the past 12 months Now married:
56.3% (18)Unmarried:
43.8% (14)
Women who did not give birth in the past 12 months Now married:
58.7% (414)Unmarried:
41.3% (292)
Marital status - Native Hawaiian / Pacific Islander population 15 years and over
Males 0.0% Never married100.0% Now married0.0% Separated0.0% Widowed0.0% DivorcedFemales 0.0% Never married100.0% Now married0.0% Separated0.0% Widowed0.0% DivorcedWomen who did not give birth in the past 12 months Now married:
100.0% (19)Unmarried:
0.0% (0)
Marital status - Other race population 15 years and over
Males 34.2% Never married55.8% Now married4.8% Separated0.8% Widowed4.4% DivorcedFemales 32.7% Never married48.9% Now married2.1% Separated8.6% Widowed7.7% DivorcedWomen who gave birth in the past 12 months Now married:
100.0% (133)Unmarried:
0.0% (0)
Women who did not give birth in the past 12 months Now married:
51.0% (2,870)Unmarried:
49.0% (2,759)
Marital status - Two or more races population 15 years and over
Males 47.9% Never married44.1% Now married2.8% Separated0.0% Widowed5.2% DivorcedFemales 32.5% Never married42.7% Now married12.2% Separated4.1% Widowed8.4% DivorcedWomen who gave birth in the past 12 months Now married:
19.4% (128)Unmarried:
80.6% (531)
Women who did not give birth in the past 12 months Now married:
55.8% (3,971)Unmarried:
44.2% (3,148)
Marital status - White alone, not Hispanic / Latino population 15 years and over
Males 32.2% Never married54.8% Now married1.7% Separated3.7% Widowed7.7% DivorcedFemales 22.4% Never married46.1% Now married0.8% Separated13.4% Widowed17.4% DivorcedWomen who gave birth in the past 12 months Now married:
63.2% (115)Unmarried:
36.8% (67)
Women who did not give birth in the past 12 months Now married:
44.0% (3,234)Unmarried:
56.0% (4,114)
Marital status - Hispanic or Latino population 15 years and over
Males 45.0% Never married46.5% Now married3.4% Separated0.0% Widowed5.2% DivorcedFemales 42.7% Never married43.9% Now married5.8% Separated2.0% Widowed5.7% DivorcedWomen who gave birth in the past 12 months Now married:
29.9% (260)Unmarried:
70.1% (611)
Women who did not give birth in the past 12 months Now married:
47.6% (8,353)Unmarried:
52.4% (9,179)
Ancestries in Mesquite
4,623 5.1% American3,145 3.5% English1,529 1.7% German1,429 1.6% Irish1,227 1.3% African529 0.6% Nigerian413 0.5% British335 0.4% Arab334 0.4% Italian311 0.3% Ugandan293 0.3% European224 0.2% Scotch-Irish207 0.2% Scottish164 0.2% Zimbabwean164 0.2% French158 0.2% Jordanian158 0.2% Norwegian141 0.2% Czech135 0.1% Dutch118 0.1% Sudanese94 0.1% Greek92 0.1% West Indian88 0.10% Welsh69 0.08% Belizean63 0.07% Iranian63 0.07% Jamaican58 0.06% Polish57 0.06% French Canadian55 0.06% Ghanaian53 0.06% Slovene52 0.06% Yugoslavian45 0.05% Russian43 0.05% Turkish40 0.04% Hungarian38 0.04% Egyptian35 0.04% Barbadian28 0.03% Portuguese24 0.03% Swedish22 0.02% Haitian18 0.02% Finnish14 0.02% Belgian13 0.01% Sierra Leonean11 0.01% Slavic11 0.01% Scandinavian11 0.01% Eastern European9 0.01% Czechoslovakian8 0.01% Lebanese7 0.01% Brazilian7 0.01% Swiss5 0.01% Northern European
Geographical mobility in Mesquite Same house 1 year ago 40,582 90.1% White (Caucasian)24,890 59.9% Black or African American1,793 99.1% American Indian / Alaska Native3,554 93.1% Asian30 98.2% Native Hawaiian / Pacific Islander20,149 91.6% Other race33,289 89.5% Two or more races33,497 93.9% White alone, not Hispanic / Latino59,065 88.8% Hispanic or LatinoMoved within same county 3,276 7.3% White / Caucasian10,297 24.8% Black or African American33 1.8% American Indian / Alaska Native76 2.0% Asian1,294 5.9% Other race3,125 8.4% Two or more races1,635 4.6% White alone, not Hispanic / Latino5,837 8.8% Hispanic or LatinoMoved within same state 824 1.8% White / Caucasian3,928 9.5% Black or African American7 0.4% American Indian / Alaska Native45 1.2% Asian141 0.6% Other race391 1.1% Two or more races339 1.0% White alone, not Hispanic / Latino369 0.6% Hispanic or LatinoMoved from different state 187 0.4% White / Caucasian611 1.5% Black or African American54 1.4% Asian14 0.1% Other race170 0.5% Two or more races136 0.4% White alone, not Hispanic / Latino163 0.2% Hispanic or LatinoMoved from abroad 181 0.4% White1,830 4.4% Black or African American72 1.9% Asian446 2.0% Other race215 0.6% Two or more races49 0.1% White alone, not Hispanic / Latino864 1.3% Hispanic or Latino
Children Nativity (place of birth) in Mesquite
Children under 6 years - Living with two parents Both parents native 3,889 100.0% NativeBoth parents foreign-born 2,026 100.0% NativeOne native, one foreign-born parent 803 100.0% NativeChildren under 6 years - Living with one parent Native parent 4,887 100.0% NativeForeign-born parent 834 100.0% NativeChildren 6 to 17 years - Living with two parents Both parents native 6,760 99.1% Native63 0.9% Foreign-bornBoth parents foreign-born 6,250 91.6% Native575 8.4% Foreign-bornOne native, one foreign-born parent 2,299 100.0% NativeChildren 6 to 17 years - Living with one parent Native parent 10,920 100.0% NativeForeign-born parent 1,889 51.1% Native1,805 48.9% Foreign-born
Grandparents responsible for own grandchildren in Mesquite
Grandparents (30 to 59 years) White / Caucasian 153 24.8% Responsible for grandchildren463 75.2% Not responsible for grandchildrenBlack or African American 129 32.3% Responsible for grandchildren270 67.7% Not responsible for grandchildrenAmerican Indian / Alaska Native 17 100.0% Responsible for grandchildrenOther race 361 51.7% Responsible for grandchildren337 48.3% Not responsible for grandchildrenTwo or more races 420 72.7% Responsible for grandchildren158 27.3% Not responsible for grandchildrenWhite alone, not Hispanic / Latino 150 38.9% Responsible for grandchildren236 61.1% Not responsible for grandchildrenHispanic or Latino 596 45.5% Responsible for grandchildren714 54.5% Not responsible for grandchildrenGrandparents (60 years and over) White / Caucasian 118 26.3% Responsible for grandchildren331 73.7% Not responsible for grandchildrenBlack or African American 369 63.7% Responsible for grandchildren210 36.3% Not responsible for grandchildrenOther race 89 21.9% Responsible for grandchildren317 78.1% Not responsible for grandchildrenTwo or more races 41 15.0% Responsible for grandchildren233 85.0% Not responsible for grandchildrenWhite alone, not Hispanic / Latino 130 30.5% Responsible for grandchildren296 69.5% Not responsible for grandchildrenHispanic or Latino 117 14.9% Responsible for grandchildren668 85.1% Not responsible for grandchildren