Races in Mill Creek East, Washington (WA) Detailed Stats
Data:
Races - White alone (%)
Races - White alone (% change since 2000)
Races - Black alone (%)
Races - Black alone (% change since 2000)
Races - American Indian alone (%)
Races - American Indian alone (% change since 2000)
Races - Asian alone (%)
Races - Asian alone (% change since 2000)
Races - Hispanic (%)
Races - Hispanic (% change since 2000)
Races - Native Hawaiian and Other Pacific Islander alone (%)
Races - Native Hawaiian and Other Pacific Islander alone (% change since 2000)
Races - Two or more races(%)
Races - Two or more races(% change since 2000)
Races - Other race alone (%)
Races - Other race alone (% change since 2000)
Racial diversity
Place of birth - Born in state of residence (%)
Place of birth - Born in state of residence (%) - White
Place of birth - Born in state of residence (%) - Black or African American
Place of birth - Born in state of residence (%) - Asian
Place of birth - Born in state of residence (%) - Hispanic or Latino
Place of birth - Born in state of residence (%) - American Indian and Alaska Native
Place of birth - Born in state of residence (%) - Multirace
Place of birth - Born in state of residence (%) - Other Race
Place of birth - Born in other state (%)
Place of birth - Born in other state (%) - White
Place of birth - Born in other state (%) - Black or African American
Place of birth - Born in other state (%) - Asian
Place of birth - Born in other state (%) - Hispanic or Latino
Place of birth - Born in other state (%) - American Indian and Alaska Native
Place of birth - Born in other state (%) - Multirace
Place of birth - Born in other state (%) - Other Race
Place of birth - Native, outside of US (%)
Place of birth - Native, outside of US (%) - White
Place of birth - Native, outside of US (%) - Black or African American
Place of birth - Native, outside of US (%) - Asian
Place of birth - Native, outside of US (%) - Hispanic or Latino
Place of birth - Native, outside of US (%) - American Indian and Alaska Native
Place of birth - Native, outside of US (%) - Multirace
Place of birth - Native, outside of US (%) - Other Race
Place of birth - Foreign born (%)
Place of birth - Foreign born (%) - White
Place of birth - Foreign born (%) - Black or African American
Place of birth - Foreign born (%) - Asian
Place of birth - Foreign born (%) - Hispanic or Latino
Place of birth - Foreign born (%) - American Indian and Alaska Native
Place of birth - Foreign born (%) - Multirace
Place of birth - Foreign born (%) - Other Race
Residents speaking English at home (%)
Residents speaking English at home - Born in the United States (%)
Residents speaking English at home - Native, born elsewhere (%)
Residents speaking English at home - Foreign born (%)
Residents speaking Spanish at home (%)
Residents speaking Spanish at home - Born in the United States (%)
Residents speaking Spanish at home - Native, born elsewhere (%)
Residents speaking Spanish at home - Foreign born (%)
Residents speaking other language at home (%)
Residents speaking other language at home - Born in the United States (%)
Residents speaking other language at home - Native, born elsewhere (%)
Residents speaking other language at home - Foreign born (%)
Marital status - Never married (%)
Marital status - Now married (%)
Marital status - Separated (%)
Marital status - Widowed (%)
Marital status - Divorced (%)
Ancestries Reported - Arab (%)
Ancestries Reported - Czech (%)
Ancestries Reported - Danish (%)
Ancestries Reported - Dutch (%)
Ancestries Reported - English (%)
Ancestries Reported - French (%)
Ancestries Reported - French Canadian (%)
Ancestries Reported - German (%)
Ancestries Reported - Greek (%)
Ancestries Reported - Hungarian (%)
Ancestries Reported - Irish (%)
Ancestries Reported - Italian (%)
Ancestries Reported - Lithuanian (%)
Ancestries Reported - Norwegian (%)
Ancestries Reported - Polish (%)
Ancestries Reported - Portuguese (%)
Ancestries Reported - Russian (%)
Ancestries Reported - Scotch-Irish (%)
Ancestries Reported - Scottish (%)
Ancestries Reported - Slovak (%)
Ancestries Reported - Subsaharan African (%)
Ancestries Reported - Swedish (%)
Ancestries Reported - Swiss (%)
Ancestries Reported - Ukrainian (%)
Ancestries Reported - United States (%)
Ancestries Reported - Welsh (%)
Ancestries Reported - West Indian (%)
Ancestries Reported - Other (%)
Geographical mobility - Same house 1 year ago (%)
Geographical mobility - Same house 1 year ago (%) - White
Geographical mobility - Same house 1 year ago (%) - Black or African American
Geographical mobility - Same house 1 year ago (%) - Asian
Geographical mobility - Same house 1 year ago (%) - Hispanic or Latino
Geographical mobility - Same house 1 year ago (%) - American Indian and Alaska Native
Geographical mobility - Same house 1 year ago (%) - Multirace
Geographical mobility - Same house 1 year ago (%) - Other Race
Geographical mobility - Moved within same county (%)
Geographical mobility - Moved within same county (%) - White
Geographical mobility - Moved within same county (%) - Black or African American
Geographical mobility - Moved within same county (%) - Asian
Geographical mobility - Moved within same county (%) - Hispanic or Latino
Geographical mobility - Moved within same county (%) - American Indian and Alaska Native
Geographical mobility - Moved within same county (%) - Multirace
Geographical mobility - Moved within same county (%) - Other Race
Geographical mobility - Moved from different county within same state (%)
Geographical mobility - Moved from different county within same state (%) - White
Geographical mobility - Moved from different county within same state (%) - Black or African American
Geographical mobility - Moved from different county within same state (%) - Asian
Geographical mobility - Moved from different county within same state (%) - Hispanic or Latino
Geographical mobility - Moved from different county within same state (%) - American Indian and Alaska Native
Geographical mobility - Moved from different county within same state (%) - Multirace
Geographical mobility - Moved from different county within same state (%) - Other Race
Geographical mobility - Moved from different state (%)
Geographical mobility - Moved from different state (%) - White
Geographical mobility - Moved from different state (%) - Black or African American
Geographical mobility - Moved from different state (%) - Asian
Geographical mobility - Moved from different state (%) - Hispanic or Latino
Geographical mobility - Moved from different state (%) - American Indian and Alaska Native
Geographical mobility - Moved from different state (%) - Multirace
Geographical mobility - Moved from different state (%) - Other Race
Geographical mobility - Moved from abroad (%)
Geographical mobility - Moved from abroad (%) - White
Geographical mobility - Moved from abroad (%) - Black or African American
Geographical mobility - Moved from abroad (%) - Asian
Geographical mobility - Moved from abroad (%) - Hispanic or Latino
Geographical mobility - Moved from abroad (%) - American Indian and Alaska Native
Geographical mobility - Moved from abroad (%) - Multirace
Geographical mobility - Moved from abroad (%) - Other Race
Place of birth for the foreign-born population - Ireland (%)
Place of birth for the foreign-born population - Denmark (%)
Place of birth for the foreign-born population - Norway (%)
Place of birth for the foreign-born population - Sweden (%)
Place of birth for the foreign-born population - United Kingdom (%)
Place of birth for the foreign-born population - England (%)
Place of birth for the foreign-born population - Scotland (%)
Place of birth for the foreign-born population - Other Northern Europe (%)
Place of birth for the foreign-born population - Austria (%)
Place of birth for the foreign-born population - Belgium (%)
Place of birth for the foreign-born population - France (%)
Place of birth for the foreign-born population - Germany (%)
Place of birth for the foreign-born population - Netherlands (%)
Place of birth for the foreign-born population - Switzerland (%)
Place of birth for the foreign-born population - Other Western Europe (%)
Place of birth for the foreign-born population - Greece (%)
Place of birth for the foreign-born population - Italy (%)
Place of birth for the foreign-born population - Portugal (%)
Place of birth for the foreign-born population - Spain (%)
Place of birth for the foreign-born population - Other Southern Europe (%)
Place of birth for the foreign-born population - Albania (%)
Place of birth for the foreign-born population - Belarus (%)
Place of birth for the foreign-born population - Bosnia and Herzegovina (%)
Place of birth for the foreign-born population - Bulgaria (%)
Place of birth for the foreign-born population - Croatia (%)
Place of birth for the foreign-born population - Czechoslovakia (%)
Place of birth for the foreign-born population - Hungary (%)
Place of birth for the foreign-born population - Latvia (%)
Place of birth for the foreign-born population - Lithuania (%)
Place of birth for the foreign-born population - North Macedonia (Macedonia) (%)
Place of birth for the foreign-born population - Moldova (%)
Place of birth for the foreign-born population - Poland (%)
Place of birth for the foreign-born population - Romania (%)
Place of birth for the foreign-born population - Russia (%)
Place of birth for the foreign-born population - Serbia (%)
Place of birth for the foreign-born population - Ukraine (%)
Place of birth for the foreign-born population - Other Eastern Europe (%)
Place of birth for the foreign-born population - China (%)
Place of birth for the foreign-born population - Hong Kong (%)
Place of birth for the foreign-born population - Taiwan (%)
Place of birth for the foreign-born population - Japan (%)
Place of birth for the foreign-born population - Korea (%)
Place of birth for the foreign-born population - Other Eastern Asia (%)
Place of birth for the foreign-born population - Afghanistan (%)
Place of birth for the foreign-born population - Bangladesh (%)
Place of birth for the foreign-born population - India (%)
Place of birth for the foreign-born population - Iran (%)
Place of birth for the foreign-born population - Kazakhstan (%)
Place of birth for the foreign-born population - Nepal (%)
Place of birth for the foreign-born population - Pakistan (%)
Place of birth for the foreign-born population - Sri Lanka (%)
Place of birth for the foreign-born population - Uzbekistan (%)
Place of birth for the foreign-born population - Other South Central Asia (%)
Place of birth for the foreign-born population - Burma (%)
Place of birth for the foreign-born population - Cambodia (%)
Place of birth for the foreign-born population - Indonesia (%)
Place of birth for the foreign-born population - Laos (%)
Place of birth for the foreign-born population - Malaysia (%)
Place of birth for the foreign-born population - Philippines (%)
Place of birth for the foreign-born population - Singapore (%)
Place of birth for the foreign-born population - Thailand (%)
Place of birth for the foreign-born population - Vietnam (%)
Place of birth for the foreign-born population - Other South Eastern Asia (%)
Place of birth for the foreign-born population - Armenia (%)
Place of birth for the foreign-born population - Iraq (%)
Place of birth for the foreign-born population - Israel (%)
Place of birth for the foreign-born population - Jordan (%)
Place of birth for the foreign-born population - Kuwait (%)
Place of birth for the foreign-born population - Lebanon (%)
Place of birth for the foreign-born population - Saudi Arabia (%)
Place of birth for the foreign-born population - Syria (%)
Place of birth for the foreign-born population - Turkey (%)
Place of birth for the foreign-born population - Yemen (%)
Place of birth for the foreign-born population - Other Western Asia (%)
Place of birth for the foreign-born population - Eritrea (%)
Place of birth for the foreign-born population - Ethiopia (%)
Place of birth for the foreign-born population - Kenya (%)
Place of birth for the foreign-born population - Somalia (%)
Place of birth for the foreign-born population - Uganda (%)
Place of birth for the foreign-born population - Zimbabwe (%)
Place of birth for the foreign-born population - Other Eastern Africa (%)
Place of birth for the foreign-born population - Cameroon (%)
Place of birth for the foreign-born population - Congo (%)
Place of birth for the foreign-born population - Democratic Republic of Congo (Zaire) (%)
Place of birth for the foreign-born population - Other Middle Africa (%)
Place of birth for the foreign-born population - Egypt (%)
Place of birth for the foreign-born population - Morocco (%)
Place of birth for the foreign-born population - Sudan (%)
Place of birth for the foreign-born population - Other Northern Africa (%)
Place of birth for the foreign-born population - South Africa (%)
Place of birth for the foreign-born population - Other Southern Africa (%)
Place of birth for the foreign-born population - Cabo Verde (%)
Place of birth for the foreign-born population - Ghana (%)
Place of birth for the foreign-born population - Liberia (%)
Place of birth for the foreign-born population - Nigeria (%)
Place of birth for the foreign-born population - Senegal (%)
Place of birth for the foreign-born population - Sierra Leone (%)
Place of birth for the foreign-born population - Other Western Africa (%)
Place of birth for the foreign-born population - Australia (%)
Place of birth for the foreign-born population - New Zealand (%)
Place of birth for the foreign-born population - Fiji (%)
Place of birth for the foreign-born population - Micronesia (%)
Place of birth for the foreign-born population - Bahamas (%)
Place of birth for the foreign-born population - Barbados (%)
Place of birth for the foreign-born population - Cuba (%)
Place of birth for the foreign-born population - Dominica (%)
Place of birth for the foreign-born population - Dominican Republic (%)
Place of birth for the foreign-born population - Grenada (%)
Place of birth for the foreign-born population - Haiti (%)
Place of birth for the foreign-born population - Jamaica (%)
Place of birth for the foreign-born population - St. Vincent and the Grenadines (%)
Place of birth for the foreign-born population - Trinidad and Tobago (%)
Place of birth for the foreign-born population - West Indies (%)
Place of birth for the foreign-born population - Other Caribbean (%)
Place of birth for the foreign-born population - Belize (%)
Place of birth for the foreign-born population - Costa Rica (%)
Place of birth for the foreign-born population - El Salvador (%)
Place of birth for the foreign-born population - Guatemala (%)
Place of birth for the foreign-born population - Honduras (%)
Place of birth for the foreign-born population - Mexico (%)
Place of birth for the foreign-born population - Nicaragua (%)
Place of birth for the foreign-born population - Panama (%)
Place of birth for the foreign-born population - Other Central America (%)
Place of birth for the foreign-born population - Argentina (%)
Place of birth for the foreign-born population - Bolivia (%)
Place of birth for the foreign-born population - Brazil (%)
Place of birth for the foreign-born population - Chile (%)
Place of birth for the foreign-born population - Colombia (%)
Place of birth for the foreign-born population - Ecuador (%)
Place of birth for the foreign-born population - Guyana (%)
Place of birth for the foreign-born population - Peru (%)
Place of birth for the foreign-born population - Uruguay (%)
Place of birth for the foreign-born population - Venezuela (%)
Place of birth for the foreign-born population - Other South America (%)
Place of birth for the foreign-born population - Canada (%)
Place of birth for the foreign-born population - Other Northern America (%)
Place of birth for the foreign-born population - Other (%)
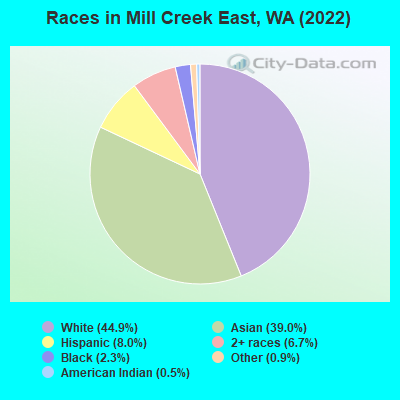
According to 2022 data, the most numerous races in Mill Creek East, WA are White alone (11,524 residents), Hispanic (2,052 residents), and Asian alone (10,001 residents). 60.6% of Mill Creek East residents speak English at home.
Race distribution in Mill Creek East 11,524 44.9% White alone 10,001 39.0% Asian alone 2,052 8.0% Hispanic 1,718 6.7% Two or more races 586 2.3% Black alone 222 0.9% Other race alone 130 0.5% American Indian alone
2000 2022
4,652,490 78.9% White alone 441,509 7.5% Hispanic 319,401 5.4% Asian alone 184,631 3.1% Black alone 175,926 3.0% Two or more races 85,396 1.4% American Indian alone 22,779 0.4% Native Hawaiian and Other 11,989 0.2% Other race alone
4,941,456 63.5% White alone 1,093,313 14.0% Hispanic 755,832 9.7% Asian alone 523,448 6.7% Two or more races 299,537 3.8% Black alone 69,024 0.9% American Indian alone 52,231 0.7% Native Hawaiian and Other 50,945 0.7% Other race alone
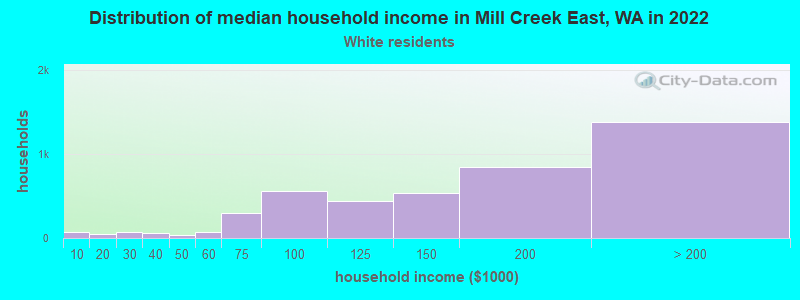
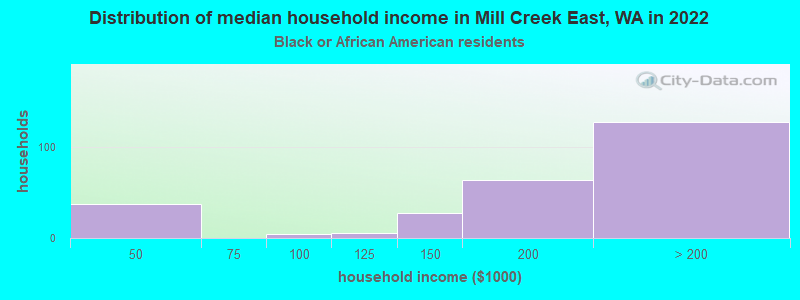
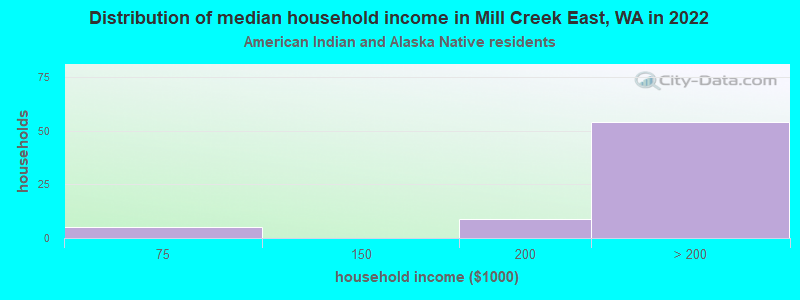
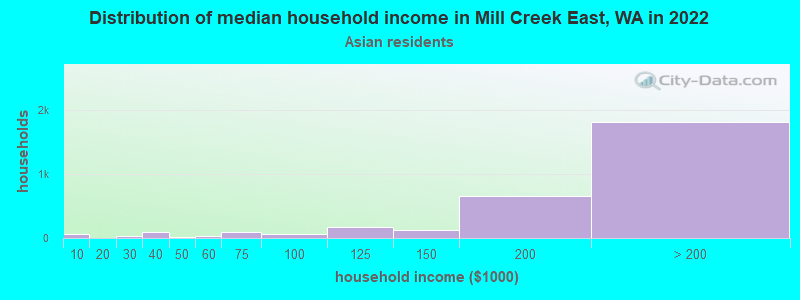
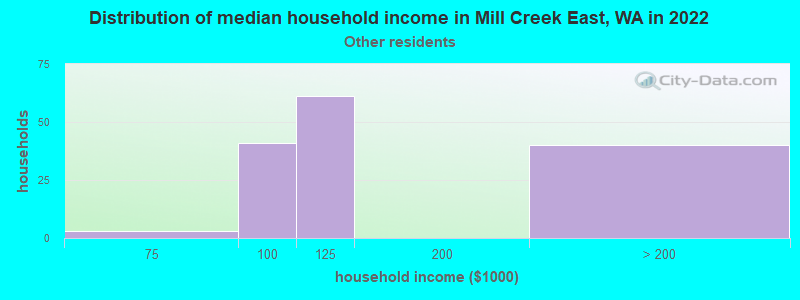
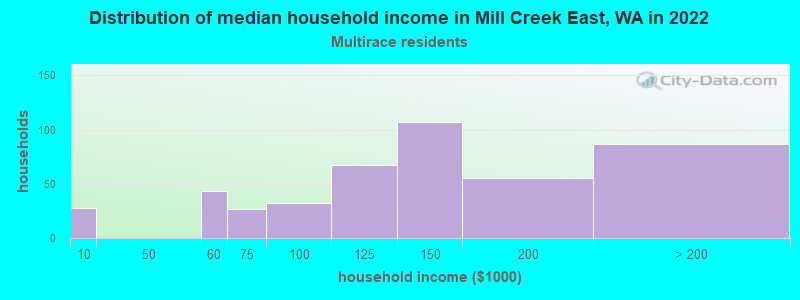
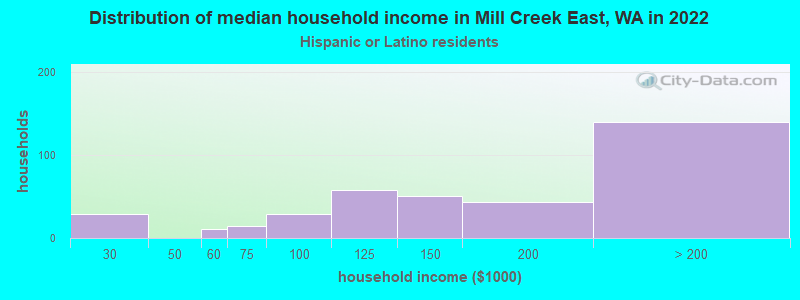
Income and house value in Mill Creek East Median household income in 2022 $144,259 White non-Hispanic householdersover $200,000 Black householdersover $200,000 American Indian and Alaska Native householders$199,298 Asian householders$96,316 Some other race householders$144,605 Two or more races householders$162,292 Hispanic or Latino race householders
Median age by race in Mill Creek East
40.7 Median age for White residents40.8 40.5 33.9 Median age for Black or African American residents34.3 32.7 23.9 Median age for American Indian / Alaska Native residents27.1 29.9 34.9 Median age for Asian residents36.4 34.1 -677,839,850.3 Median age for Native Hawaiian / Pacific Islander residents-661,202,185.1 -844,317,095.6 32.1 Median age for Other race residents29.1 43.5 22.7 Median age for Two or more races residents19.9 28.8 41.2 Median age for White alone residents41.6 40.8 29.1 Median age for Hispanic or Latino residents23.9 38.7
Owner/renter occupied households by race in Mill Creek East
House owners and renters - White residents 3,602 81.6% Owner occupied813 18.4% Renter occupiedHouse owners and renters - Black or African American residents 71 33.2% Owner occupied143 66.8% Renter occupiedHouse owners and renters - American Indian / Alaska Native residents 62 92.5% Owner occupied5 7.5% Renter occupiedHouse owners and renters - Asian residents 3,087 96.1% Owner occupied126 3.9% Renter occupiedHouse owners and renters - Other race residents 113 64.7% Owner occupied62 35.3% Renter occupiedHouse owners and renters - Two or more races residents 335 72.7% Owner occupied126 27.3% Renter occupiedHouse owners and renters - White alone residents 3,461 81.4% Owner occupied790 18.6% Renter occupiedHouse owners and renters - Hispanic or Latino residents 328 84.4% Owner occupied61 15.6% Renter occupied
Language usage in Mill Creek East
English speakers - Total 60.6% of residents of Mill Creek East speak English at home.
4.0% of residents speak Spanish at home 695 73.9% Speak English very well246 26.1% Speak English less than very well35.6% of residents speak other language at home 5,914 70.6% Speak English very well2,465 29.4% Speak English less than very well
English speakers - Born in the United States 86.9% of residents of Mill Creek East speak English at home.
3.6% of residents speak Spanish at home 212 90.2% Speak English very well23 9.8% Speak English less than very well9.3% of residents speak other language at home 571 93.9% Speak English very well37 6.1% Speak English less than very well
English speakers - Native, born elsewhere 94.3% of residents of Mill Creek East speak English at home.
5.7% of residents speak other language at home 14 100.0% Speak English very well
English speakers - Foreign-born 13.3% of residents of Mill Creek East speak English at home.
6.5% of residents speak Spanish at home 323 60.5% Speak English very well211 39.5% Speak English less than very well80.5% of residents speak other language at home 4,506 67.7% Speak English very well2,149 32.3% Speak English less than very well
White (Caucasian) - Speak only English Native:
95.5% (9,951)Foreign-born:
30.3% (317)
White (Caucasian) - Speak another language Native:
4.3% (449)Foreign-born:
69.6% (728)
Black or African American - Speak only English Native:
100.0% (443)Foreign-born:
53.4% (50)
Asian - Speak only English Native:
38.4% (843)Foreign-born:
9.1% (598)
Asian - Speak another language Native:
61.9% (1,360)Foreign-born:
90.3% (5,961)
Other race - Speak only English Native:
45.7% (112)Foreign-born:
9.5% (47)
Other race - Speak another language Native:
52.6% (129)Foreign-born:
90.3% (450)
Two or more races - Speak only English Native:
89.1% (1,734)Foreign-born:
30.0% (59)
Two or more races - Speak another language Native:
10.7% (209)Foreign-born:
72.3% (142)
White alone - Speak only English Native:
96.6% (9,603)Foreign-born:
30.6% (320)
White alone - Speak another language Native:
3.4% (338)Foreign-born:
69.5% (727)
Hispanic or Latino - Speak only English Native:
75.4% (896)Foreign-born:
6.0% (33)
Hispanic or Latino - Speak another language Native:
26.8% (318)Foreign-born:
93.7% (518)
Foreign-born residents in Mill Creek East
Marital status for residents in Mill Creek East Marital status - White (Caucasian) population 15 years and over
Males 24.2% Never married66.1% Now married0.3% Separated0.5% Widowed9.0% DivorcedFemales 22.4% Never married62.7% Now married0.4% Separated3.9% Widowed10.6% DivorcedWomen who gave birth in the past 12 months Now married:
82.2% (131)Unmarried:
17.8% (28)
Women who did not give birth in the past 12 months Now married:
61.0% (1,691)Unmarried:
39.0% (1,081)
Marital status - Black or African American population 15 years and over
Males 28.9% Never married47.5% Now married0.0% Separated0.4% Widowed23.2% DivorcedFemales 24.2% Never married48.9% Now married0.0% Separated3.8% Widowed23.1% DivorcedWomen who gave birth in the past 12 months Now married:
100.0% (50)Unmarried:
0.0% (0)
Women who did not give birth in the past 12 months Now married:
50.6% (52)Unmarried:
49.4% (50)
Marital status - American Indian / Alaska Native population 15 years and over
Males 67.2% Never married32.8% Now married0.0% Separated0.0% Widowed0.0% DivorcedFemales 60.0% Never married22.0% Now married0.0% Separated0.0% Widowed18.0% DivorcedWomen who did not give birth in the past 12 months Now married:
26.8% (16)Unmarried:
73.2% (43)
Marital status - Asian population 15 years and over
Males 10.0% Never married88.4% Now married0.0% Separated0.3% Widowed1.2% DivorcedFemales 14.5% Never married75.5% Now married1.8% Separated1.8% Widowed6.4% DivorcedWomen who gave birth in the past 12 months Now married:
100.0% (307)Unmarried:
0.0% (0)
Women who did not give birth in the past 12 months Now married:
77.5% (2,056)Unmarried:
22.5% (597)
Marital status - Other race population 15 years and over
Males 58.7% Never married25.7% Now married0.0% Separated3.1% Widowed12.5% DivorcedFemales 12.6% Never married85.9% Now married1.0% Separated0.0% Widowed0.5% DivorcedWomen who did not give birth in the past 12 months Now married:
74.7% (104)Unmarried:
25.3% (35)
Marital status - Two or more races population 15 years and over
Males 51.6% Never married44.2% Now married0.0% Separated0.0% Widowed4.2% DivorcedFemales 39.8% Never married49.6% Now married3.1% Separated0.0% Widowed7.5% DivorcedWomen who gave birth in the past 12 months Now married:
100.0% (53)Unmarried:
0.0% (0)
Women who did not give birth in the past 12 months Now married:
33.4% (144)Unmarried:
66.6% (286)
Marital status - White alone, not Hispanic / Latino population 15 years and over
Males 23.4% Never married67.1% Now married0.3% Separated0.5% Widowed8.7% DivorcedFemales 21.2% Never married63.1% Now married0.5% Separated4.1% Widowed11.1% DivorcedWomen who gave birth in the past 12 months Now married:
82.2% (133)Unmarried:
17.8% (29)
Women who did not give birth in the past 12 months Now married:
62.1% (1,642)Unmarried:
37.9% (1,001)
Marital status - Hispanic or Latino population 15 years and over
Males 40.5% Never married46.0% Now married0.0% Separated1.3% Widowed12.2% DivorcedFemales 25.8% Never married63.5% Now married3.0% Separated0.0% Widowed7.7% DivorcedWomen who gave birth in the past 12 months Now married:
100.0% (35)Unmarried:
0.0% (0)
Women who did not give birth in the past 12 months Now married:
55.2% (262)Unmarried:
44.8% (212)
Ancestries in Mill Creek East
584 4.6% European559 4.4% English539 4.2% German283 2.2% Irish272 2.1% American152 1.2% Egyptian146 1.2% Italian133 1.0% Norwegian127 1.0% Swedish126 1.0% Polish115 0.9% Palestinian105 0.8% Dutch90 0.7% Danish78 0.6% Iranian78 0.6% Portuguese74 0.6% Romanian73 0.6% Scottish64 0.5% Ghanaian51 0.4% Armenian49 0.4% Northern European48 0.4% Belgian40 0.3% Jordanian40 0.3% Ethiopian37 0.3% African34 0.3% Nigerian29 0.2% Russian27 0.2% French25 0.2% Finnish24 0.2% Welsh19 0.1% Eastern European15 0.1% French Canadian15 0.1% Greek14 0.1% Serbian12 0.09% Iraqi12 0.09% Syrian12 0.09% British12 0.09% Jamaican10 0.08% Scotch-Irish8 0.06% Lebanese8 0.06% Scandinavian7 0.06% Austrian5 0.04% Swiss
Geographical mobility in Mill Creek East Same house 1 year ago 10,624 88.1% White (Caucasian)333 60.1% Black or African American191 100.0% American Indian / Alaska Native8,195 85.3% Asian653 80.5% Other race2,119 90.4% Two or more races10,083 88.1% White alone, not Hispanic / Latino1,857 92.7% Hispanic or LatinoMoved within same county 357 3.0% White / Caucasian37 6.7% Black or African American170 1.8% Asian1 87.0% Native Hawaiian / Pacific Islander13 1.6% Other race110 4.7% Two or more races342 3.0% White alone, not Hispanic / Latino52 2.6% Hispanic or LatinoMoved within same state 652 5.4% White / Caucasian74 13.4% Black or African American490 5.1% Asian92 11.4% Other race79 3.4% Two or more races659 5.8% White alone, not Hispanic / Latino62 3.1% Hispanic or LatinoMoved from different state 493 4.1% White / Caucasian21 3.9% Black or African American267 2.8% Asian17 0.7% Two or more races412 3.6% White alone, not Hispanic / Latino43 2.2% Hispanic or LatinoMoved from abroad 79 0.7% White142 1.5% Asian50 6.1% Other race9 0.4% Two or more races81 0.7% White alone, not Hispanic / Latino18 0.9% Hispanic or Latino
Children Nativity (place of birth) in Mill Creek East
Children under 6 years - Living with two parents Both parents native 870 100.0% NativeBoth parents foreign-born 1,521 96.9% Native48 3.1% Foreign-bornOne native, one foreign-born parent 371 100.0% NativeChildren under 6 years - Living with one parent Native parent 32 100.0% NativeChildren 6 to 17 years - Living with two parents Both parents native 1,839 100.0% NativeBoth parents foreign-born 1,297 71.4% Native520 28.6% Foreign-bornOne native, one foreign-born parent 373 98.9% Native4 1.1% Foreign-bornChildren 6 to 17 years - Living with one parent Native parent 524 100.0% NativeForeign-born parent 134 52.9% Native119 47.1% Foreign-born
Grandparents responsible for own grandchildren in Mill Creek East
Grandparents (30 to 59 years) White / Caucasian 8 18.8% Responsible for grandchildren32 81.2% Not responsible for grandchildrenOther race 9 100.0% Not responsible for grandchildrenWhite alone, not Hispanic / Latino 8 19.0% Responsible for grandchildren34 81.0% Not responsible for grandchildrenGrandparents (60 years and over) White / Caucasian 5 6.6% Responsible for grandchildren66 93.4% Not responsible for grandchildrenOther race 1 98.5% Not responsible for grandchildrenWhite alone, not Hispanic / Latino 5 6.4% Responsible for grandchildren69 93.6% Not responsible for grandchildren