Races in Monroe, Washington (WA) Detailed Stats
Data:
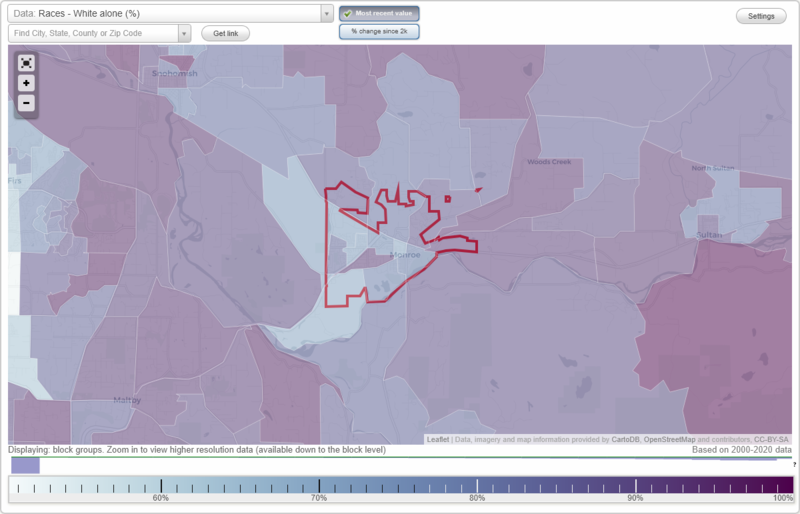
Races - White alone (%)
Races - White alone (% change since 2000)
Races - Black alone (%)
Races - Black alone (% change since 2000)
Races - American Indian alone (%)
Races - American Indian alone (% change since 2000)
Races - Asian alone (%)
Races - Asian alone (% change since 2000)
Races - Hispanic (%)
Races - Hispanic (% change since 2000)
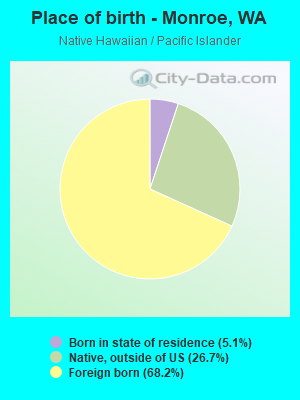
Races - Native Hawaiian and Other Pacific Islander alone (%)
Races - Native Hawaiian and Other Pacific Islander alone (% change since 2000)
Races - Two or more races(%)
Races - Two or more races(% change since 2000)
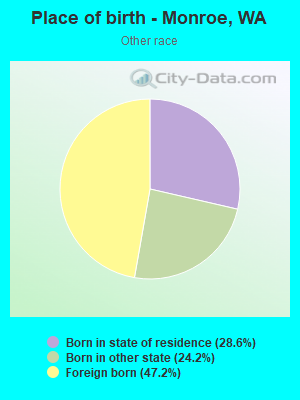
Races - Other race alone (%)
Races - Other race alone (% change since 2000)
Racial diversity
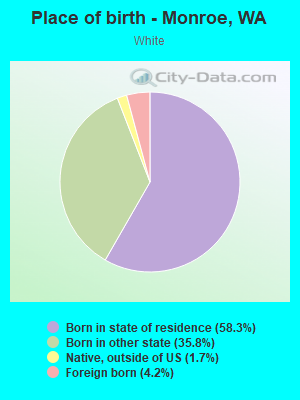
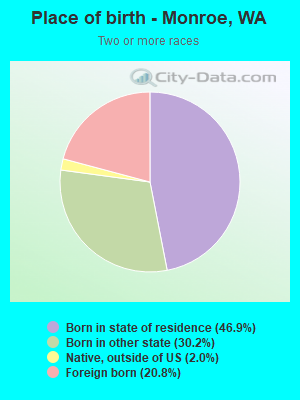
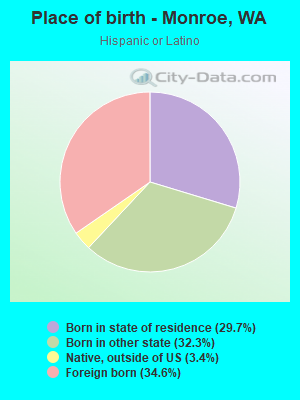
Place of birth - Born in state of residence (%)
Place of birth - Born in state of residence (%) - White
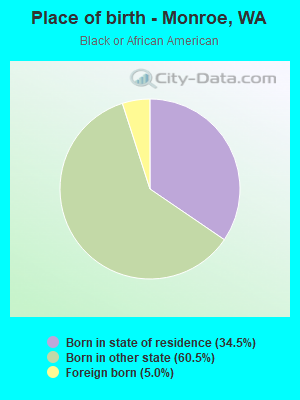
Place of birth - Born in state of residence (%) - Black or African American
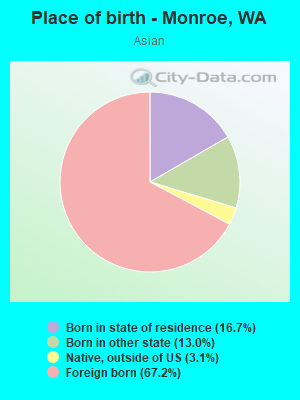
Place of birth - Born in state of residence (%) - Asian
Place of birth - Born in state of residence (%) - Hispanic or Latino
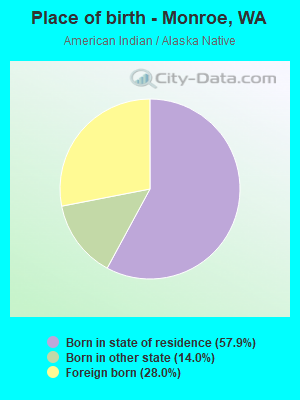
Place of birth - Born in state of residence (%) - American Indian and Alaska Native
Place of birth - Born in state of residence (%) - Multirace
Place of birth - Born in state of residence (%) - Other Race
Place of birth - Born in other state (%)
Place of birth - Born in other state (%) - White
Place of birth - Born in other state (%) - Black or African American
Place of birth - Born in other state (%) - Asian
Place of birth - Born in other state (%) - Hispanic or Latino
Place of birth - Born in other state (%) - American Indian and Alaska Native
Place of birth - Born in other state (%) - Multirace
Place of birth - Born in other state (%) - Other Race
Place of birth - Native, outside of US (%)
Place of birth - Native, outside of US (%) - White
Place of birth - Native, outside of US (%) - Black or African American
Place of birth - Native, outside of US (%) - Asian
Place of birth - Native, outside of US (%) - Hispanic or Latino
Place of birth - Native, outside of US (%) - American Indian and Alaska Native
Place of birth - Native, outside of US (%) - Multirace
Place of birth - Native, outside of US (%) - Other Race
Place of birth - Foreign born (%)
Place of birth - Foreign born (%) - White
Place of birth - Foreign born (%) - Black or African American
Place of birth - Foreign born (%) - Asian
Place of birth - Foreign born (%) - Hispanic or Latino
Place of birth - Foreign born (%) - American Indian and Alaska Native
Place of birth - Foreign born (%) - Multirace
Place of birth - Foreign born (%) - Other Race
Residents speaking English at home (%)
Residents speaking English at home - Born in the United States (%)
Residents speaking English at home - Native, born elsewhere (%)
Residents speaking English at home - Foreign born (%)
Residents speaking Spanish at home (%)
Residents speaking Spanish at home - Born in the United States (%)
Residents speaking Spanish at home - Native, born elsewhere (%)
Residents speaking Spanish at home - Foreign born (%)
Residents speaking other language at home (%)
Residents speaking other language at home - Born in the United States (%)
Residents speaking other language at home - Native, born elsewhere (%)
Residents speaking other language at home - Foreign born (%)
Marital status - Never married (%)
Marital status - Now married (%)
Marital status - Separated (%)
Marital status - Widowed (%)
Marital status - Divorced (%)
Ancestries Reported - Arab (%)
Ancestries Reported - Czech (%)
Ancestries Reported - Danish (%)
Ancestries Reported - Dutch (%)
Ancestries Reported - English (%)
Ancestries Reported - French (%)
Ancestries Reported - French Canadian (%)
Ancestries Reported - German (%)
Ancestries Reported - Greek (%)
Ancestries Reported - Hungarian (%)
Ancestries Reported - Irish (%)
Ancestries Reported - Italian (%)
Ancestries Reported - Lithuanian (%)
Ancestries Reported - Norwegian (%)
Ancestries Reported - Polish (%)
Ancestries Reported - Portuguese (%)
Ancestries Reported - Russian (%)
Ancestries Reported - Scotch-Irish (%)
Ancestries Reported - Scottish (%)
Ancestries Reported - Slovak (%)
Ancestries Reported - Subsaharan African (%)
Ancestries Reported - Swedish (%)
Ancestries Reported - Swiss (%)
Ancestries Reported - Ukrainian (%)
Ancestries Reported - United States (%)
Ancestries Reported - Welsh (%)
Ancestries Reported - West Indian (%)
Ancestries Reported - Other (%)
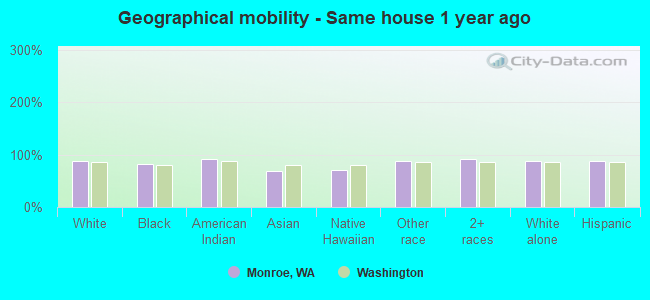
Geographical mobility - Same house 1 year ago (%)
Geographical mobility - Same house 1 year ago (%) - White
Geographical mobility - Same house 1 year ago (%) - Black or African American
Geographical mobility - Same house 1 year ago (%) - Asian
Geographical mobility - Same house 1 year ago (%) - Hispanic or Latino
Geographical mobility - Same house 1 year ago (%) - American Indian and Alaska Native
Geographical mobility - Same house 1 year ago (%) - Multirace
Geographical mobility - Same house 1 year ago (%) - Other Race
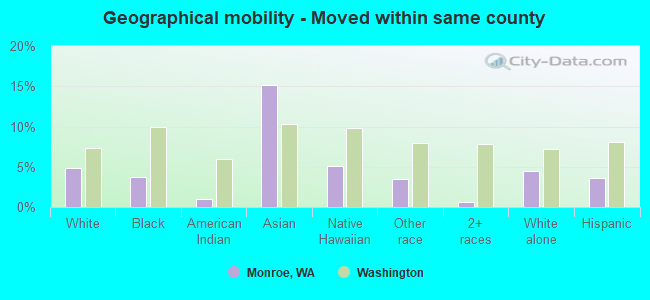
Geographical mobility - Moved within same county (%)
Geographical mobility - Moved within same county (%) - White
Geographical mobility - Moved within same county (%) - Black or African American
Geographical mobility - Moved within same county (%) - Asian
Geographical mobility - Moved within same county (%) - Hispanic or Latino
Geographical mobility - Moved within same county (%) - American Indian and Alaska Native
Geographical mobility - Moved within same county (%) - Multirace
Geographical mobility - Moved within same county (%) - Other Race
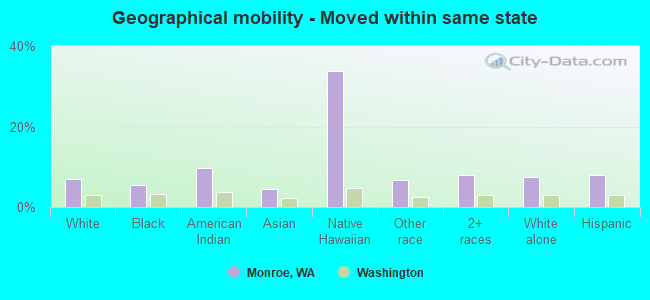
Geographical mobility - Moved from different county within same state (%)
Geographical mobility - Moved from different county within same state (%) - White
Geographical mobility - Moved from different county within same state (%) - Black or African American
Geographical mobility - Moved from different county within same state (%) - Asian
Geographical mobility - Moved from different county within same state (%) - Hispanic or Latino
Geographical mobility - Moved from different county within same state (%) - American Indian and Alaska Native
Geographical mobility - Moved from different county within same state (%) - Multirace
Geographical mobility - Moved from different county within same state (%) - Other Race
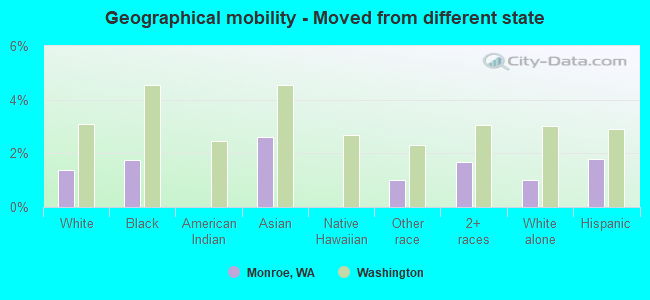
Geographical mobility - Moved from different state (%)
Geographical mobility - Moved from different state (%) - White
Geographical mobility - Moved from different state (%) - Black or African American
Geographical mobility - Moved from different state (%) - Asian
Geographical mobility - Moved from different state (%) - Hispanic or Latino
Geographical mobility - Moved from different state (%) - American Indian and Alaska Native
Geographical mobility - Moved from different state (%) - Multirace
Geographical mobility - Moved from different state (%) - Other Race
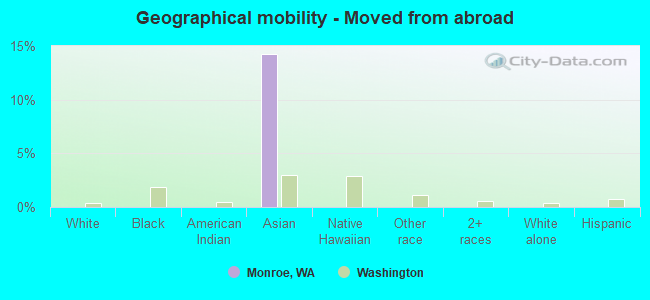
Geographical mobility - Moved from abroad (%)
Geographical mobility - Moved from abroad (%) - White
Geographical mobility - Moved from abroad (%) - Black or African American
Geographical mobility - Moved from abroad (%) - Asian
Geographical mobility - Moved from abroad (%) - Hispanic or Latino
Geographical mobility - Moved from abroad (%) - American Indian and Alaska Native
Geographical mobility - Moved from abroad (%) - Multirace
Geographical mobility - Moved from abroad (%) - Other Race
Place of birth for the foreign-born population - Ireland (%)
Place of birth for the foreign-born population - Denmark (%)
Place of birth for the foreign-born population - Norway (%)
Place of birth for the foreign-born population - Sweden (%)
Place of birth for the foreign-born population - United Kingdom (%)
Place of birth for the foreign-born population - England (%)
Place of birth for the foreign-born population - Scotland (%)
Place of birth for the foreign-born population - Other Northern Europe (%)
Place of birth for the foreign-born population - Austria (%)
Place of birth for the foreign-born population - Belgium (%)
Place of birth for the foreign-born population - France (%)
Place of birth for the foreign-born population - Germany (%)
Place of birth for the foreign-born population - Netherlands (%)
Place of birth for the foreign-born population - Switzerland (%)
Place of birth for the foreign-born population - Other Western Europe (%)
Place of birth for the foreign-born population - Greece (%)
Place of birth for the foreign-born population - Italy (%)
Place of birth for the foreign-born population - Portugal (%)
Place of birth for the foreign-born population - Spain (%)
Place of birth for the foreign-born population - Other Southern Europe (%)
Place of birth for the foreign-born population - Albania (%)
Place of birth for the foreign-born population - Belarus (%)
Place of birth for the foreign-born population - Bosnia and Herzegovina (%)
Place of birth for the foreign-born population - Bulgaria (%)
Place of birth for the foreign-born population - Croatia (%)
Place of birth for the foreign-born population - Czechoslovakia (%)
Place of birth for the foreign-born population - Hungary (%)
Place of birth for the foreign-born population - Latvia (%)
Place of birth for the foreign-born population - Lithuania (%)
Place of birth for the foreign-born population - North Macedonia (Macedonia) (%)
Place of birth for the foreign-born population - Moldova (%)
Place of birth for the foreign-born population - Poland (%)
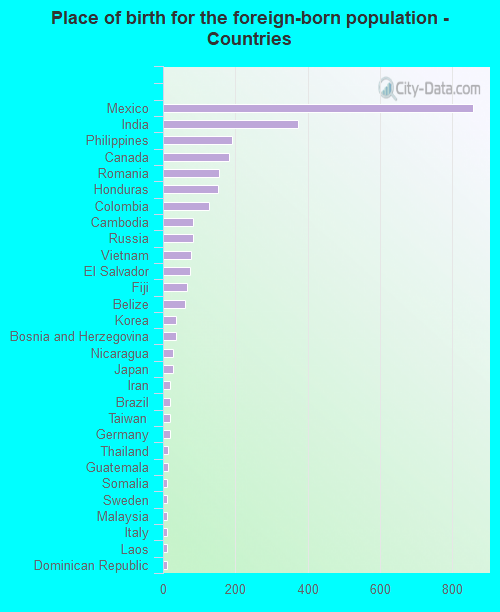
Place of birth for the foreign-born population - Romania (%)
Place of birth for the foreign-born population - Russia (%)
Place of birth for the foreign-born population - Serbia (%)
Place of birth for the foreign-born population - Ukraine (%)
Place of birth for the foreign-born population - Other Eastern Europe (%)
Place of birth for the foreign-born population - China (%)
Place of birth for the foreign-born population - Hong Kong (%)
Place of birth for the foreign-born population - Taiwan (%)
Place of birth for the foreign-born population - Japan (%)
Place of birth for the foreign-born population - Korea (%)
Place of birth for the foreign-born population - Other Eastern Asia (%)
Place of birth for the foreign-born population - Afghanistan (%)
Place of birth for the foreign-born population - Bangladesh (%)
Place of birth for the foreign-born population - India (%)
Place of birth for the foreign-born population - Iran (%)
Place of birth for the foreign-born population - Kazakhstan (%)
Place of birth for the foreign-born population - Nepal (%)
Place of birth for the foreign-born population - Pakistan (%)
Place of birth for the foreign-born population - Sri Lanka (%)
Place of birth for the foreign-born population - Uzbekistan (%)
Place of birth for the foreign-born population - Other South Central Asia (%)
Place of birth for the foreign-born population - Burma (%)
Place of birth for the foreign-born population - Cambodia (%)
Place of birth for the foreign-born population - Indonesia (%)
Place of birth for the foreign-born population - Laos (%)
Place of birth for the foreign-born population - Malaysia (%)
Place of birth for the foreign-born population - Philippines (%)
Place of birth for the foreign-born population - Singapore (%)
Place of birth for the foreign-born population - Thailand (%)
Place of birth for the foreign-born population - Vietnam (%)
Place of birth for the foreign-born population - Other South Eastern Asia (%)
Place of birth for the foreign-born population - Armenia (%)
Place of birth for the foreign-born population - Iraq (%)
Place of birth for the foreign-born population - Israel (%)
Place of birth for the foreign-born population - Jordan (%)
Place of birth for the foreign-born population - Kuwait (%)
Place of birth for the foreign-born population - Lebanon (%)
Place of birth for the foreign-born population - Saudi Arabia (%)
Place of birth for the foreign-born population - Syria (%)
Place of birth for the foreign-born population - Turkey (%)
Place of birth for the foreign-born population - Yemen (%)
Place of birth for the foreign-born population - Other Western Asia (%)
Place of birth for the foreign-born population - Eritrea (%)
Place of birth for the foreign-born population - Ethiopia (%)
Place of birth for the foreign-born population - Kenya (%)
Place of birth for the foreign-born population - Somalia (%)
Place of birth for the foreign-born population - Uganda (%)
Place of birth for the foreign-born population - Zimbabwe (%)
Place of birth for the foreign-born population - Other Eastern Africa (%)
Place of birth for the foreign-born population - Cameroon (%)
Place of birth for the foreign-born population - Congo (%)
Place of birth for the foreign-born population - Democratic Republic of Congo (Zaire) (%)
Place of birth for the foreign-born population - Other Middle Africa (%)
Place of birth for the foreign-born population - Egypt (%)
Place of birth for the foreign-born population - Morocco (%)
Place of birth for the foreign-born population - Sudan (%)
Place of birth for the foreign-born population - Other Northern Africa (%)
Place of birth for the foreign-born population - South Africa (%)
Place of birth for the foreign-born population - Other Southern Africa (%)
Place of birth for the foreign-born population - Cabo Verde (%)
Place of birth for the foreign-born population - Ghana (%)
Place of birth for the foreign-born population - Liberia (%)
Place of birth for the foreign-born population - Nigeria (%)
Place of birth for the foreign-born population - Senegal (%)
Place of birth for the foreign-born population - Sierra Leone (%)
Place of birth for the foreign-born population - Other Western Africa (%)
Place of birth for the foreign-born population - Australia (%)
Place of birth for the foreign-born population - New Zealand (%)
Place of birth for the foreign-born population - Fiji (%)
Place of birth for the foreign-born population - Micronesia (%)
Place of birth for the foreign-born population - Bahamas (%)
Place of birth for the foreign-born population - Barbados (%)
Place of birth for the foreign-born population - Cuba (%)
Place of birth for the foreign-born population - Dominica (%)
Place of birth for the foreign-born population - Dominican Republic (%)
Place of birth for the foreign-born population - Grenada (%)
Place of birth for the foreign-born population - Haiti (%)
Place of birth for the foreign-born population - Jamaica (%)
Place of birth for the foreign-born population - St. Vincent and the Grenadines (%)
Place of birth for the foreign-born population - Trinidad and Tobago (%)
Place of birth for the foreign-born population - West Indies (%)
Place of birth for the foreign-born population - Other Caribbean (%)
Place of birth for the foreign-born population - Belize (%)
Place of birth for the foreign-born population - Costa Rica (%)
Place of birth for the foreign-born population - El Salvador (%)
Place of birth for the foreign-born population - Guatemala (%)
Place of birth for the foreign-born population - Honduras (%)
Place of birth for the foreign-born population - Mexico (%)
Place of birth for the foreign-born population - Nicaragua (%)
Place of birth for the foreign-born population - Panama (%)
Place of birth for the foreign-born population - Other Central America (%)
Place of birth for the foreign-born population - Argentina (%)
Place of birth for the foreign-born population - Bolivia (%)
Place of birth for the foreign-born population - Brazil (%)
Place of birth for the foreign-born population - Chile (%)
Place of birth for the foreign-born population - Colombia (%)
Place of birth for the foreign-born population - Ecuador (%)
Place of birth for the foreign-born population - Guyana (%)
Place of birth for the foreign-born population - Peru (%)
Place of birth for the foreign-born population - Uruguay (%)
Place of birth for the foreign-born population - Venezuela (%)
Place of birth for the foreign-born population - Other South America (%)
Place of birth for the foreign-born population - Canada (%)
Place of birth for the foreign-born population - Other Northern America (%)
Place of birth for the foreign-born population - Other (%)
Latest news about races in Monroe, WA collected exclusively by city-data.com from local newspapers, TV, and radio stations
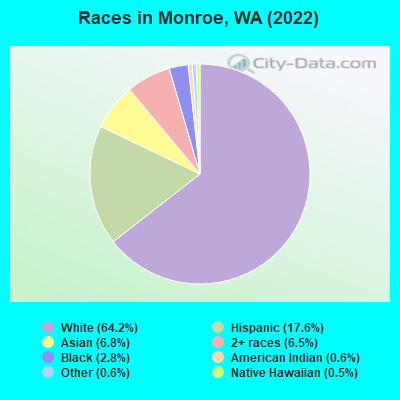
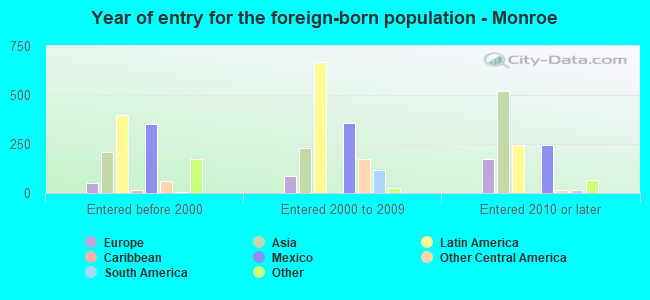
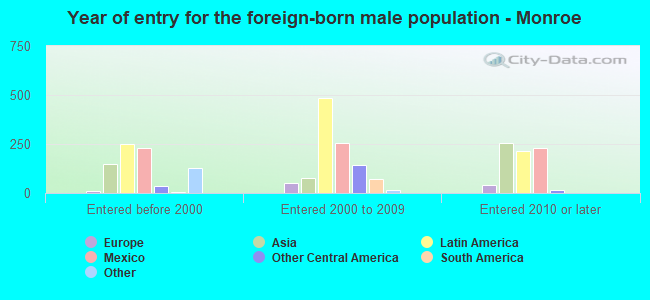
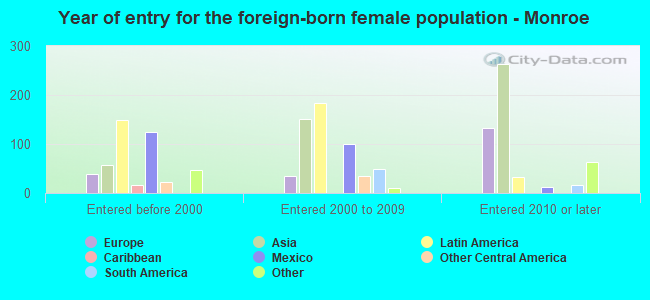
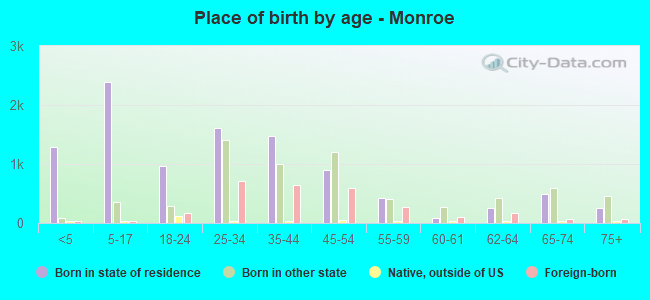
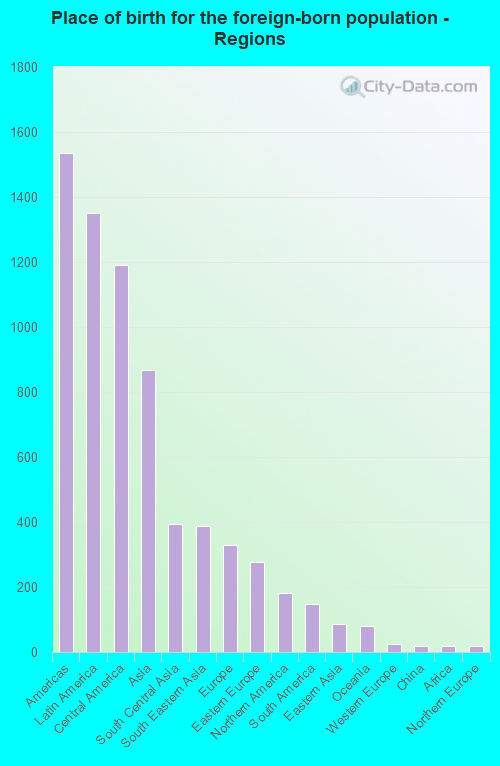
According to 2022 data, the most numerous races in Monroe, WA are White alone (12,784 residents), Hispanic (3,503 residents), and Asian alone (1,353 residents). 80.6% of Monroe residents speak English at home. 14.2% of Monroe, WA residents are foreign-born (6.6% born in Latin America, 4.3% born in Asia, 1.6% born in Europe), which is 5.5% less than the foreign-born rate of 15.0% across the entire state of Washington.
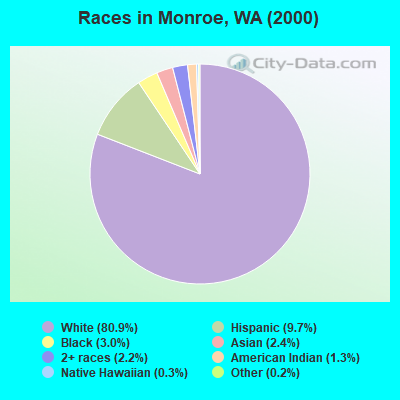
Race distribution in Monroe
2000 2022
4,652,490 78.9% White alone 441,509 7.5% Hispanic 319,401 5.4% Asian alone 184,631 3.1% Black alone 175,926 3.0% Two or more races 85,396 1.4% American Indian alone 22,779 0.4% Native Hawaiian and Other 11,989 0.2% Other race alone
4,941,456 63.5% White alone 1,093,313 14.0% Hispanic 755,832 9.7% Asian alone 523,448 6.7% Two or more races 299,537 3.8% Black alone 69,024 0.9% American Indian alone 52,231 0.7% Native Hawaiian and Other 50,945 0.7% Other race alone
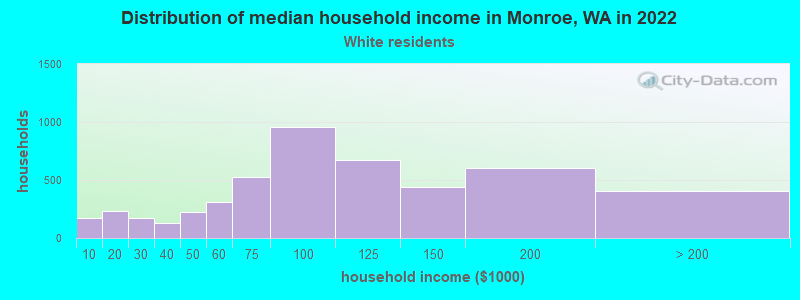
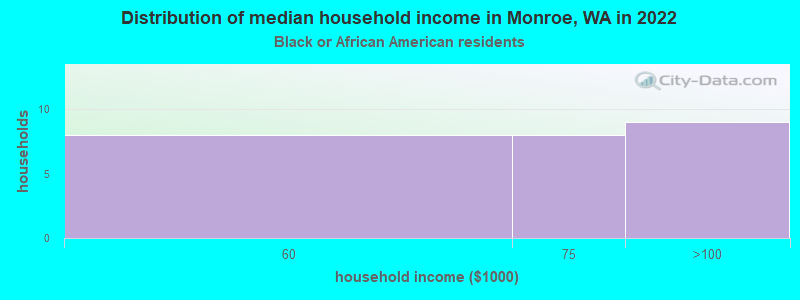
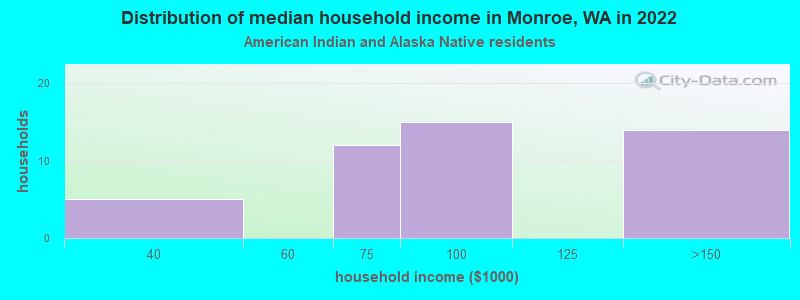
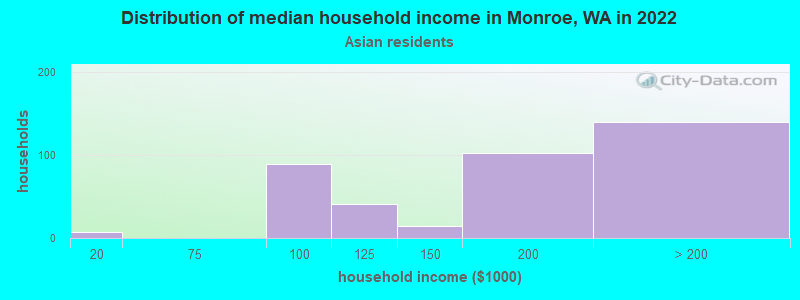
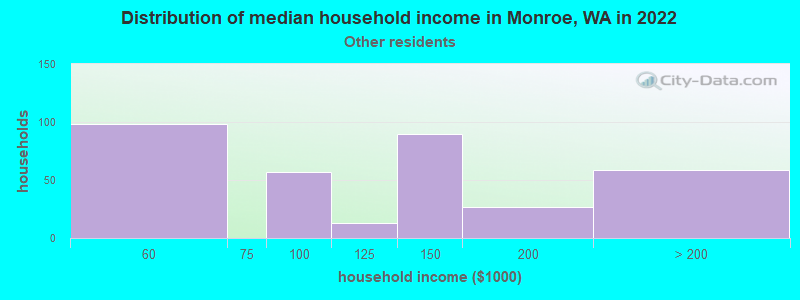
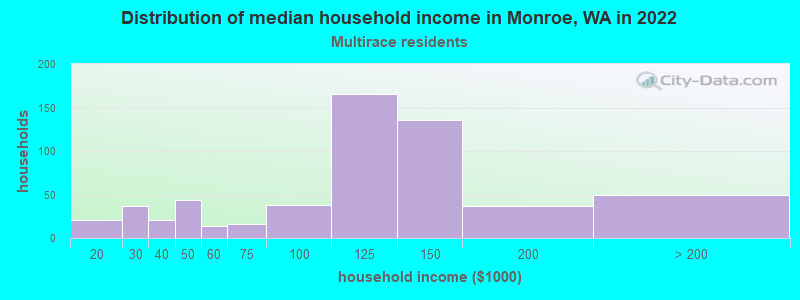
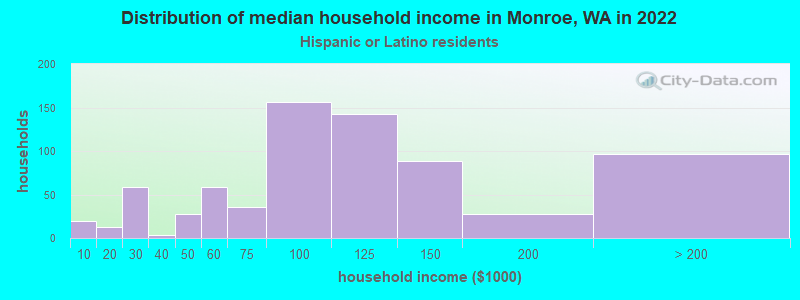
Income and house value in Monroe Median household income in 2022 $91,178 White non-Hispanic householders$73,605 Black householders$109,960 American Indian and Alaska Native householders$153,876 Asian householders$127,367 Some other race householders$110,306 Two or more races householders$95,892 Hispanic or Latino race householdersMedian 2022 house value $618,303 White Non-Hispanic householders$641,926 American Indian or Alaska Native householders $656,305 Asian householders$641,926 Some other race householders$637,817 Two or more races householders$641,926 Hispanic or Latino householders
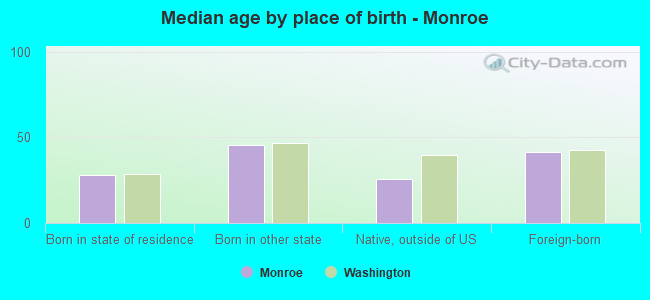
Median age by race in Monroe
37.9 Median age for White residents37.7 38.2 32.7 Median age for Black or African American residents31.4 14.7 54.2 Median age for American Indian / Alaska Native residents62.1 24.4 37.1 Median age for Asian residents36.8 38.3 53.1 Median age for Native Hawaiian / Pacific Islander residents29.5 -844,317,095.6 33.5 Median age for Other race residents33.9 31.1 35.5 Median age for Two or more races residents37.5 32.0 38.7 Median age for White alone residents38.9 38.3 31.0 Median age for Hispanic or Latino residents32.8 26.1
Owner/renter occupied households by race in Monroe
House owners and renters - White residents 3,305 68.2% Owner occupied1,543 31.8% Renter occupiedHouse owners and renters - Black or African American residents 10 33.1% Owner occupied20 66.9% Renter occupiedHouse owners and renters - American Indian / Alaska Native residents 17 42.4% Owner occupied24 57.6% Renter occupiedHouse owners and renters - Asian residents 404 98.7% Owner occupied5 1.3% Renter occupiedHouse owners and renters - Other race residents 231 74.5% Owner occupied79 25.5% Renter occupiedHouse owners and renters - Two or more races residents 290 52.2% Owner occupied265 47.8% Renter occupiedHouse owners and renters - White alone residents 3,288 70.4% Owner occupied1,384 29.6% Renter occupiedHouse owners and renters - Hispanic or Latino residents 303 41.8% Owner occupied423 58.2% Renter occupied
Language usage in Monroe
English speakers - Total 80.6% of residents of Monroe speak English at home.
11.4% of residents speak Spanish at home 1,203 57.1% Speak English very well903 42.9% Speak English less than very well7.7% of residents speak other language at home 956 67.4% Speak English very well462 32.6% Speak English less than very well
English speakers - Born in the United States 93.7% of residents of Monroe speak English at home.
4.2% of residents speak Spanish at home 262 97.8% Speak English very well6 2.2% Speak English less than very well2.1% of residents speak other language at home 134 100.0% Speak English very well
English speakers - Native, born elsewhere 49.7% of residents of Monroe speak English at home.
47.7% of residents speak Spanish at home 123 74.5% Speak English very well42 25.5% Speak English less than very well9.8% of residents speak other language at home 34 100.0% Speak English very well
English speakers - Foreign-born 16.5% of residents of Monroe speak English at home.
40.8% of residents speak Spanish at home 434 37.6% Speak English very well721 62.4% Speak English less than very well41.3% of residents speak other language at home 722 61.8% Speak English very well447 38.2% Speak English less than very well
White (Caucasian) - Speak only English Native:
96.2% (11,646)Foreign-born:
23.7% (129)
White (Caucasian) - Speak another language Native:
3.8% (456)Foreign-born:
75.9% (414)
Black or African American - Speak only English Native:
100.0% (528)Foreign-born:
82.3% (24)
Black or African American - Speak another language Native:
2.1% (11)Foreign-born:
47.0% (14)
American Indian / Alaska Native - Speak another language Native:
3.9% (6)Foreign-born:
100.0% (55)
Asian - Speak only English Native:
65.4% (249)Foreign-born:
13.3% (122)
Asian - Speak another language Native:
34.4% (131)Foreign-born:
86.6% (790)
Native Hawaiian / Pacific Islander - Speak only English Native:
57.0% (17)Foreign-born:
18.5% (15)
Other race - Speak only English Native:
28.1% (223)Foreign-born:
4.7% (37)
Other race - Speak another language Native:
73.1% (580)Foreign-born:
93.3% (741)
Two or more races - Speak only English Native:
93.4% (1,531)Foreign-born:
26.4% (133)
Two or more races - Speak another language Native:
7.0% (114)Foreign-born:
75.2% (379)
White alone - Speak only English Native:
98.7% (11,348)Foreign-born:
31.0% (130)
White alone - Speak another language Native:
1.4% (160)Foreign-born:
69.0% (290)
Hispanic or Latino - Speak only English Native:
54.9% (1,105)Foreign-born:
9.6% (116)
Hispanic or Latino - Speak another language Native:
43.8% (881)Foreign-born:
90.4% (1,097)
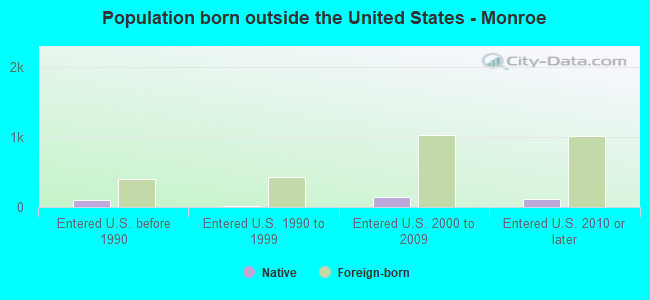
Foreign-born residents in Monroe 2,832 residents are foreign born (6.6% Latin America , 4.3% Asia , 1.6% Europe ).
This city:
14.2%Washington:
14.9%
Marital status for residents in Monroe Marital status - White (Caucasian) population 15 years and over
Males 38.9% Never married46.0% Now married1.8% Separated1.1% Widowed12.2% DivorcedFemales 23.2% Never married51.9% Now married0.4% Separated8.0% Widowed16.4% DivorcedWomen who gave birth in the past 12 months Now married:
55.3% (107)Unmarried:
44.7% (86)
Women who did not give birth in the past 12 months Now married:
57.4% (1,652)Unmarried:
42.6% (1,225)
Marital status - Black or African American population 15 years and over
Males 65.1% Never married22.9% Now married0.0% Separated2.5% Widowed9.5% DivorcedFemales 54.5% Never married45.5% Now married0.0% Separated0.0% Widowed0.0% DivorcedWomen who did not give birth in the past 12 months Now married:
45.5% (11)Unmarried:
54.5% (14)
Marital status - American Indian / Alaska Native population 15 years and over
Males 55.7% Never married17.2% Now married7.5% Separated8.6% Widowed10.9% DivorcedFemales 0.0% Never married40.0% Now married10.0% Separated0.0% Widowed50.0% DivorcedWomen who did not give birth in the past 12 months Now married:
50.0% (7)Unmarried:
50.0% (7)
Marital status - Asian population 15 years and over
Males 19.4% Never married74.2% Now married1.0% Separated1.0% Widowed4.4% DivorcedFemales 15.4% Never married74.0% Now married0.0% Separated2.9% Widowed7.8% DivorcedWomen who did not give birth in the past 12 months Now married:
72.1% (289)Unmarried:
27.9% (112)
Marital status - Native Hawaiian / Pacific Islander population 15 years and over
Males 14.3% Never married21.4% Now married0.0% Separated0.0% Widowed64.3% DivorcedFemales 0.0% Never married31.7% Now married0.0% Separated68.3% Widowed0.0% DivorcedMarital status - Other race population 15 years and over
Males 37.8% Never married41.7% Now married17.2% Separated0.0% Widowed3.4% DivorcedFemales 37.0% Never married59.8% Now married0.0% Separated1.9% Widowed1.3% DivorcedWomen who gave birth in the past 12 months Now married:
0.0% (0)Unmarried:
100.0% (32)
Women who did not give birth in the past 12 months Now married:
48.0% (120)Unmarried:
52.0% (130)
Marital status - Two or more races population 15 years and over
Males 39.1% Never married44.4% Now married0.6% Separated2.7% Widowed13.2% DivorcedFemales 42.9% Never married40.0% Now married4.0% Separated0.7% Widowed12.4% DivorcedWomen who gave birth in the past 12 months Now married:
100.0% (11)Unmarried:
0.0% (0)
Women who did not give birth in the past 12 months Now married:
35.6% (166)Unmarried:
64.4% (300)
Marital status - White alone, not Hispanic / Latino population 15 years and over
Males 35.6% Never married48.0% Now married2.0% Separated1.2% Widowed13.2% DivorcedFemales 22.4% Never married51.7% Now married0.5% Separated8.5% Widowed16.9% DivorcedWomen who gave birth in the past 12 months Now married:
55.3% (109)Unmarried:
44.7% (88)
Women who did not give birth in the past 12 months Now married:
57.5% (1,534)Unmarried:
42.5% (1,135)
Marital status - Hispanic or Latino population 15 years and over
Males 46.3% Never married38.0% Now married7.7% Separated0.0% Widowed8.0% DivorcedFemales 37.7% Never married54.1% Now married2.8% Separated0.8% Widowed4.6% DivorcedWomen who gave birth in the past 12 months Now married:
0.0% (0)Unmarried:
100.0% (25)
Women who did not give birth in the past 12 months Now married:
55.3% (377)Unmarried:
44.7% (306)
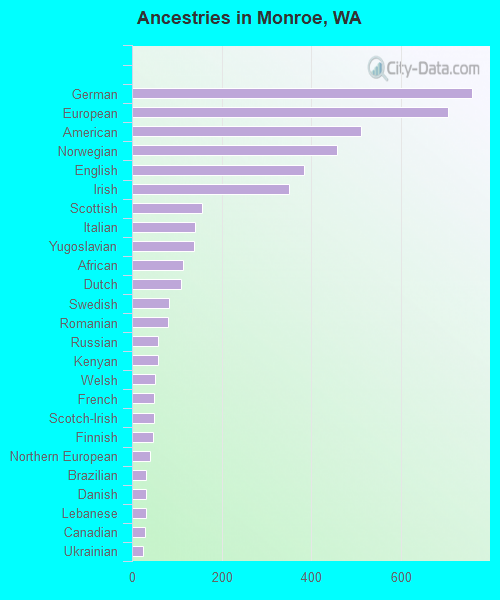
Ancestries in Monroe
758 9.0% German704 8.3% European510 6.0% American457 5.4% Norwegian384 4.5% English351 4.1% Irish157 1.9% Scottish140 1.7% Italian138 1.6% Yugoslavian113 1.3% African109 1.3% Dutch82 1.0% Swedish81 1.0% Romanian59 0.7% Russian58 0.7% Kenyan51 0.6% Welsh50 0.6% French48 0.6% Scotch-Irish46 0.5% Finnish41 0.5% Northern European32 0.4% Brazilian32 0.4% Danish31 0.4% Lebanese29 0.3% Canadian25 0.3% Ukrainian19 0.2% British18 0.2% Turkish15 0.2% Scandinavian12 0.1% Eastern European11 0.1% Polish11 0.1% Swiss9 0.1% Portuguese7 0.08% Czech6 0.07% Estonian3 0.04% Greek3 0.04% Pennsylvania German
Children Nativity (place of birth) in Monroe
Children under 6 years - Living with two parents Both parents native 816 100.0% NativeBoth parents foreign-born 124 100.0% NativeOne native, one foreign-born parent 92 100.0% NativeChildren under 6 years - Living with one parent Native parent 283 100.0% NativeForeign-born parent 41 100.0% NativeChildren 6 to 17 years - Living with two parents Both parents native 1,340 100.0% NativeBoth parents foreign-born 325 89.7% Native37 10.3% Foreign-bornOne native, one foreign-born parent 322 100.0% NativeChildren 6 to 17 years - Living with one parent Native parent 557 100.0% NativeForeign-born parent 94 49.1% Native97 50.9% Foreign-born
Grandparents responsible for own grandchildren in Monroe
Grandparents (30 to 59 years) White / Caucasian 16 8.7% Responsible for grandchildren163 91.3% Not responsible for grandchildrenOther race 45 100.0% Not responsible for grandchildrenTwo or more races 31 100.0% Responsible for grandchildrenWhite alone, not Hispanic / Latino 17 17.3% Responsible for grandchildren79 82.7% Not responsible for grandchildrenHispanic or Latino 100 100.0% Not responsible for grandchildrenGrandparents (60 years and over) White / Caucasian 20 17.3% Responsible for grandchildren97 82.7% Not responsible for grandchildrenOther race 4 100.0% Not responsible for grandchildrenTwo or more races 6 100.0% Not responsible for grandchildrenWhite alone, not Hispanic / Latino 20 16.7% Responsible for grandchildren100 83.3% Not responsible for grandchildrenHispanic or Latino 8 100.0% Not responsible for grandchildren