Races in Mount Vista, Washington (WA) Detailed Stats
Data:
Races - White alone (%)
Races - White alone (% change since 2000)
Races - Black alone (%)
Races - Black alone (% change since 2000)
Races - American Indian alone (%)
Races - American Indian alone (% change since 2000)
Races - Asian alone (%)
Races - Asian alone (% change since 2000)
Races - Hispanic (%)
Races - Hispanic (% change since 2000)
Races - Native Hawaiian and Other Pacific Islander alone (%)
Races - Native Hawaiian and Other Pacific Islander alone (% change since 2000)
Races - Two or more races(%)
Races - Two or more races(% change since 2000)
Races - Other race alone (%)
Races - Other race alone (% change since 2000)
Racial diversity
Place of birth - Born in state of residence (%)
Place of birth - Born in state of residence (%) - White
Place of birth - Born in state of residence (%) - Black or African American
Place of birth - Born in state of residence (%) - Asian
Place of birth - Born in state of residence (%) - Hispanic or Latino
Place of birth - Born in state of residence (%) - American Indian and Alaska Native
Place of birth - Born in state of residence (%) - Multirace
Place of birth - Born in state of residence (%) - Other Race
Place of birth - Born in other state (%)
Place of birth - Born in other state (%) - White
Place of birth - Born in other state (%) - Black or African American
Place of birth - Born in other state (%) - Asian
Place of birth - Born in other state (%) - Hispanic or Latino
Place of birth - Born in other state (%) - American Indian and Alaska Native
Place of birth - Born in other state (%) - Multirace
Place of birth - Born in other state (%) - Other Race
Place of birth - Native, outside of US (%)
Place of birth - Native, outside of US (%) - White
Place of birth - Native, outside of US (%) - Black or African American
Place of birth - Native, outside of US (%) - Asian
Place of birth - Native, outside of US (%) - Hispanic or Latino
Place of birth - Native, outside of US (%) - American Indian and Alaska Native
Place of birth - Native, outside of US (%) - Multirace
Place of birth - Native, outside of US (%) - Other Race
Place of birth - Foreign born (%)
Place of birth - Foreign born (%) - White
Place of birth - Foreign born (%) - Black or African American
Place of birth - Foreign born (%) - Asian
Place of birth - Foreign born (%) - Hispanic or Latino
Place of birth - Foreign born (%) - American Indian and Alaska Native
Place of birth - Foreign born (%) - Multirace
Place of birth - Foreign born (%) - Other Race
Residents speaking English at home (%)
Residents speaking English at home - Born in the United States (%)
Residents speaking English at home - Native, born elsewhere (%)
Residents speaking English at home - Foreign born (%)
Residents speaking Spanish at home (%)
Residents speaking Spanish at home - Born in the United States (%)
Residents speaking Spanish at home - Native, born elsewhere (%)
Residents speaking Spanish at home - Foreign born (%)
Residents speaking other language at home (%)
Residents speaking other language at home - Born in the United States (%)
Residents speaking other language at home - Native, born elsewhere (%)
Residents speaking other language at home - Foreign born (%)
Marital status - Never married (%)
Marital status - Now married (%)
Marital status - Separated (%)
Marital status - Widowed (%)
Marital status - Divorced (%)
Ancestries Reported - Arab (%)
Ancestries Reported - Czech (%)
Ancestries Reported - Danish (%)
Ancestries Reported - Dutch (%)
Ancestries Reported - English (%)
Ancestries Reported - French (%)
Ancestries Reported - French Canadian (%)
Ancestries Reported - German (%)
Ancestries Reported - Greek (%)
Ancestries Reported - Hungarian (%)
Ancestries Reported - Irish (%)
Ancestries Reported - Italian (%)
Ancestries Reported - Lithuanian (%)
Ancestries Reported - Norwegian (%)
Ancestries Reported - Polish (%)
Ancestries Reported - Portuguese (%)
Ancestries Reported - Russian (%)
Ancestries Reported - Scotch-Irish (%)
Ancestries Reported - Scottish (%)
Ancestries Reported - Slovak (%)
Ancestries Reported - Subsaharan African (%)
Ancestries Reported - Swedish (%)
Ancestries Reported - Swiss (%)
Ancestries Reported - Ukrainian (%)
Ancestries Reported - United States (%)
Ancestries Reported - Welsh (%)
Ancestries Reported - West Indian (%)
Ancestries Reported - Other (%)
Geographical mobility - Same house 1 year ago (%)
Geographical mobility - Same house 1 year ago (%) - White
Geographical mobility - Same house 1 year ago (%) - Black or African American
Geographical mobility - Same house 1 year ago (%) - Asian
Geographical mobility - Same house 1 year ago (%) - Hispanic or Latino
Geographical mobility - Same house 1 year ago (%) - American Indian and Alaska Native
Geographical mobility - Same house 1 year ago (%) - Multirace
Geographical mobility - Same house 1 year ago (%) - Other Race
Geographical mobility - Moved within same county (%)
Geographical mobility - Moved within same county (%) - White
Geographical mobility - Moved within same county (%) - Black or African American
Geographical mobility - Moved within same county (%) - Asian
Geographical mobility - Moved within same county (%) - Hispanic or Latino
Geographical mobility - Moved within same county (%) - American Indian and Alaska Native
Geographical mobility - Moved within same county (%) - Multirace
Geographical mobility - Moved within same county (%) - Other Race
Geographical mobility - Moved from different county within same state (%)
Geographical mobility - Moved from different county within same state (%) - White
Geographical mobility - Moved from different county within same state (%) - Black or African American
Geographical mobility - Moved from different county within same state (%) - Asian
Geographical mobility - Moved from different county within same state (%) - Hispanic or Latino
Geographical mobility - Moved from different county within same state (%) - American Indian and Alaska Native
Geographical mobility - Moved from different county within same state (%) - Multirace
Geographical mobility - Moved from different county within same state (%) - Other Race
Geographical mobility - Moved from different state (%)
Geographical mobility - Moved from different state (%) - White
Geographical mobility - Moved from different state (%) - Black or African American
Geographical mobility - Moved from different state (%) - Asian
Geographical mobility - Moved from different state (%) - Hispanic or Latino
Geographical mobility - Moved from different state (%) - American Indian and Alaska Native
Geographical mobility - Moved from different state (%) - Multirace
Geographical mobility - Moved from different state (%) - Other Race
Geographical mobility - Moved from abroad (%)
Geographical mobility - Moved from abroad (%) - White
Geographical mobility - Moved from abroad (%) - Black or African American
Geographical mobility - Moved from abroad (%) - Asian
Geographical mobility - Moved from abroad (%) - Hispanic or Latino
Geographical mobility - Moved from abroad (%) - American Indian and Alaska Native
Geographical mobility - Moved from abroad (%) - Multirace
Geographical mobility - Moved from abroad (%) - Other Race
Place of birth for the foreign-born population - Ireland (%)
Place of birth for the foreign-born population - Denmark (%)
Place of birth for the foreign-born population - Norway (%)
Place of birth for the foreign-born population - Sweden (%)
Place of birth for the foreign-born population - United Kingdom (%)
Place of birth for the foreign-born population - England (%)
Place of birth for the foreign-born population - Scotland (%)
Place of birth for the foreign-born population - Other Northern Europe (%)
Place of birth for the foreign-born population - Austria (%)
Place of birth for the foreign-born population - Belgium (%)
Place of birth for the foreign-born population - France (%)
Place of birth for the foreign-born population - Germany (%)
Place of birth for the foreign-born population - Netherlands (%)
Place of birth for the foreign-born population - Switzerland (%)
Place of birth for the foreign-born population - Other Western Europe (%)
Place of birth for the foreign-born population - Greece (%)
Place of birth for the foreign-born population - Italy (%)
Place of birth for the foreign-born population - Portugal (%)
Place of birth for the foreign-born population - Spain (%)
Place of birth for the foreign-born population - Other Southern Europe (%)
Place of birth for the foreign-born population - Albania (%)
Place of birth for the foreign-born population - Belarus (%)
Place of birth for the foreign-born population - Bosnia and Herzegovina (%)
Place of birth for the foreign-born population - Bulgaria (%)
Place of birth for the foreign-born population - Croatia (%)
Place of birth for the foreign-born population - Czechoslovakia (%)
Place of birth for the foreign-born population - Hungary (%)
Place of birth for the foreign-born population - Latvia (%)
Place of birth for the foreign-born population - Lithuania (%)
Place of birth for the foreign-born population - North Macedonia (Macedonia) (%)
Place of birth for the foreign-born population - Moldova (%)
Place of birth for the foreign-born population - Poland (%)
Place of birth for the foreign-born population - Romania (%)
Place of birth for the foreign-born population - Russia (%)
Place of birth for the foreign-born population - Serbia (%)
Place of birth for the foreign-born population - Ukraine (%)
Place of birth for the foreign-born population - Other Eastern Europe (%)
Place of birth for the foreign-born population - China (%)
Place of birth for the foreign-born population - Hong Kong (%)
Place of birth for the foreign-born population - Taiwan (%)
Place of birth for the foreign-born population - Japan (%)
Place of birth for the foreign-born population - Korea (%)
Place of birth for the foreign-born population - Other Eastern Asia (%)
Place of birth for the foreign-born population - Afghanistan (%)
Place of birth for the foreign-born population - Bangladesh (%)
Place of birth for the foreign-born population - India (%)
Place of birth for the foreign-born population - Iran (%)
Place of birth for the foreign-born population - Kazakhstan (%)
Place of birth for the foreign-born population - Nepal (%)
Place of birth for the foreign-born population - Pakistan (%)
Place of birth for the foreign-born population - Sri Lanka (%)
Place of birth for the foreign-born population - Uzbekistan (%)
Place of birth for the foreign-born population - Other South Central Asia (%)
Place of birth for the foreign-born population - Burma (%)
Place of birth for the foreign-born population - Cambodia (%)
Place of birth for the foreign-born population - Indonesia (%)
Place of birth for the foreign-born population - Laos (%)
Place of birth for the foreign-born population - Malaysia (%)
Place of birth for the foreign-born population - Philippines (%)
Place of birth for the foreign-born population - Singapore (%)
Place of birth for the foreign-born population - Thailand (%)
Place of birth for the foreign-born population - Vietnam (%)
Place of birth for the foreign-born population - Other South Eastern Asia (%)
Place of birth for the foreign-born population - Armenia (%)
Place of birth for the foreign-born population - Iraq (%)
Place of birth for the foreign-born population - Israel (%)
Place of birth for the foreign-born population - Jordan (%)
Place of birth for the foreign-born population - Kuwait (%)
Place of birth for the foreign-born population - Lebanon (%)
Place of birth for the foreign-born population - Saudi Arabia (%)
Place of birth for the foreign-born population - Syria (%)
Place of birth for the foreign-born population - Turkey (%)
Place of birth for the foreign-born population - Yemen (%)
Place of birth for the foreign-born population - Other Western Asia (%)
Place of birth for the foreign-born population - Eritrea (%)
Place of birth for the foreign-born population - Ethiopia (%)
Place of birth for the foreign-born population - Kenya (%)
Place of birth for the foreign-born population - Somalia (%)
Place of birth for the foreign-born population - Uganda (%)
Place of birth for the foreign-born population - Zimbabwe (%)
Place of birth for the foreign-born population - Other Eastern Africa (%)
Place of birth for the foreign-born population - Cameroon (%)
Place of birth for the foreign-born population - Congo (%)
Place of birth for the foreign-born population - Democratic Republic of Congo (Zaire) (%)
Place of birth for the foreign-born population - Other Middle Africa (%)
Place of birth for the foreign-born population - Egypt (%)
Place of birth for the foreign-born population - Morocco (%)
Place of birth for the foreign-born population - Sudan (%)
Place of birth for the foreign-born population - Other Northern Africa (%)
Place of birth for the foreign-born population - South Africa (%)
Place of birth for the foreign-born population - Other Southern Africa (%)
Place of birth for the foreign-born population - Cabo Verde (%)
Place of birth for the foreign-born population - Ghana (%)
Place of birth for the foreign-born population - Liberia (%)
Place of birth for the foreign-born population - Nigeria (%)
Place of birth for the foreign-born population - Senegal (%)
Place of birth for the foreign-born population - Sierra Leone (%)
Place of birth for the foreign-born population - Other Western Africa (%)
Place of birth for the foreign-born population - Australia (%)
Place of birth for the foreign-born population - New Zealand (%)
Place of birth for the foreign-born population - Fiji (%)
Place of birth for the foreign-born population - Micronesia (%)
Place of birth for the foreign-born population - Bahamas (%)
Place of birth for the foreign-born population - Barbados (%)
Place of birth for the foreign-born population - Cuba (%)
Place of birth for the foreign-born population - Dominica (%)
Place of birth for the foreign-born population - Dominican Republic (%)
Place of birth for the foreign-born population - Grenada (%)
Place of birth for the foreign-born population - Haiti (%)
Place of birth for the foreign-born population - Jamaica (%)
Place of birth for the foreign-born population - St. Vincent and the Grenadines (%)
Place of birth for the foreign-born population - Trinidad and Tobago (%)
Place of birth for the foreign-born population - West Indies (%)
Place of birth for the foreign-born population - Other Caribbean (%)
Place of birth for the foreign-born population - Belize (%)
Place of birth for the foreign-born population - Costa Rica (%)
Place of birth for the foreign-born population - El Salvador (%)
Place of birth for the foreign-born population - Guatemala (%)
Place of birth for the foreign-born population - Honduras (%)
Place of birth for the foreign-born population - Mexico (%)
Place of birth for the foreign-born population - Nicaragua (%)
Place of birth for the foreign-born population - Panama (%)
Place of birth for the foreign-born population - Other Central America (%)
Place of birth for the foreign-born population - Argentina (%)
Place of birth for the foreign-born population - Bolivia (%)
Place of birth for the foreign-born population - Brazil (%)
Place of birth for the foreign-born population - Chile (%)
Place of birth for the foreign-born population - Colombia (%)
Place of birth for the foreign-born population - Ecuador (%)
Place of birth for the foreign-born population - Guyana (%)
Place of birth for the foreign-born population - Peru (%)
Place of birth for the foreign-born population - Uruguay (%)
Place of birth for the foreign-born population - Venezuela (%)
Place of birth for the foreign-born population - Other South America (%)
Place of birth for the foreign-born population - Canada (%)
Place of birth for the foreign-born population - Other Northern America (%)
Place of birth for the foreign-born population - Other (%)
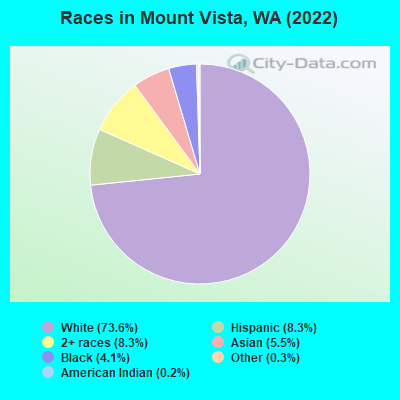
According to 2022 data, the most numerous races in Mount Vista, WA are White alone (7,846 residents), Hispanic (886 residents), and Asian alone (587 residents). 88.6% of Mount Vista residents speak English at home. 7.7% of Mount Vista, WA residents are foreign-born (3.5% born in Asia, 1.6% born in Europe, 1.0% born in Africa, 1.0% born in North America), which is 93.6% less than the foreign-born rate of 15.0% across the entire state of Washington.
Race distribution in Mount Vista
2000 2022
4,652,490 78.9% White alone 441,509 7.5% Hispanic 319,401 5.4% Asian alone 184,631 3.1% Black alone 175,926 3.0% Two or more races 85,396 1.4% American Indian alone 22,779 0.4% Native Hawaiian and Other 11,989 0.2% Other race alone
4,941,456 63.5% White alone 1,093,313 14.0% Hispanic 755,832 9.7% Asian alone 523,448 6.7% Two or more races 299,537 3.8% Black alone 69,024 0.9% American Indian alone 52,231 0.7% Native Hawaiian and Other 50,945 0.7% Other race alone
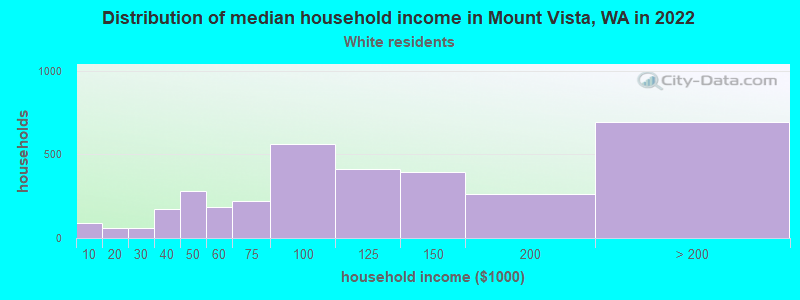
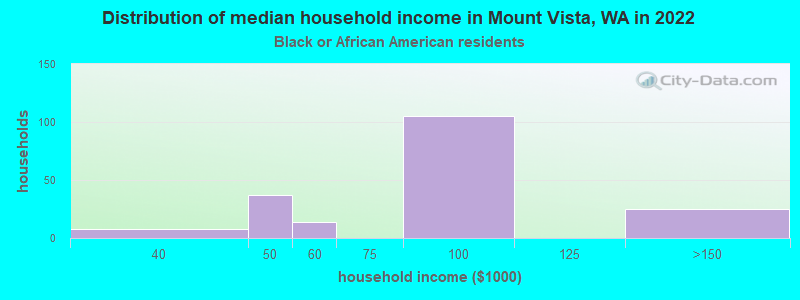
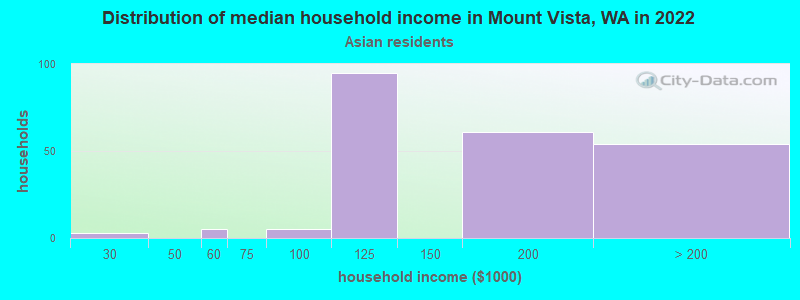
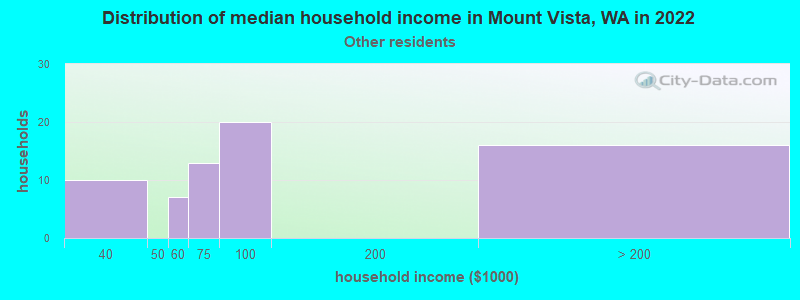
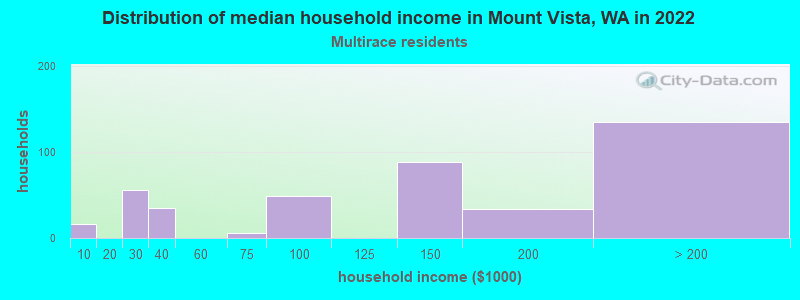
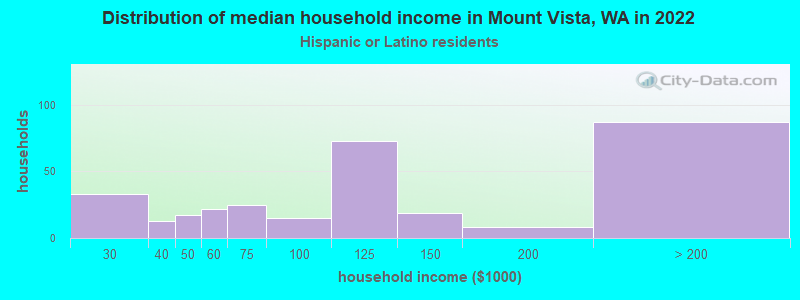
Income and house value in Mount Vista Median household income in 2022 $101,503 White non-Hispanic householders$87,738 Black householders$156,932 Asian householders$94,267 Some other race householders$173,797 Two or more races householders$91,943 Hispanic or Latino race householdersMedian 2022 house value $585,299 White Non-Hispanic householders$607,856 Black or African American householders$659,121 American Indian or Alaska Native householders $434,727 Asian householders$512,649 Two or more races householdersover $1,000,000 Hispanic or Latino householders
Median age by race in Mount Vista
43.7 Median age for White residents40.6 46.8 34.2 Median age for Black or African American residents29.8 36.6 67.3 Median age for American Indian / Alaska Native residents68.0 -640,557,005.5 47.8 Median age for Asian residents48.6 48.1 -779,279,278.5 Median age for Native Hawaiian / Pacific Islander residents-779,310,344.0 -928,017,717.8 47.6 Median age for Other race residents47.2 47.3 23.0 Median age for Two or more races residents24.8 22.3 44.2 Median age for White alone residents40.3 47.0 25.1 Median age for Hispanic or Latino residents22.0 36.7
Owner/renter occupied households by race in Mount Vista
House owners and renters - White residents 2,599 76.9% Owner occupied780 23.1% Renter occupiedHouse owners and renters - Black or African American residents 62 34.7% Owner occupied117 65.3% Renter occupiedHouse owners and renters - American Indian / Alaska Native residents 4 100.0% Owner occupiedHouse owners and renters - Asian residents 120 60.4% Owner occupied79 39.6% Renter occupiedHouse owners and renters - Other race residents 65 87.0% Owner occupied10 13.0% Renter occupiedHouse owners and renters - Two or more races residents 409 88.0% Owner occupied56 12.0% Renter occupiedHouse owners and renters - White alone residents 2,591 79.0% Owner occupied690 21.0% Renter occupiedHouse owners and renters - Hispanic or Latino residents 144 50.2% Owner occupied143 49.8% Renter occupied
Language usage in Mount Vista
English speakers - Total 88.6% of residents of Mount Vista speak English at home.
4.8% of residents speak Spanish at home 423 88.5% Speak English very well55 11.5% Speak English less than very well6.8% of residents speak other language at home 481 71.3% Speak English very well194 28.7% Speak English less than very well
English speakers - Born in the United States 92.0% of residents of Mount Vista speak English at home.
5.1% of residents speak Spanish at home 316 95.2% Speak English very well16 4.8% Speak English less than very well3.0% of residents speak other language at home 196 100.0% Speak English very well
English speakers - Native, born elsewhere 81.1% of residents of Mount Vista speak English at home.
3.8% of residents speak Spanish at home 10 100.0% Speak English very well16.7% of residents speak other language at home 9 20.5% Speak English very well35 79.5% Speak English less than very well
English speakers - Foreign-born 38.8% of residents of Mount Vista speak English at home.
19.5% of residents speak Spanish at home 112 77.2% Speak English very well33 22.8% Speak English less than very well44.7% of residents speak other language at home 170 51.1% Speak English very well163 48.9% Speak English less than very well
White (Caucasian) - Speak only English Native:
96.7% (7,045)Foreign-born:
65.0% (171)
White (Caucasian) - Speak another language Native:
3.4% (248)Foreign-born:
44.8% (118)
Black or African American - Speak only English Native:
100.0% (227)Foreign-born:
9.1% (8)
Asian - Speak only English Native:
49.5% (130)Foreign-born:
33.5% (109)
Asian - Speak another language Native:
51.5% (135)Foreign-born:
69.4% (226)
Other race - Speak only English Native:
77.1% (91)Foreign-born:
16.1% (5)
Other race - Speak another language Native:
28.5% (34)Foreign-born:
73.5% (24)
Two or more races - Speak only English Native:
75.0% (890)Foreign-born:
31.4% (5)
White alone - Speak only English Native:
96.8% (6,893)Foreign-born:
64.4% (180)
White alone - Speak another language Native:
3.1% (220)Foreign-born:
40.9% (114)
Hispanic or Latino - Speak another language Native:
29.3% (218)Foreign-born:
100.0% (59)
Foreign-born residents in Mount Vista 826 residents are foreign born (3.5% Asia , 1.6% Europe , 1.0% Africa , 1.0% North America ).
This city:
7.7%Washington:
14.9%
Marital status for residents in Mount Vista Marital status - White (Caucasian) population 15 years and over
Males 28.8% Never married53.8% Now married0.3% Separated1.9% Widowed15.2% DivorcedFemales 19.2% Never married53.3% Now married1.1% Separated7.3% Widowed19.1% DivorcedWomen who gave birth in the past 12 months Now married:
83.0% (43)Unmarried:
17.0% (9)
Women who did not give birth in the past 12 months Now married:
51.6% (774)Unmarried:
48.4% (728)
Marital status - Black or African American population 15 years and over
Males 23.7% Never married63.4% Now married0.0% Separated0.0% Widowed13.0% DivorcedFemales 50.4% Never married49.6% Now married0.0% Separated0.0% Widowed0.0% DivorcedWomen who did not give birth in the past 12 months Now married:
100.0% (56)Unmarried:
0.0% (0)
Marital status - Asian population 15 years and over
Males 29.4% Never married70.6% Now married0.0% Separated0.0% Widowed0.0% DivorcedFemales 23.1% Never married72.3% Now married0.0% Separated2.0% Widowed2.6% DivorcedWomen who did not give birth in the past 12 months Now married:
54.7% (104)Unmarried:
45.3% (86)
Marital status - Other race population 15 years and over
Males 40.4% Never married59.6% Now married0.0% Separated0.0% Widowed0.0% DivorcedFemales 0.0% Never married100.0% Now married0.0% Separated0.0% Widowed0.0% DivorcedWomen who did not give birth in the past 12 months Now married:
100.0% (11)Unmarried:
0.0% (0)
Marital status - Two or more races population 15 years and over
Males 52.5% Never married38.2% Now married0.0% Separated8.5% Widowed0.8% DivorcedFemales 58.1% Never married24.7% Now married0.0% Separated1.0% Widowed16.2% DivorcedWomen who gave birth in the past 12 months Now married:
0.0% (0)Unmarried:
100.0% (8)
Women who did not give birth in the past 12 months Now married:
29.4% (80)Unmarried:
70.6% (192)
Marital status - White alone, not Hispanic / Latino population 15 years and over
Males 27.9% Never married54.3% Now married0.3% Separated2.0% Widowed15.5% DivorcedFemales 17.6% Never married55.6% Now married1.2% Separated7.2% Widowed18.3% DivorcedWomen who gave birth in the past 12 months Now married:
83.0% (44)Unmarried:
17.0% (9)
Women who did not give birth in the past 12 months Now married:
53.1% (767)Unmarried:
46.9% (676)
Marital status - Hispanic or Latino population 15 years and over
Males 57.4% Never married42.6% Now married0.0% Separated0.0% Widowed0.0% DivorcedFemales 39.2% Never married27.7% Now married0.0% Separated5.7% Widowed27.4% DivorcedWomen who did not give birth in the past 12 months Now married:
35.1% (67)Unmarried:
64.9% (125)
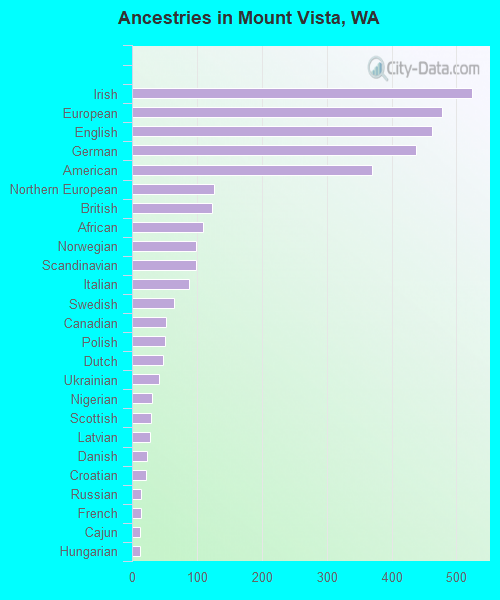
Ancestries in Mount Vista
524 11.3% Irish477 10.2% European463 9.9% English437 9.4% German370 7.9% American126 2.7% Northern European123 2.6% British110 2.4% African99 2.1% Norwegian99 2.1% Scandinavian88 1.9% Italian65 1.4% Swedish52 1.1% Canadian51 1.1% Polish48 1.0% Dutch41 0.9% Ukrainian31 0.7% Nigerian30 0.6% Scottish28 0.6% Latvian23 0.5% Danish21 0.5% Croatian14 0.3% Russian14 0.3% French13 0.3% Cajun12 0.3% Hungarian10 0.2% Scotch-Irish9 0.2% Eastern European7 0.2% Greek6 0.1% Finnish6 0.1% Slovene6 0.1% Arab3 0.06% Lebanese3 0.06% Welsh2 0.04% Czech2 0.04% Swiss2 0.04% Syrian
Children Nativity (place of birth) in Mount Vista
Children under 6 years - Living with two parents Both parents native 520 100.0% NativeBoth parents foreign-born 20 59.3% Native14 40.7% Foreign-bornOne native, one foreign-born parent 52 100.0% NativeChildren under 6 years - Living with one parent Native parent 154 100.0% NativeChildren 6 to 17 years - Living with two parents Both parents native 771 99.9% Native0 0.1% Foreign-bornBoth parents foreign-born 39 93.6% Native3 6.4% Foreign-bornOne native, one foreign-born parent 148 100.0% NativeChildren 6 to 17 years - Living with one parent Native parent 445 100.0% NativeForeign-born parent 13 52.5% Native11 47.5% Foreign-born
Grandparents responsible for own grandchildren in Mount Vista
Grandparents (30 to 59 years) White / Caucasian 4 7.5% Responsible for grandchildren48 92.5% Not responsible for grandchildrenAsian 2 100.0% Responsible for grandchildrenWhite alone, not Hispanic / Latino 4 11.3% Responsible for grandchildren30 88.7% Not responsible for grandchildrenHispanic or Latino 20 100.0% Not responsible for grandchildrenGrandparents (60 years and over) White / Caucasian 20 19.4% Responsible for grandchildren83 80.6% Not responsible for grandchildrenWhite alone, not Hispanic / Latino 21 19.6% Responsible for grandchildren86 80.4% Not responsible for grandchildren