Races in Newington Forest, Virginia (VA) Detailed Stats
Data:
Races - White alone (%)
Races - White alone (% change since 2000)
Races - Black alone (%)
Races - Black alone (% change since 2000)
Races - American Indian alone (%)
Races - American Indian alone (% change since 2000)
Races - Asian alone (%)
Races - Asian alone (% change since 2000)
Races - Hispanic (%)
Races - Hispanic (% change since 2000)
Races - Native Hawaiian and Other Pacific Islander alone (%)
Races - Native Hawaiian and Other Pacific Islander alone (% change since 2000)
Races - Two or more races(%)
Races - Two or more races(% change since 2000)
Races - Other race alone (%)
Races - Other race alone (% change since 2000)
Racial diversity
Place of birth - Born in state of residence (%)
Place of birth - Born in state of residence (%) - White
Place of birth - Born in state of residence (%) - Black or African American
Place of birth - Born in state of residence (%) - Asian
Place of birth - Born in state of residence (%) - Hispanic or Latino
Place of birth - Born in state of residence (%) - American Indian and Alaska Native
Place of birth - Born in state of residence (%) - Multirace
Place of birth - Born in state of residence (%) - Other Race
Place of birth - Born in other state (%)
Place of birth - Born in other state (%) - White
Place of birth - Born in other state (%) - Black or African American
Place of birth - Born in other state (%) - Asian
Place of birth - Born in other state (%) - Hispanic or Latino
Place of birth - Born in other state (%) - American Indian and Alaska Native
Place of birth - Born in other state (%) - Multirace
Place of birth - Born in other state (%) - Other Race
Place of birth - Native, outside of US (%)
Place of birth - Native, outside of US (%) - White
Place of birth - Native, outside of US (%) - Black or African American
Place of birth - Native, outside of US (%) - Asian
Place of birth - Native, outside of US (%) - Hispanic or Latino
Place of birth - Native, outside of US (%) - American Indian and Alaska Native
Place of birth - Native, outside of US (%) - Multirace
Place of birth - Native, outside of US (%) - Other Race
Place of birth - Foreign born (%)
Place of birth - Foreign born (%) - White
Place of birth - Foreign born (%) - Black or African American
Place of birth - Foreign born (%) - Asian
Place of birth - Foreign born (%) - Hispanic or Latino
Place of birth - Foreign born (%) - American Indian and Alaska Native
Place of birth - Foreign born (%) - Multirace
Place of birth - Foreign born (%) - Other Race
Residents speaking English at home (%)
Residents speaking English at home - Born in the United States (%)
Residents speaking English at home - Native, born elsewhere (%)
Residents speaking English at home - Foreign born (%)
Residents speaking Spanish at home (%)
Residents speaking Spanish at home - Born in the United States (%)
Residents speaking Spanish at home - Native, born elsewhere (%)
Residents speaking Spanish at home - Foreign born (%)
Residents speaking other language at home (%)
Residents speaking other language at home - Born in the United States (%)
Residents speaking other language at home - Native, born elsewhere (%)
Residents speaking other language at home - Foreign born (%)
Marital status - Never married (%)
Marital status - Now married (%)
Marital status - Separated (%)
Marital status - Widowed (%)
Marital status - Divorced (%)
Ancestries Reported - Arab (%)
Ancestries Reported - Czech (%)
Ancestries Reported - Danish (%)
Ancestries Reported - Dutch (%)
Ancestries Reported - English (%)
Ancestries Reported - French (%)
Ancestries Reported - French Canadian (%)
Ancestries Reported - German (%)
Ancestries Reported - Greek (%)
Ancestries Reported - Hungarian (%)
Ancestries Reported - Irish (%)
Ancestries Reported - Italian (%)
Ancestries Reported - Lithuanian (%)
Ancestries Reported - Norwegian (%)
Ancestries Reported - Polish (%)
Ancestries Reported - Portuguese (%)
Ancestries Reported - Russian (%)
Ancestries Reported - Scotch-Irish (%)
Ancestries Reported - Scottish (%)
Ancestries Reported - Slovak (%)
Ancestries Reported - Subsaharan African (%)
Ancestries Reported - Swedish (%)
Ancestries Reported - Swiss (%)
Ancestries Reported - Ukrainian (%)
Ancestries Reported - United States (%)
Ancestries Reported - Welsh (%)
Ancestries Reported - West Indian (%)
Ancestries Reported - Other (%)
Geographical mobility - Same house 1 year ago (%)
Geographical mobility - Same house 1 year ago (%) - White
Geographical mobility - Same house 1 year ago (%) - Black or African American
Geographical mobility - Same house 1 year ago (%) - Asian
Geographical mobility - Same house 1 year ago (%) - Hispanic or Latino
Geographical mobility - Same house 1 year ago (%) - American Indian and Alaska Native
Geographical mobility - Same house 1 year ago (%) - Multirace
Geographical mobility - Same house 1 year ago (%) - Other Race
Geographical mobility - Moved within same county (%)
Geographical mobility - Moved within same county (%) - White
Geographical mobility - Moved within same county (%) - Black or African American
Geographical mobility - Moved within same county (%) - Asian
Geographical mobility - Moved within same county (%) - Hispanic or Latino
Geographical mobility - Moved within same county (%) - American Indian and Alaska Native
Geographical mobility - Moved within same county (%) - Multirace
Geographical mobility - Moved within same county (%) - Other Race
Geographical mobility - Moved from different county within same state (%)
Geographical mobility - Moved from different county within same state (%) - White
Geographical mobility - Moved from different county within same state (%) - Black or African American
Geographical mobility - Moved from different county within same state (%) - Asian
Geographical mobility - Moved from different county within same state (%) - Hispanic or Latino
Geographical mobility - Moved from different county within same state (%) - American Indian and Alaska Native
Geographical mobility - Moved from different county within same state (%) - Multirace
Geographical mobility - Moved from different county within same state (%) - Other Race
Geographical mobility - Moved from different state (%)
Geographical mobility - Moved from different state (%) - White
Geographical mobility - Moved from different state (%) - Black or African American
Geographical mobility - Moved from different state (%) - Asian
Geographical mobility - Moved from different state (%) - Hispanic or Latino
Geographical mobility - Moved from different state (%) - American Indian and Alaska Native
Geographical mobility - Moved from different state (%) - Multirace
Geographical mobility - Moved from different state (%) - Other Race
Geographical mobility - Moved from abroad (%)
Geographical mobility - Moved from abroad (%) - White
Geographical mobility - Moved from abroad (%) - Black or African American
Geographical mobility - Moved from abroad (%) - Asian
Geographical mobility - Moved from abroad (%) - Hispanic or Latino
Geographical mobility - Moved from abroad (%) - American Indian and Alaska Native
Geographical mobility - Moved from abroad (%) - Multirace
Geographical mobility - Moved from abroad (%) - Other Race
Place of birth for the foreign-born population - Ireland (%)
Place of birth for the foreign-born population - Denmark (%)
Place of birth for the foreign-born population - Norway (%)
Place of birth for the foreign-born population - Sweden (%)
Place of birth for the foreign-born population - United Kingdom (%)
Place of birth for the foreign-born population - England (%)
Place of birth for the foreign-born population - Scotland (%)
Place of birth for the foreign-born population - Other Northern Europe (%)
Place of birth for the foreign-born population - Austria (%)
Place of birth for the foreign-born population - Belgium (%)
Place of birth for the foreign-born population - France (%)
Place of birth for the foreign-born population - Germany (%)
Place of birth for the foreign-born population - Netherlands (%)
Place of birth for the foreign-born population - Switzerland (%)
Place of birth for the foreign-born population - Other Western Europe (%)
Place of birth for the foreign-born population - Greece (%)
Place of birth for the foreign-born population - Italy (%)
Place of birth for the foreign-born population - Portugal (%)
Place of birth for the foreign-born population - Spain (%)
Place of birth for the foreign-born population - Other Southern Europe (%)
Place of birth for the foreign-born population - Albania (%)
Place of birth for the foreign-born population - Belarus (%)
Place of birth for the foreign-born population - Bosnia and Herzegovina (%)
Place of birth for the foreign-born population - Bulgaria (%)
Place of birth for the foreign-born population - Croatia (%)
Place of birth for the foreign-born population - Czechoslovakia (%)
Place of birth for the foreign-born population - Hungary (%)
Place of birth for the foreign-born population - Latvia (%)
Place of birth for the foreign-born population - Lithuania (%)
Place of birth for the foreign-born population - North Macedonia (Macedonia) (%)
Place of birth for the foreign-born population - Moldova (%)
Place of birth for the foreign-born population - Poland (%)
Place of birth for the foreign-born population - Romania (%)
Place of birth for the foreign-born population - Russia (%)
Place of birth for the foreign-born population - Serbia (%)
Place of birth for the foreign-born population - Ukraine (%)
Place of birth for the foreign-born population - Other Eastern Europe (%)
Place of birth for the foreign-born population - China (%)
Place of birth for the foreign-born population - Hong Kong (%)
Place of birth for the foreign-born population - Taiwan (%)
Place of birth for the foreign-born population - Japan (%)
Place of birth for the foreign-born population - Korea (%)
Place of birth for the foreign-born population - Other Eastern Asia (%)
Place of birth for the foreign-born population - Afghanistan (%)
Place of birth for the foreign-born population - Bangladesh (%)
Place of birth for the foreign-born population - India (%)
Place of birth for the foreign-born population - Iran (%)
Place of birth for the foreign-born population - Kazakhstan (%)
Place of birth for the foreign-born population - Nepal (%)
Place of birth for the foreign-born population - Pakistan (%)
Place of birth for the foreign-born population - Sri Lanka (%)
Place of birth for the foreign-born population - Uzbekistan (%)
Place of birth for the foreign-born population - Other South Central Asia (%)
Place of birth for the foreign-born population - Burma (%)
Place of birth for the foreign-born population - Cambodia (%)
Place of birth for the foreign-born population - Indonesia (%)
Place of birth for the foreign-born population - Laos (%)
Place of birth for the foreign-born population - Malaysia (%)
Place of birth for the foreign-born population - Philippines (%)
Place of birth for the foreign-born population - Singapore (%)
Place of birth for the foreign-born population - Thailand (%)
Place of birth for the foreign-born population - Vietnam (%)
Place of birth for the foreign-born population - Other South Eastern Asia (%)
Place of birth for the foreign-born population - Armenia (%)
Place of birth for the foreign-born population - Iraq (%)
Place of birth for the foreign-born population - Israel (%)
Place of birth for the foreign-born population - Jordan (%)
Place of birth for the foreign-born population - Kuwait (%)
Place of birth for the foreign-born population - Lebanon (%)
Place of birth for the foreign-born population - Saudi Arabia (%)
Place of birth for the foreign-born population - Syria (%)
Place of birth for the foreign-born population - Turkey (%)
Place of birth for the foreign-born population - Yemen (%)
Place of birth for the foreign-born population - Other Western Asia (%)
Place of birth for the foreign-born population - Eritrea (%)
Place of birth for the foreign-born population - Ethiopia (%)
Place of birth for the foreign-born population - Kenya (%)
Place of birth for the foreign-born population - Somalia (%)
Place of birth for the foreign-born population - Uganda (%)
Place of birth for the foreign-born population - Zimbabwe (%)
Place of birth for the foreign-born population - Other Eastern Africa (%)
Place of birth for the foreign-born population - Cameroon (%)
Place of birth for the foreign-born population - Congo (%)
Place of birth for the foreign-born population - Democratic Republic of Congo (Zaire) (%)
Place of birth for the foreign-born population - Other Middle Africa (%)
Place of birth for the foreign-born population - Egypt (%)
Place of birth for the foreign-born population - Morocco (%)
Place of birth for the foreign-born population - Sudan (%)
Place of birth for the foreign-born population - Other Northern Africa (%)
Place of birth for the foreign-born population - South Africa (%)
Place of birth for the foreign-born population - Other Southern Africa (%)
Place of birth for the foreign-born population - Cabo Verde (%)
Place of birth for the foreign-born population - Ghana (%)
Place of birth for the foreign-born population - Liberia (%)
Place of birth for the foreign-born population - Nigeria (%)
Place of birth for the foreign-born population - Senegal (%)
Place of birth for the foreign-born population - Sierra Leone (%)
Place of birth for the foreign-born population - Other Western Africa (%)
Place of birth for the foreign-born population - Australia (%)
Place of birth for the foreign-born population - New Zealand (%)
Place of birth for the foreign-born population - Fiji (%)
Place of birth for the foreign-born population - Micronesia (%)
Place of birth for the foreign-born population - Bahamas (%)
Place of birth for the foreign-born population - Barbados (%)
Place of birth for the foreign-born population - Cuba (%)
Place of birth for the foreign-born population - Dominica (%)
Place of birth for the foreign-born population - Dominican Republic (%)
Place of birth for the foreign-born population - Grenada (%)
Place of birth for the foreign-born population - Haiti (%)
Place of birth for the foreign-born population - Jamaica (%)
Place of birth for the foreign-born population - St. Vincent and the Grenadines (%)
Place of birth for the foreign-born population - Trinidad and Tobago (%)
Place of birth for the foreign-born population - West Indies (%)
Place of birth for the foreign-born population - Other Caribbean (%)
Place of birth for the foreign-born population - Belize (%)
Place of birth for the foreign-born population - Costa Rica (%)
Place of birth for the foreign-born population - El Salvador (%)
Place of birth for the foreign-born population - Guatemala (%)
Place of birth for the foreign-born population - Honduras (%)
Place of birth for the foreign-born population - Mexico (%)
Place of birth for the foreign-born population - Nicaragua (%)
Place of birth for the foreign-born population - Panama (%)
Place of birth for the foreign-born population - Other Central America (%)
Place of birth for the foreign-born population - Argentina (%)
Place of birth for the foreign-born population - Bolivia (%)
Place of birth for the foreign-born population - Brazil (%)
Place of birth for the foreign-born population - Chile (%)
Place of birth for the foreign-born population - Colombia (%)
Place of birth for the foreign-born population - Ecuador (%)
Place of birth for the foreign-born population - Guyana (%)
Place of birth for the foreign-born population - Peru (%)
Place of birth for the foreign-born population - Uruguay (%)
Place of birth for the foreign-born population - Venezuela (%)
Place of birth for the foreign-born population - Other South America (%)
Place of birth for the foreign-born population - Canada (%)
Place of birth for the foreign-born population - Other Northern America (%)
Place of birth for the foreign-born population - Other (%)
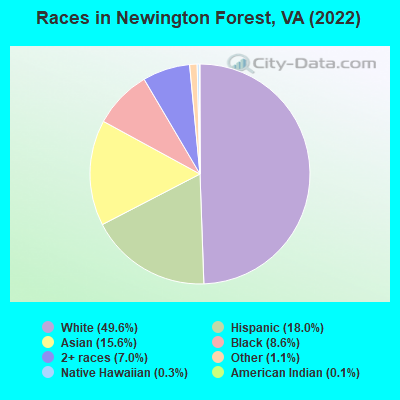
According to 2022 data, the most numerous races in Newington Forest, VA are White alone (6,237 residents), Black alone (1,078 residents), and Hispanic (2,261 residents). 65.4% of Newington Forest residents speak English at home.
Race distribution in Newington Forest 6,237 49.6% White alone 2,261 18.0% Hispanic 1,956 15.6% Asian alone 1,078 8.6% Black alone 881 7.0% Two or more races 132 1.1% Other race alone 32 0.3% Native Hawaiian and Other 14 0.1% American Indian alone
2000 2022
4,965,637 70.2% White alone 1,376,378 19.4% Black alone 329,540 4.7% Hispanic 259,277 3.7% Asian alone 114,022 1.6% Two or more races 18,596 0.3% American Indian alone 11,685 0.2% Other race alone 3,380 0.05% Native Hawaiian and Other
5,095,130 58.7% White alone 1,594,785 18.4% Black alone 905,750 10.4% Hispanic 602,881 6.9% Asian alone 406,047 4.7% Two or more races 60,419 0.7% Other race alone 11,738 0.1% American Indian alone 6,869 0.08% Native Hawaiian and Other
Income and house value in Newington Forest Median household income in 2022 $147,208 White non-Hispanic householders$181,498 Black householders$121,975 Asian householders$109,086 Some other race householders$153,504 Two or more races householders$123,495 Hispanic or Latino race householders
Median age by race in Newington Forest
40.1 Median age for White residents37.5 42.5 40.4 Median age for Black or African American residents41.6 41.0 54.4 Median age for American Indian / Alaska Native residents115.2 39.5 40.9 Median age for Asian residents36.5 42.7 28.9 Median age for Native Hawaiian / Pacific Islander residents16.4 35.3 36.9 Median age for Other race residents34.5 47.7 29.2 Median age for Two or more races residents30.4 28.2 39.9 Median age for White alone residents37.5 41.7 35.9 Median age for Hispanic or Latino residents40.1 31.4
Owner/renter occupied households by race in Newington Forest
House owners and renters - White residents 2,297 91.6% Owner occupied210 8.4% Renter occupiedHouse owners and renters - Black or African American residents 344 95.8% Owner occupied15 4.2% Renter occupiedHouse owners and renters - American Indian / Alaska Native residents 26 100.0% Owner occupiedHouse owners and renters - Asian residents 711 96.0% Owner occupied29 4.0% Renter occupiedHouse owners and renters - Native Hawaiian / Pacific Islander residents 12 100.0% Owner occupiedHouse owners and renters - Other race residents 171 100.0% Owner occupiedHouse owners and renters - Two or more races residents 570 92.7% Owner occupied45 7.3% Renter occupiedHouse owners and renters - White alone residents 2,200 91.4% Owner occupied206 8.6% Renter occupiedHouse owners and renters - Hispanic or Latino residents 530 90.3% Owner occupied57 9.7% Renter occupied
Language usage in Newington Forest
English speakers - Total 65.4% of residents of Newington Forest speak English at home.
14.8% of residents speak Spanish at home 1,097 63.4% Speak English very well634 36.6% Speak English less than very well19.7% of residents speak other language at home 1,652 71.8% Speak English very well649 28.2% Speak English less than very well
English speakers - Born in the United States 92.7% of residents of Newington Forest speak English at home.
4.1% of residents speak Spanish at home 185 94.4% Speak English very well11 5.6% Speak English less than very well3.2% of residents speak other language at home 99 65.6% Speak English very well52 34.4% Speak English less than very well
English speakers - Native, born elsewhere 48.0% of residents of Newington Forest speak English at home.
34.5% of residents speak Spanish at home 180 97.8% Speak English very well4 2.2% Speak English less than very well16.7% of residents speak other language at home 82 92.1% Speak English very well7 7.9% Speak English less than very well
English speakers - Foreign-born 14.8% of residents of Newington Forest speak English at home.
32.5% of residents speak Spanish at home 436 41.9% Speak English very well605 58.1% Speak English less than very well52.4% of residents speak other language at home 1,163 69.3% Speak English very well516 30.7% Speak English less than very well
White (Caucasian) - Speak only English Native:
89.9% (4,990)Foreign-born:
19.8% (105)
White (Caucasian) - Speak another language Native:
9.1% (503)Foreign-born:
78.1% (414)
Black or African American - Speak only English Native:
93.9% (715)Foreign-born:
53.1% (178)
Black or African American - Speak another language Native:
4.9% (37)Foreign-born:
53.6% (180)
American Indian / Alaska Native - Speak another language Native:
65.2% (19)Foreign-born:
100.0% (64)
Asian - Speak only English Native:
58.1% (403)Foreign-born:
14.0% (166)
Asian - Speak another language Native:
41.2% (286)Foreign-born:
86.1% (1,021)
Native Hawaiian / Pacific Islander - Speak another language Native:
26.6% (10)Foreign-born:
49.7% (6)
Other race - Speak only English Native:
50.2% (123)Foreign-born:
8.9% (35)
Other race - Speak another language Native:
51.9% (127)Foreign-born:
91.3% (360)
Two or more races - Speak another language Native:
22.6% (276)Foreign-born:
100.0% (849)
White alone - Speak only English Native:
91.6% (4,859)Foreign-born:
14.0% (85)
White alone - Speak another language Native:
8.1% (427)Foreign-born:
83.9% (510)
Hispanic or Latino - Speak only English Native:
50.2% (518)Foreign-born:
5.1% (51)
Hispanic or Latino - Speak another language Native:
50.4% (520)Foreign-born:
94.9% (956)
Foreign-born residents in Newington Forest
Marital status for residents in Newington Forest Marital status - White (Caucasian) population 15 years and over
Males 29.9% Never married63.2% Now married0.5% Separated1.1% Widowed5.3% DivorcedFemales 20.8% Never married62.5% Now married1.0% Separated6.3% Widowed9.4% DivorcedWomen who gave birth in the past 12 months Now married:
72.2% (104)Unmarried:
27.8% (40)
Women who did not give birth in the past 12 months Now married:
63.9% (803)Unmarried:
36.1% (454)
Marital status - Black or African American population 15 years and over
Males 27.7% Never married48.7% Now married19.7% Separated1.7% Widowed2.2% DivorcedFemales 38.2% Never married50.3% Now married2.3% Separated4.0% Widowed5.2% DivorcedWomen who gave birth in the past 12 months Now married:
100.0% (31)Unmarried:
0.0% (0)
Women who did not give birth in the past 12 months Now married:
50.5% (111)Unmarried:
49.5% (109)
Marital status - American Indian / Alaska Native population 15 years and over
Males 30.6% Never married0.0% Now married0.0% Separated38.9% Widowed30.6% DivorcedFemales 0.0% Never married55.0% Now married0.0% Separated0.0% Widowed45.0% DivorcedWomen who did not give birth in the past 12 months Now married:
55.0% (12)Unmarried:
45.0% (10)
Marital status - Asian population 15 years and over
Males 36.9% Never married47.2% Now married0.0% Separated0.4% Widowed15.5% DivorcedFemales 24.4% Never married62.0% Now married1.4% Separated3.0% Widowed9.1% DivorcedWomen who gave birth in the past 12 months Now married:
100.0% (43)Unmarried:
0.0% (0)
Women who did not give birth in the past 12 months Now married:
58.5% (322)Unmarried:
41.5% (228)
Marital status - Native Hawaiian / Pacific Islander population 15 years and over
Males 66.7% Never married33.3% Now married0.0% Separated0.0% Widowed0.0% DivorcedFemales 55.6% Never married44.4% Now married0.0% Separated0.0% Widowed0.0% DivorcedWomen who did not give birth in the past 12 months Now married:
37.5% (6)Unmarried:
62.5% (11)
Marital status - Other race population 15 years and over
Males 33.2% Never married59.7% Now married7.1% Separated0.0% Widowed0.0% DivorcedFemales 38.8% Never married53.5% Now married0.7% Separated7.0% Widowed0.0% DivorcedWomen who gave birth in the past 12 months Now married:
100.0% (5)Unmarried:
0.0% (0)
Women who did not give birth in the past 12 months Now married:
42.1% (92)Unmarried:
57.9% (127)
Marital status - Two or more races population 15 years and over
Males 35.9% Never married42.4% Now married3.3% Separated0.0% Widowed18.3% DivorcedFemales 35.7% Never married61.5% Now married0.0% Separated0.0% Widowed2.8% DivorcedWomen who gave birth in the past 12 months Now married:
100.0% (90)Unmarried:
0.0% (0)
Women who did not give birth in the past 12 months Now married:
45.9% (187)Unmarried:
54.1% (221)
Marital status - White alone, not Hispanic / Latino population 15 years and over
Males 30.6% Never married64.0% Now married0.4% Separated1.2% Widowed3.9% DivorcedFemales 21.7% Never married63.1% Now married1.1% Separated5.7% Widowed8.3% DivorcedWomen who gave birth in the past 12 months Now married:
71.5% (110)Unmarried:
28.5% (44)
Women who did not give birth in the past 12 months Now married:
62.3% (769)Unmarried:
37.7% (466)
Marital status - Hispanic or Latino population 15 years and over
Males 25.3% Never married49.5% Now married2.6% Separated1.7% Widowed21.0% DivorcedFemales 30.9% Never married56.5% Now married0.2% Separated5.2% Widowed7.2% DivorcedWomen who gave birth in the past 12 months Now married:
100.0% (79)Unmarried:
0.0% (0)
Women who did not give birth in the past 12 months Now married:
51.0% (300)Unmarried:
49.0% (288)
Ancestries in Newington Forest
434 6.6% English427 6.5% Irish320 4.9% German287 4.4% American141 2.1% Ethiopian108 1.6% European106 1.6% African100 1.5% Italian98 1.5% Albanian96 1.5% Sierra Leonean95 1.4% Greek84 1.3% Armenian66 1.0% Portuguese59 0.9% Egyptian53 0.8% French Canadian51 0.8% French41 0.6% Russian41 0.6% British39 0.6% Turkish32 0.5% Polish29 0.4% Norwegian29 0.4% Palestinian25 0.4% Swiss23 0.4% Scottish22 0.3% Lebanese22 0.3% Scotch-Irish16 0.2% Serbian15 0.2% Slovak13 0.2% Jordanian13 0.2% Northern European13 0.2% Bulgarian12 0.2% Dutch9 0.1% Ukrainian8 0.1% Czechoslovakian7 0.1% Hungarian7 0.1% Trinidadian and Tobagonian6 0.09% Canadian6 0.09% Moroccan5 0.08% Croatian3 0.05% Welsh3 0.05% Haitian
Geographical mobility in Newington Forest Same house 1 year ago 5,563 88.6% White (Caucasian)1,033 90.4% Black or African American70 96.1% American Indian / Alaska Native1,830 95.4% Asian47 95.3% Native Hawaiian / Pacific Islander599 92.3% Other race1,357 58.3% Two or more races5,550 90.9% White alone, not Hispanic / Latino1,367 61.9% Hispanic or LatinoMoved within same county 242 3.9% White / Caucasian75 6.5% Black or African American46 2.4% Asian16 2.4% Other race1,042 44.7% Two or more races255 4.2% White alone, not Hispanic / Latino573 25.9% Hispanic or LatinoMoved within same state 150 2.4% White / Caucasian7 0.6% Black or African American4 0.6% Other race190 8.2% Two or more races148 2.4% White alone, not Hispanic / Latino59 2.7% Hispanic or LatinoMoved from different state 185 3.0% White / Caucasian22 1.1% Asian22 3.4% Other race18 0.8% Two or more races104 1.7% White alone, not Hispanic / Latino141 6.4% Hispanic or LatinoMoved from abroad 120 1.9% White21 3.3% Other race41 0.7% White alone, not Hispanic / Latino143 6.5% Hispanic or Latino
Children Nativity (place of birth) in Newington Forest
Children under 6 years - Living with two parents Both parents native 389 100.0% NativeBoth parents foreign-born 227 100.0% NativeOne native, one foreign-born parent 304 100.0% NativeChildren under 6 years - Living with one parent Native parent 59 100.0% NativeForeign-born parent 26 100.0% NativeChildren 6 to 17 years - Living with two parents Both parents native 875 99.8% Native2 0.2% Foreign-bornBoth parents foreign-born 336 87.0% Native50 13.0% Foreign-bornOne native, one foreign-born parent 279 98.1% Native5 1.9% Foreign-bornChildren 6 to 17 years - Living with one parent Native parent 133 100.0% NativeForeign-born parent 184 51.3% Native174 48.7% Foreign-born
Grandparents responsible for own grandchildren in Newington Forest
Grandparents (30 to 59 years) Asian 20 100.0% Not responsible for grandchildrenGrandparents (60 years and over) Asian 2 26.8% Responsible for grandchildren4 73.2% Not responsible for grandchildren