Races in Newport News, Virginia (VA) Detailed Stats
Data:
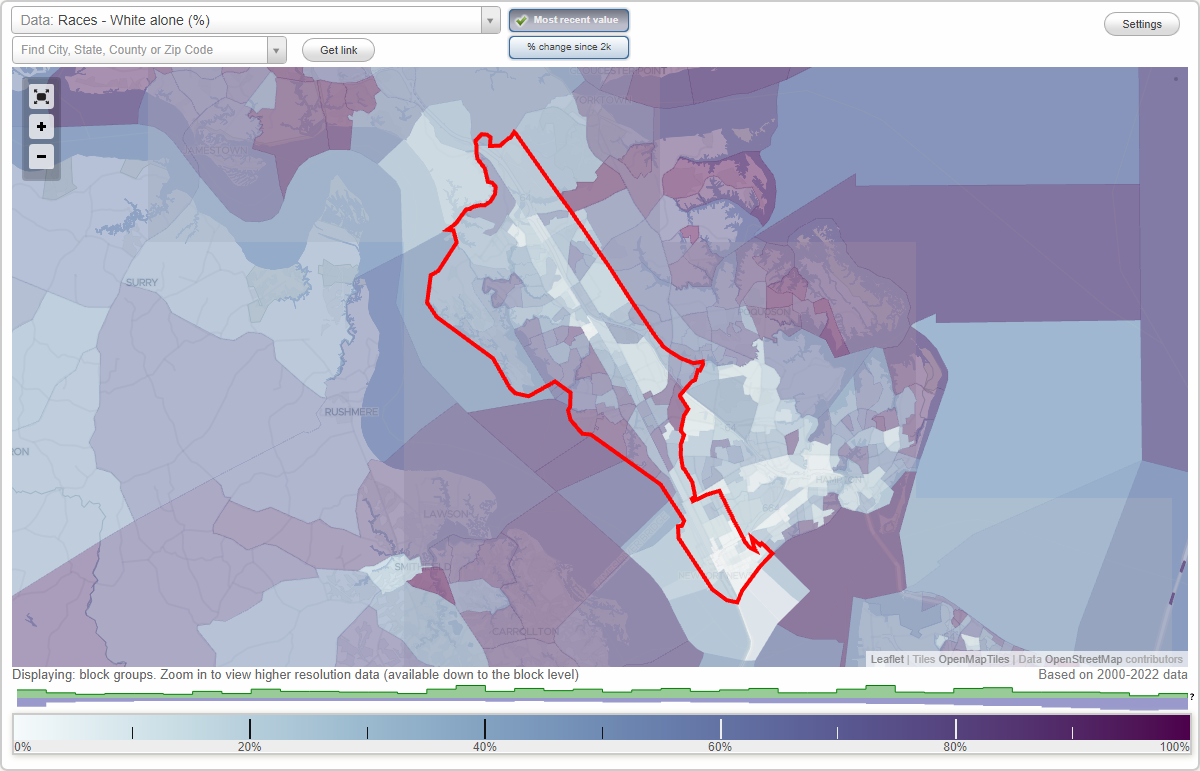
Races - White alone (%)
Races - White alone (% change since 2000)
Races - Black alone (%)
Races - Black alone (% change since 2000)
Races - American Indian alone (%)
Races - American Indian alone (% change since 2000)
Races - Asian alone (%)
Races - Asian alone (% change since 2000)
Races - Hispanic (%)
Races - Hispanic (% change since 2000)
Races - Native Hawaiian and Other Pacific Islander alone (%)
Races - Native Hawaiian and Other Pacific Islander alone (% change since 2000)
Races - Two or more races(%)
Races - Two or more races(% change since 2000)
Races - Other race alone (%)
Races - Other race alone (% change since 2000)
Racial diversity
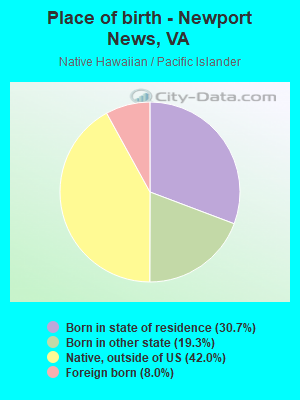
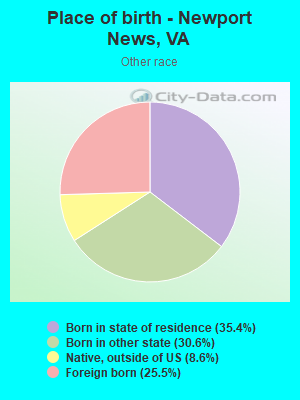
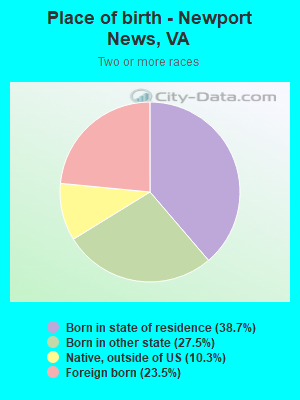
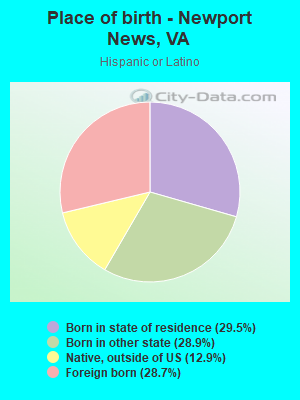
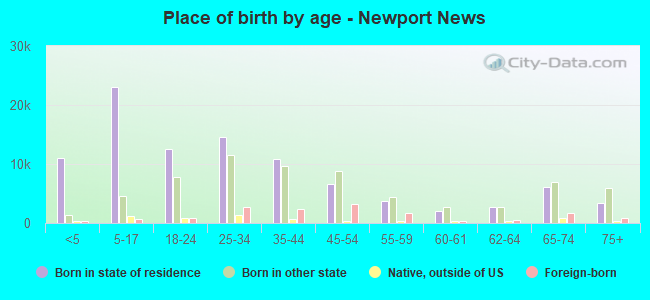
Place of birth - Born in state of residence (%)
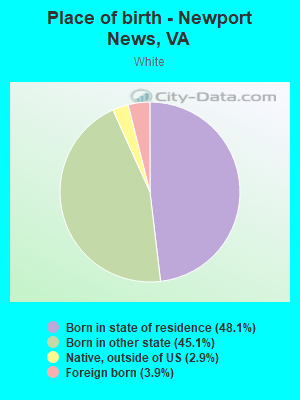
Place of birth - Born in state of residence (%) - White
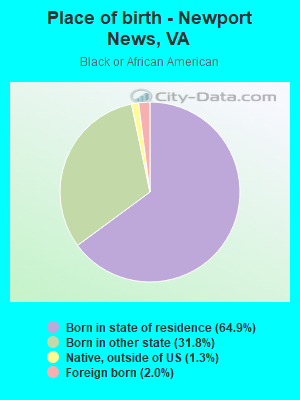
Place of birth - Born in state of residence (%) - Black or African American
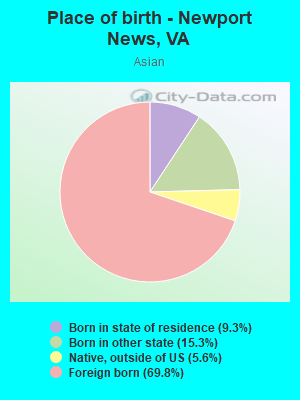
Place of birth - Born in state of residence (%) - Asian
Place of birth - Born in state of residence (%) - Hispanic or Latino
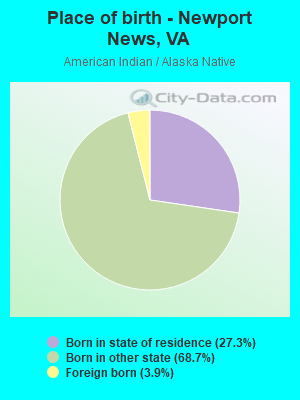
Place of birth - Born in state of residence (%) - American Indian and Alaska Native
Place of birth - Born in state of residence (%) - Multirace
Place of birth - Born in state of residence (%) - Other Race
Place of birth - Born in other state (%)
Place of birth - Born in other state (%) - White
Place of birth - Born in other state (%) - Black or African American
Place of birth - Born in other state (%) - Asian
Place of birth - Born in other state (%) - Hispanic or Latino
Place of birth - Born in other state (%) - American Indian and Alaska Native
Place of birth - Born in other state (%) - Multirace
Place of birth - Born in other state (%) - Other Race
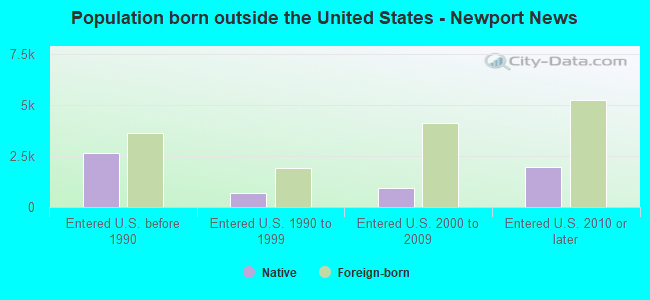
Place of birth - Native, outside of US (%)
Place of birth - Native, outside of US (%) - White
Place of birth - Native, outside of US (%) - Black or African American
Place of birth - Native, outside of US (%) - Asian
Place of birth - Native, outside of US (%) - Hispanic or Latino
Place of birth - Native, outside of US (%) - American Indian and Alaska Native
Place of birth - Native, outside of US (%) - Multirace
Place of birth - Native, outside of US (%) - Other Race
Place of birth - Foreign born (%)
Place of birth - Foreign born (%) - White
Place of birth - Foreign born (%) - Black or African American
Place of birth - Foreign born (%) - Asian
Place of birth - Foreign born (%) - Hispanic or Latino
Place of birth - Foreign born (%) - American Indian and Alaska Native
Place of birth - Foreign born (%) - Multirace
Place of birth - Foreign born (%) - Other Race
Residents speaking English at home (%)
Residents speaking English at home - Born in the United States (%)
Residents speaking English at home - Native, born elsewhere (%)
Residents speaking English at home - Foreign born (%)
Residents speaking Spanish at home (%)
Residents speaking Spanish at home - Born in the United States (%)
Residents speaking Spanish at home - Native, born elsewhere (%)
Residents speaking Spanish at home - Foreign born (%)
Residents speaking other language at home (%)
Residents speaking other language at home - Born in the United States (%)
Residents speaking other language at home - Native, born elsewhere (%)
Residents speaking other language at home - Foreign born (%)
Marital status - Never married (%)
Marital status - Now married (%)
Marital status - Separated (%)
Marital status - Widowed (%)
Marital status - Divorced (%)
Ancestries Reported - Arab (%)
Ancestries Reported - Czech (%)
Ancestries Reported - Danish (%)
Ancestries Reported - Dutch (%)
Ancestries Reported - English (%)
Ancestries Reported - French (%)
Ancestries Reported - French Canadian (%)
Ancestries Reported - German (%)
Ancestries Reported - Greek (%)
Ancestries Reported - Hungarian (%)
Ancestries Reported - Irish (%)
Ancestries Reported - Italian (%)
Ancestries Reported - Lithuanian (%)
Ancestries Reported - Norwegian (%)
Ancestries Reported - Polish (%)
Ancestries Reported - Portuguese (%)
Ancestries Reported - Russian (%)
Ancestries Reported - Scotch-Irish (%)
Ancestries Reported - Scottish (%)
Ancestries Reported - Slovak (%)
Ancestries Reported - Subsaharan African (%)
Ancestries Reported - Swedish (%)
Ancestries Reported - Swiss (%)
Ancestries Reported - Ukrainian (%)
Ancestries Reported - United States (%)
Ancestries Reported - Welsh (%)
Ancestries Reported - West Indian (%)
Ancestries Reported - Other (%)
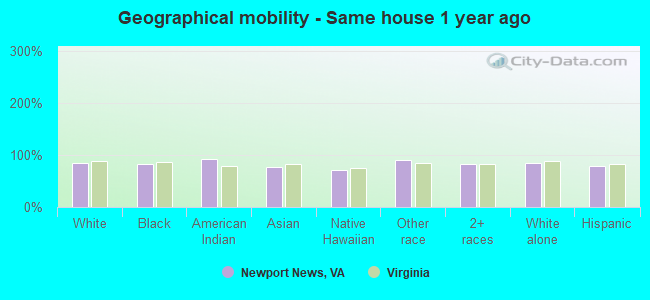
Geographical mobility - Same house 1 year ago (%)
Geographical mobility - Same house 1 year ago (%) - White
Geographical mobility - Same house 1 year ago (%) - Black or African American
Geographical mobility - Same house 1 year ago (%) - Asian
Geographical mobility - Same house 1 year ago (%) - Hispanic or Latino
Geographical mobility - Same house 1 year ago (%) - American Indian and Alaska Native
Geographical mobility - Same house 1 year ago (%) - Multirace
Geographical mobility - Same house 1 year ago (%) - Other Race
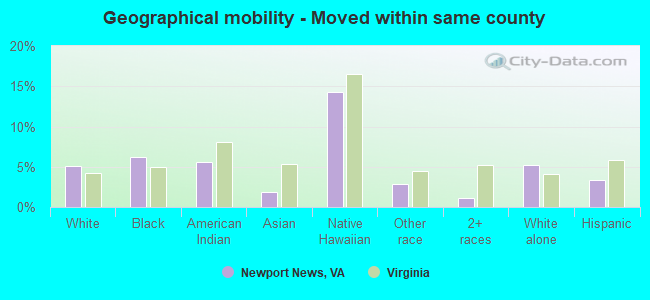
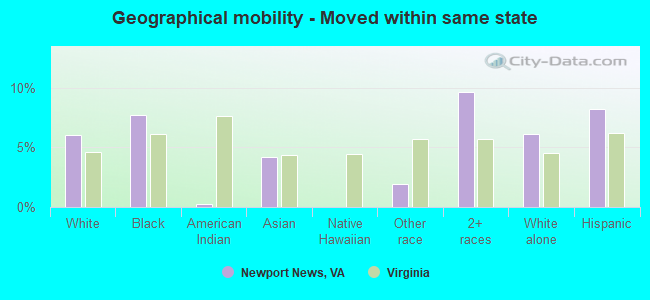
Geographical mobility - Moved within same county (%)
Geographical mobility - Moved within same county (%) - White
Geographical mobility - Moved within same county (%) - Black or African American
Geographical mobility - Moved within same county (%) - Asian
Geographical mobility - Moved within same county (%) - Hispanic or Latino
Geographical mobility - Moved within same county (%) - American Indian and Alaska Native
Geographical mobility - Moved within same county (%) - Multirace
Geographical mobility - Moved within same county (%) - Other Race
Geographical mobility - Moved from different county within same state (%)
Geographical mobility - Moved from different county within same state (%) - White
Geographical mobility - Moved from different county within same state (%) - Black or African American
Geographical mobility - Moved from different county within same state (%) - Asian
Geographical mobility - Moved from different county within same state (%) - Hispanic or Latino
Geographical mobility - Moved from different county within same state (%) - American Indian and Alaska Native
Geographical mobility - Moved from different county within same state (%) - Multirace
Geographical mobility - Moved from different county within same state (%) - Other Race
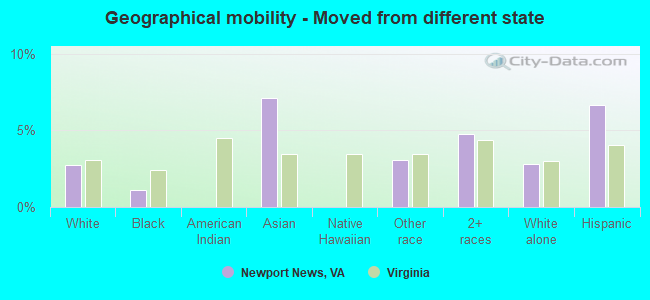
Geographical mobility - Moved from different state (%)
Geographical mobility - Moved from different state (%) - White
Geographical mobility - Moved from different state (%) - Black or African American
Geographical mobility - Moved from different state (%) - Asian
Geographical mobility - Moved from different state (%) - Hispanic or Latino
Geographical mobility - Moved from different state (%) - American Indian and Alaska Native
Geographical mobility - Moved from different state (%) - Multirace
Geographical mobility - Moved from different state (%) - Other Race
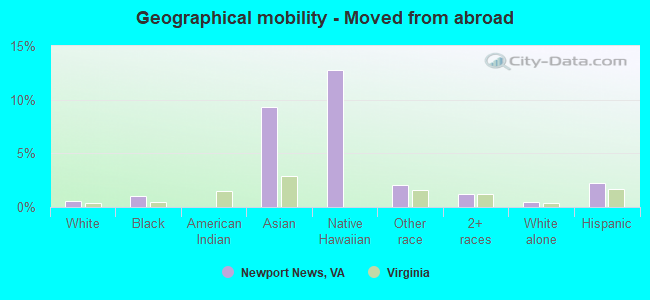
Geographical mobility - Moved from abroad (%)
Geographical mobility - Moved from abroad (%) - White
Geographical mobility - Moved from abroad (%) - Black or African American
Geographical mobility - Moved from abroad (%) - Asian
Geographical mobility - Moved from abroad (%) - Hispanic or Latino
Geographical mobility - Moved from abroad (%) - American Indian and Alaska Native
Geographical mobility - Moved from abroad (%) - Multirace
Geographical mobility - Moved from abroad (%) - Other Race
Place of birth for the foreign-born population - Ireland (%)
Place of birth for the foreign-born population - Denmark (%)
Place of birth for the foreign-born population - Norway (%)
Place of birth for the foreign-born population - Sweden (%)
Place of birth for the foreign-born population - United Kingdom (%)
Place of birth for the foreign-born population - England (%)
Place of birth for the foreign-born population - Scotland (%)
Place of birth for the foreign-born population - Other Northern Europe (%)
Place of birth for the foreign-born population - Austria (%)
Place of birth for the foreign-born population - Belgium (%)
Place of birth for the foreign-born population - France (%)
Place of birth for the foreign-born population - Germany (%)
Place of birth for the foreign-born population - Netherlands (%)
Place of birth for the foreign-born population - Switzerland (%)
Place of birth for the foreign-born population - Other Western Europe (%)
Place of birth for the foreign-born population - Greece (%)
Place of birth for the foreign-born population - Italy (%)
Place of birth for the foreign-born population - Portugal (%)
Place of birth for the foreign-born population - Spain (%)
Place of birth for the foreign-born population - Other Southern Europe (%)
Place of birth for the foreign-born population - Albania (%)
Place of birth for the foreign-born population - Belarus (%)
Place of birth for the foreign-born population - Bosnia and Herzegovina (%)
Place of birth for the foreign-born population - Bulgaria (%)
Place of birth for the foreign-born population - Croatia (%)
Place of birth for the foreign-born population - Czechoslovakia (%)
Place of birth for the foreign-born population - Hungary (%)
Place of birth for the foreign-born population - Latvia (%)
Place of birth for the foreign-born population - Lithuania (%)
Place of birth for the foreign-born population - North Macedonia (Macedonia) (%)
Place of birth for the foreign-born population - Moldova (%)
Place of birth for the foreign-born population - Poland (%)
Place of birth for the foreign-born population - Romania (%)
Place of birth for the foreign-born population - Russia (%)
Place of birth for the foreign-born population - Serbia (%)
Place of birth for the foreign-born population - Ukraine (%)
Place of birth for the foreign-born population - Other Eastern Europe (%)
Place of birth for the foreign-born population - China (%)
Place of birth for the foreign-born population - Hong Kong (%)
Place of birth for the foreign-born population - Taiwan (%)
Place of birth for the foreign-born population - Japan (%)
Place of birth for the foreign-born population - Korea (%)
Place of birth for the foreign-born population - Other Eastern Asia (%)
Place of birth for the foreign-born population - Afghanistan (%)
Place of birth for the foreign-born population - Bangladesh (%)
Place of birth for the foreign-born population - India (%)
Place of birth for the foreign-born population - Iran (%)
Place of birth for the foreign-born population - Kazakhstan (%)
Place of birth for the foreign-born population - Nepal (%)
Place of birth for the foreign-born population - Pakistan (%)
Place of birth for the foreign-born population - Sri Lanka (%)
Place of birth for the foreign-born population - Uzbekistan (%)
Place of birth for the foreign-born population - Other South Central Asia (%)
Place of birth for the foreign-born population - Burma (%)
Place of birth for the foreign-born population - Cambodia (%)
Place of birth for the foreign-born population - Indonesia (%)
Place of birth for the foreign-born population - Laos (%)
Place of birth for the foreign-born population - Malaysia (%)
Place of birth for the foreign-born population - Philippines (%)
Place of birth for the foreign-born population - Singapore (%)
Place of birth for the foreign-born population - Thailand (%)
Place of birth for the foreign-born population - Vietnam (%)
Place of birth for the foreign-born population - Other South Eastern Asia (%)
Place of birth for the foreign-born population - Armenia (%)
Place of birth for the foreign-born population - Iraq (%)
Place of birth for the foreign-born population - Israel (%)
Place of birth for the foreign-born population - Jordan (%)
Place of birth for the foreign-born population - Kuwait (%)
Place of birth for the foreign-born population - Lebanon (%)
Place of birth for the foreign-born population - Saudi Arabia (%)
Place of birth for the foreign-born population - Syria (%)
Place of birth for the foreign-born population - Turkey (%)
Place of birth for the foreign-born population - Yemen (%)
Place of birth for the foreign-born population - Other Western Asia (%)
Place of birth for the foreign-born population - Eritrea (%)
Place of birth for the foreign-born population - Ethiopia (%)
Place of birth for the foreign-born population - Kenya (%)
Place of birth for the foreign-born population - Somalia (%)
Place of birth for the foreign-born population - Uganda (%)
Place of birth for the foreign-born population - Zimbabwe (%)
Place of birth for the foreign-born population - Other Eastern Africa (%)
Place of birth for the foreign-born population - Cameroon (%)
Place of birth for the foreign-born population - Congo (%)
Place of birth for the foreign-born population - Democratic Republic of Congo (Zaire) (%)
Place of birth for the foreign-born population - Other Middle Africa (%)
Place of birth for the foreign-born population - Egypt (%)
Place of birth for the foreign-born population - Morocco (%)
Place of birth for the foreign-born population - Sudan (%)
Place of birth for the foreign-born population - Other Northern Africa (%)
Place of birth for the foreign-born population - South Africa (%)
Place of birth for the foreign-born population - Other Southern Africa (%)
Place of birth for the foreign-born population - Cabo Verde (%)
Place of birth for the foreign-born population - Ghana (%)
Place of birth for the foreign-born population - Liberia (%)
Place of birth for the foreign-born population - Nigeria (%)
Place of birth for the foreign-born population - Senegal (%)
Place of birth for the foreign-born population - Sierra Leone (%)
Place of birth for the foreign-born population - Other Western Africa (%)
Place of birth for the foreign-born population - Australia (%)
Place of birth for the foreign-born population - New Zealand (%)
Place of birth for the foreign-born population - Fiji (%)
Place of birth for the foreign-born population - Micronesia (%)
Place of birth for the foreign-born population - Bahamas (%)
Place of birth for the foreign-born population - Barbados (%)
Place of birth for the foreign-born population - Cuba (%)
Place of birth for the foreign-born population - Dominica (%)
Place of birth for the foreign-born population - Dominican Republic (%)
Place of birth for the foreign-born population - Grenada (%)
Place of birth for the foreign-born population - Haiti (%)
Place of birth for the foreign-born population - Jamaica (%)
Place of birth for the foreign-born population - St. Vincent and the Grenadines (%)
Place of birth for the foreign-born population - Trinidad and Tobago (%)
Place of birth for the foreign-born population - West Indies (%)
Place of birth for the foreign-born population - Other Caribbean (%)
Place of birth for the foreign-born population - Belize (%)
Place of birth for the foreign-born population - Costa Rica (%)
Place of birth for the foreign-born population - El Salvador (%)
Place of birth for the foreign-born population - Guatemala (%)
Place of birth for the foreign-born population - Honduras (%)
Place of birth for the foreign-born population - Mexico (%)
Place of birth for the foreign-born population - Nicaragua (%)
Place of birth for the foreign-born population - Panama (%)
Place of birth for the foreign-born population - Other Central America (%)
Place of birth for the foreign-born population - Argentina (%)
Place of birth for the foreign-born population - Bolivia (%)
Place of birth for the foreign-born population - Brazil (%)
Place of birth for the foreign-born population - Chile (%)
Place of birth for the foreign-born population - Colombia (%)
Place of birth for the foreign-born population - Ecuador (%)
Place of birth for the foreign-born population - Guyana (%)
Place of birth for the foreign-born population - Peru (%)
Place of birth for the foreign-born population - Uruguay (%)
Place of birth for the foreign-born population - Venezuela (%)
Place of birth for the foreign-born population - Other South America (%)
Place of birth for the foreign-born population - Canada (%)
Place of birth for the foreign-born population - Other Northern America (%)
Place of birth for the foreign-born population - Other (%)
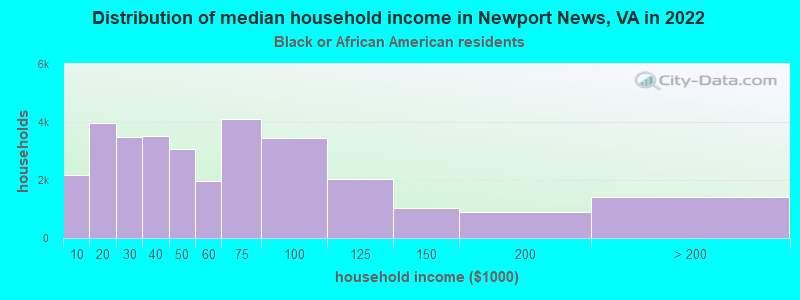
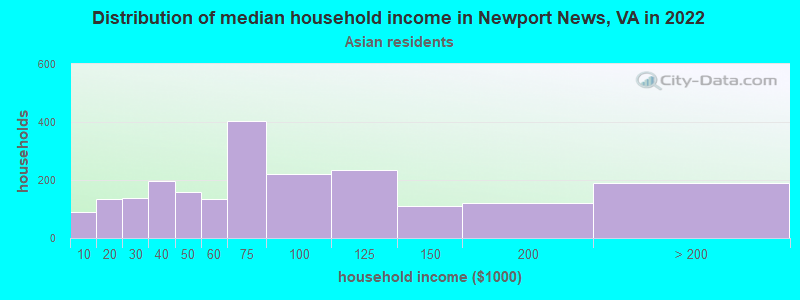
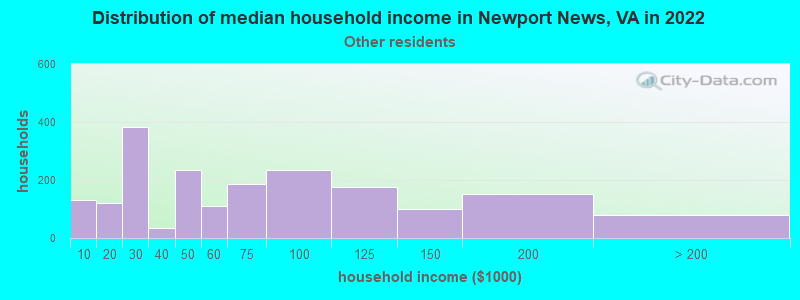
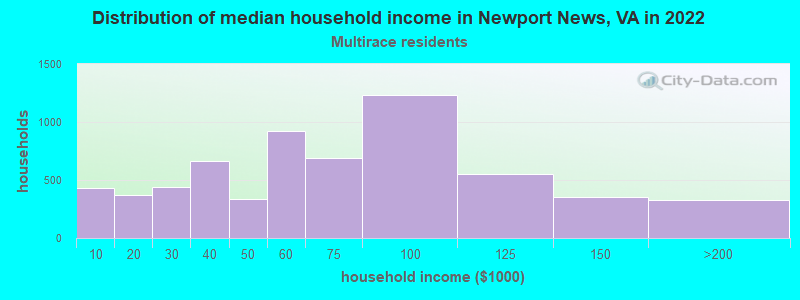
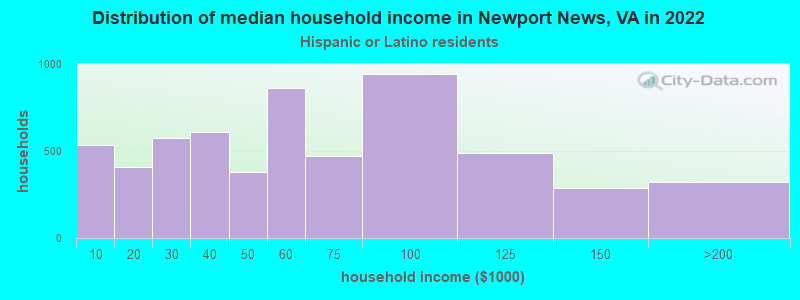
According to 2022 data, the most numerous races in Newport News, VA are White alone (73,358 residents), Black alone (75,176 residents), and Hispanic (19,028 residents). 89.0% of Newport News residents speak English at home. 8.0% of Newport News, VA residents are foreign-born (3.2% born in Latin America, 2.5% born in Asia, 1.4% born in Europe), which is 49.9% less than the foreign-born rate of 12.0% across the entire state of Virginia.
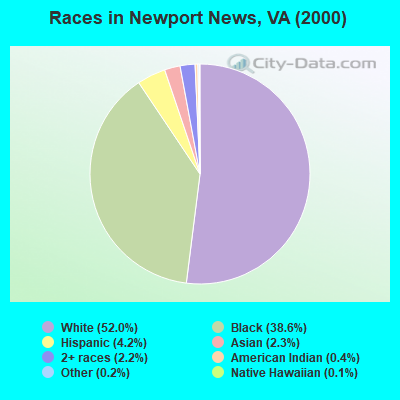
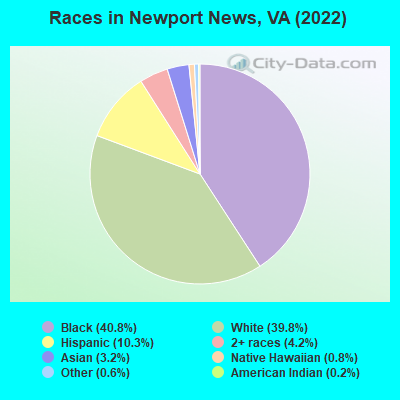
Race distribution in Newport News
2000 2022
93,624 52.0% White alone 69,538 38.6% Black alone 7,595 4.2% Hispanic 4,112 2.3% Asian alone 4,041 2.2% Two or more races 685 0.4% American Indian alone 356 0.2% Other race alone 199 0.1% Native Hawaiian and Other
75,176 40.8% Black alone 73,358 39.8% White alone 19,028 10.3% Hispanic 7,773 4.2% Two or more races 5,919 3.2% Asian alone 1,479 0.8% Native Hawaiian and Other 1,187 0.6% Other race alone 386 0.2% American Indian alone
2000 2022
4,965,637 70.2% White alone 1,376,378 19.4% Black alone 329,540 4.7% Hispanic 259,277 3.7% Asian alone 114,022 1.6% Two or more races 18,596 0.3% American Indian alone 11,685 0.2% Other race alone 3,380 0.05% Native Hawaiian and Other
5,095,130 58.7% White alone 1,594,785 18.4% Black alone 905,750 10.4% Hispanic 602,881 6.9% Asian alone 406,047 4.7% Two or more races 60,419 0.7% Other race alone 11,738 0.1% American Indian alone 6,869 0.08% Native Hawaiian and Other
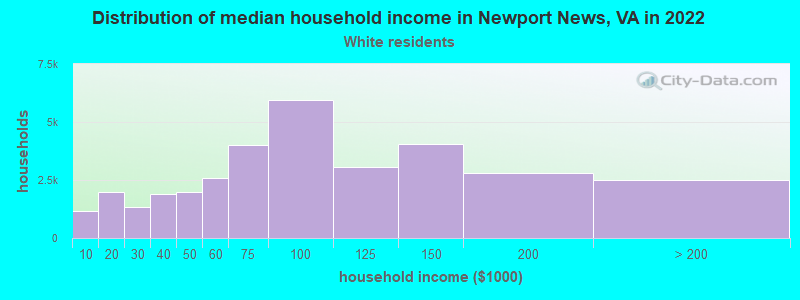
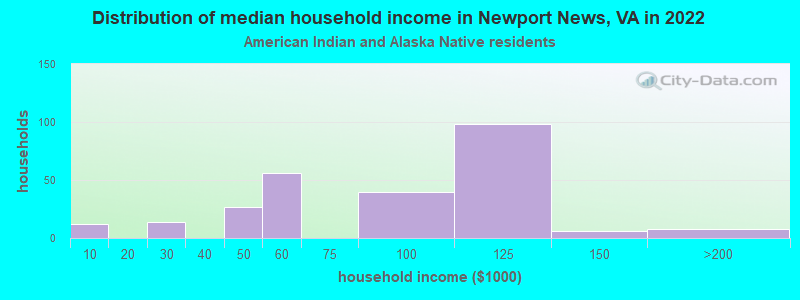
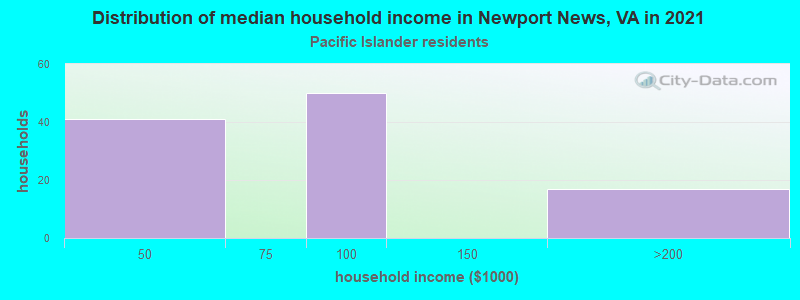
Income and house value in Newport News Median household income in 2022 $80,808 White non-Hispanic householders$47,646 Black householders$46,228 American Indian and Alaska Native householders$54,490 Asian householders$40,782 Some other race householders$59,824 Two or more races householders$51,371 Hispanic or Latino race householdersMedian 2022 house value $254,965 White Non-Hispanic householders$214,815 Black or African American householders$308,157 American Indian or Alaska Native householders $250,617 Asian householders$254,453 Native Hawaiian and other Pacific Islander householders$261,614 Some other race householders$236,552 Two or more races householders$241,411 Hispanic or Latino householders
Median age by race in Newport News
38.4 Median age for White residents36.7 41.3 32.8 Median age for Black or African American residents32.1 34.2 37.8 Median age for American Indian / Alaska Native residents-666,666,666.0 -666,666,666.0 39.0 Median age for Asian residents34.5 46.4 16.4 Median age for Native Hawaiian / Pacific Islander residents13.9 21.2 27.7 Median age for Other race residents26.2 36.5 28.3 Median age for Two or more races residents29.2 27.1 38.8 Median age for White alone residents36.8 42.4 27.2 Median age for Hispanic or Latino residents26.8 27.8
Owner/renter occupied households by race in Newport News
House owners and renters - White residents 23,313 69.9% Owner occupied10,018 30.1% Renter occupiedHouse owners and renters - Black or African American residents 10,215 32.8% Owner occupied20,893 67.2% Renter occupiedHouse owners and renters - American Indian / Alaska Native residents 141 55.5% Owner occupied113 44.5% Renter occupiedHouse owners and renters - Asian residents 1,407 59.1% Owner occupied975 40.9% Renter occupiedHouse owners and renters - Native Hawaiian / Pacific Islander residents 69 83.6% Owner occupied14 16.4% Renter occupiedHouse owners and renters - Other race residents 623 35.4% Owner occupied1,136 64.6% Renter occupiedHouse owners and renters - Two or more races residents 1,839 29.1% Owner occupied4,473 70.9% Renter occupiedHouse owners and renters - White alone residents 22,850 70.0% Owner occupied9,797 30.0% Renter occupiedHouse owners and renters - Hispanic or Latino residents 1,840 31.3% Owner occupied4,037 68.7% Renter occupied
Language usage in Newport News
English speakers - Total 89.0% of residents of Newport News speak English at home.
6.3% of residents speak Spanish at home 7,062 65.7% Speak English very well3,685 34.3% Speak English less than very well4.8% of residents speak other language at home 5,073 61.9% Speak English very well3,116 38.1% Speak English less than very well
English speakers - Born in the United States 94.2% of residents of Newport News speak English at home.
4.3% of residents speak Spanish at home 2,423 86.3% Speak English very well385 13.7% Speak English less than very well1.5% of residents speak other language at home 789 81.0% Speak English very well185 19.0% Speak English less than very well
English speakers - Native, born elsewhere 75.9% of residents of Newport News speak English at home.
18.4% of residents speak Spanish at home 505 45.7% Speak English very well599 54.3% Speak English less than very well5.7% of residents speak other language at home 275 79.7% Speak English very well70 20.3% Speak English less than very well
English speakers - Foreign-born 24.3% of residents of Newport News speak English at home.
35.0% of residents speak Spanish at home 2,914 56.3% Speak English very well2,258 43.7% Speak English less than very well40.7% of residents speak other language at home 3,472 57.6% Speak English very well2,553 42.4% Speak English less than very well
White (Caucasian) - Speak only English Native:
97.0% (66,739)Foreign-born:
55.9% (1,611)
White (Caucasian) - Speak another language Native:
3.0% (2,041)Foreign-born:
44.1% (1,270)
Black or African American - Speak only English Native:
98.4% (66,826)Foreign-born:
44.5% (842)
Black or African American - Speak another language Native:
1.5% (1,042)Foreign-born:
52.3% (989)
American Indian / Alaska Native - Speak another language Native:
4.3% (14)Foreign-born:
100.0% (13)
Asian - Speak only English Native:
60.9% (853)Foreign-born:
4.8% (197)
Asian - Speak another language Native:
39.1% (547)Foreign-born:
95.2% (3,915)
Native Hawaiian / Pacific Islander - Speak another language Native:
71.5% (163)Foreign-born:
49.7% (11)
Other race - Speak only English Native:
53.0% (1,533)Foreign-born:
13.6% (155)
Other race - Speak another language Native:
47.0% (1,357)Foreign-born:
86.4% (981)
Two or more races - Speak only English Native:
80.5% (11,335)Foreign-born:
11.2% (547)
Two or more races - Speak another language Native:
19.5% (2,750)Foreign-born:
88.8% (4,339)
White alone - Speak only English Native:
98.2% (65,930)Foreign-born:
57.3% (1,530)
White alone - Speak another language Native:
1.8% (1,175)Foreign-born:
42.7% (1,140)
Hispanic or Latino - Speak only English Native:
61.7% (7,127)Foreign-born:
9.4% (514)
Hispanic or Latino - Speak another language Native:
38.3% (4,416)Foreign-born:
90.6% (4,952)
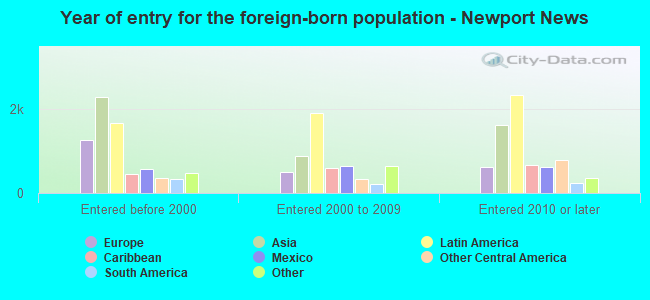
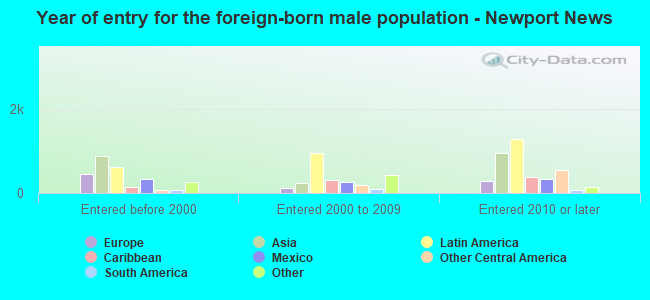
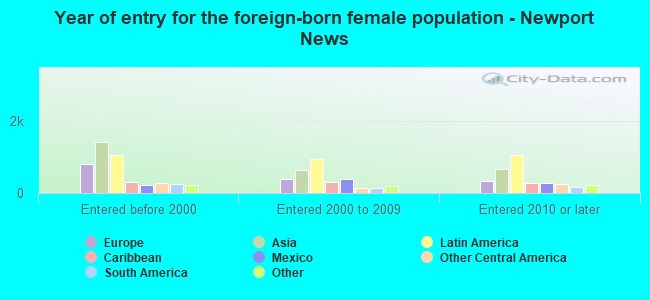
Foreign-born residents in Newport News 14,755 residents are foreign born (3.2% Latin America , 2.5% Asia , 1.4% Europe ).
This city:
8.0%Virginia:
12.6%
Marital status for residents in Newport News Marital status - White (Caucasian) population 15 years and over
Males 36.1% Never married48.1% Now married1.1% Separated4.2% Widowed10.4% DivorcedFemales 22.3% Never married51.9% Now married0.7% Separated11.2% Widowed13.9% DivorcedWomen who gave birth in the past 12 months Now married:
69.5% (937)Unmarried:
30.5% (411)
Women who did not give birth in the past 12 months Now married:
47.4% (7,587)Unmarried:
52.6% (8,430)
Marital status - Black or African American population 15 years and over
Males 53.6% Never married29.9% Now married4.7% Separated4.1% Widowed7.8% DivorcedFemales 51.3% Never married21.4% Now married4.5% Separated5.5% Widowed17.3% DivorcedWomen who gave birth in the past 12 months Now married:
21.3% (175)Unmarried:
78.7% (647)
Women who did not give birth in the past 12 months Now married:
21.2% (4,118)Unmarried:
78.8% (15,305)
Marital status - American Indian / Alaska Native population 15 years and over
Males 43.5% Never married38.8% Now married0.0% Separated10.0% Widowed7.6% DivorcedFemales 22.9% Never married39.2% Now married0.0% Separated6.0% Widowed31.9% DivorcedWomen who did not give birth in the past 12 months Now married:
86.0% (52)Unmarried:
14.0% (9)
Marital status - Asian population 15 years and over
Males 22.6% Never married69.0% Now married0.0% Separated3.0% Widowed5.4% DivorcedFemales 11.2% Never married57.3% Now married0.0% Separated27.9% Widowed3.6% DivorcedWomen who gave birth in the past 12 months Now married:
100.0% (166)Unmarried:
0.0% (0)
Women who did not give birth in the past 12 months Now married:
63.8% (796)Unmarried:
36.2% (452)
Marital status - Native Hawaiian / Pacific Islander population 15 years and over
Males 21.7% Never married78.3% Now married0.0% Separated0.0% Widowed0.0% DivorcedFemales 10.2% Never married89.8% Now married0.0% Separated0.0% Widowed0.0% DivorcedWomen who did not give birth in the past 12 months Now married:
89.8% (112)Unmarried:
10.2% (13)
Marital status - Other race population 15 years and over
Males 39.8% Never married49.6% Now married3.2% Separated0.0% Widowed7.4% DivorcedFemales 43.8% Never married38.1% Now married2.7% Separated1.6% Widowed13.8% DivorcedWomen who gave birth in the past 12 months Now married:
83.3% (66)Unmarried:
16.7% (13)
Women who did not give birth in the past 12 months Now married:
36.9% (651)Unmarried:
63.1% (1,113)
Marital status - Two or more races population 15 years and over
Males 56.0% Never married33.1% Now married2.2% Separated1.9% Widowed6.8% DivorcedFemales 49.1% Never married33.2% Now married7.4% Separated0.8% Widowed9.4% DivorcedWomen who gave birth in the past 12 months Now married:
68.7% (126)Unmarried:
31.3% (57)
Women who did not give birth in the past 12 months Now married:
35.7% (2,092)Unmarried:
64.3% (3,770)
Marital status - White alone, not Hispanic / Latino population 15 years and over
Males 35.9% Never married48.6% Now married1.2% Separated3.6% Widowed10.7% DivorcedFemales 22.3% Never married51.6% Now married0.7% Separated11.5% Widowed13.9% DivorcedWomen who gave birth in the past 12 months Now married:
73.3% (937)Unmarried:
26.7% (342)
Women who did not give birth in the past 12 months Now married:
46.4% (7,227)Unmarried:
53.6% (8,349)
Marital status - Hispanic or Latino population 15 years and over
Males 49.2% Never married40.2% Now married2.4% Separated4.4% Widowed3.8% DivorcedFemales 37.7% Never married45.8% Now married5.1% Separated0.0% Widowed11.4% DivorcedWomen who gave birth in the past 12 months Now married:
71.8% (176)Unmarried:
28.2% (69)
Women who did not give birth in the past 12 months Now married:
40.0% (1,885)Unmarried:
60.0% (2,824)
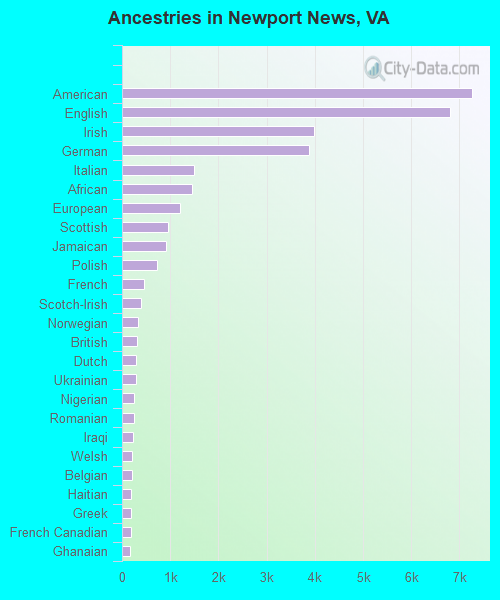
Ancestries in Newport News
7,251 7.1% American6,797 6.7% English3,985 3.9% Irish3,872 3.8% German1,485 1.5% Italian1,462 1.4% African1,193 1.2% European946 0.9% Scottish917 0.9% Jamaican733 0.7% Polish465 0.5% French402 0.4% Scotch-Irish323 0.3% Norwegian311 0.3% British296 0.3% Dutch285 0.3% Ukrainian251 0.2% Nigerian243 0.2% Romanian226 0.2% Iraqi215 0.2% Welsh199 0.2% Belgian195 0.2% Haitian192 0.2% Greek183 0.2% French Canadian159 0.2% Ghanaian155 0.2% Turkish130 0.1% Swedish126 0.1% Brazilian124 0.1% Czech121 0.1% Egyptian116 0.1% Canadian116 0.1% Russian113 0.1% Cape Verdean106 0.1% U.S. Virgin Islander105 0.1% Scandinavian102 0.1% Israeli91 0.09% Hungarian87 0.09% British West Indian81 0.08% Sudanese72 0.07% Croatian70 0.07% Serbian63 0.06% Austrian58 0.06% Eastern European58 0.06% Trinidadian and Tobagonian53 0.05% Palestinian52 0.05% Northern European51 0.05% Lithuanian51 0.05% Portuguese49 0.05% Bulgarian45 0.04% Slovene45 0.04% Bahamian43 0.04% Yugoslavian42 0.04% Armenian38 0.04% Ethiopian37 0.04% Iranian37 0.04% Finnish36 0.04% Czechoslovakian34 0.03% Danish33 0.03% Guyanese33 0.03% Kenyan30 0.03% Basque30 0.03% Alsatian29 0.03% Afghan29 0.03% West Indian22 0.02% Assyrian13 0.01% Cypriot12 0.01% Pennsylvania German12 0.01% Lebanese11 0.01% Slovak9 0.01% Liberian9 0.01% Arab
Geographical mobility in Newport News Same house 1 year ago 63,878 85.5% White (Caucasian)62,485 83.8% Black or African American342 93.0% American Indian / Alaska Native4,561 77.5% Asian199 70.5% Native Hawaiian / Pacific Islander5,493 91.0% Other race17,243 83.3% Two or more races61,958 85.4% White alone, not Hispanic / Latino14,856 79.5% Hispanic or LatinoMoved within same county 3,839 5.1% White / Caucasian4,662 6.3% Black or African American21 5.6% American Indian / Alaska Native109 1.9% Asian40 14.2% Native Hawaiian / Pacific Islander169 2.8% Other race232 1.1% Two or more races3,753 5.2% White alone, not Hispanic / Latino635 3.4% Hispanic or LatinoMoved within same state 4,520 6.1% White / Caucasian5,774 7.7% Black or African American1 0.3% American Indian / Alaska Native246 4.2% Asian115 1.9% Other race1,988 9.6% Two or more races4,419 6.1% White alone, not Hispanic / Latino1,544 8.3% Hispanic or LatinoMoved from different state 2,027 2.7% White / Caucasian824 1.1% Black or African American418 7.1% Asian187 3.1% Other race991 4.8% Two or more races2,027 2.8% White alone, not Hispanic / Latino1,247 6.7% Hispanic or LatinoMoved from abroad 425 0.6% White798 1.1% Black or African American548 9.3% Asian36 12.7% Native Hawaiian / Pacific Islander124 2.1% Other race243 1.2% Two or more races353 0.5% White alone, not Hispanic / Latino415 2.2% Hispanic or Latino
Children Nativity (place of birth) in Newport News
Children under 6 years - Living with two parents Both parents native 6,830 100.0% NativeBoth parents foreign-born 618 76.6% Native189 23.4% Foreign-bornOne native, one foreign-born parent 264 100.0% NativeChildren under 6 years - Living with one parent Native parent 4,958 100.0% NativeForeign-born parent 1,140 100.0% NativeChildren 6 to 17 years - Living with two parents Both parents native 10,140 100.0% NativeBoth parents foreign-born 996 84.5% Native183 15.5% Foreign-bornOne native, one foreign-born parent 1,204 100.0% NativeChildren 6 to 17 years - Living with one parent Native parent 9,544 100.0% NativeForeign-born parent 1,550 54.5% Native1,293 45.5% Foreign-born
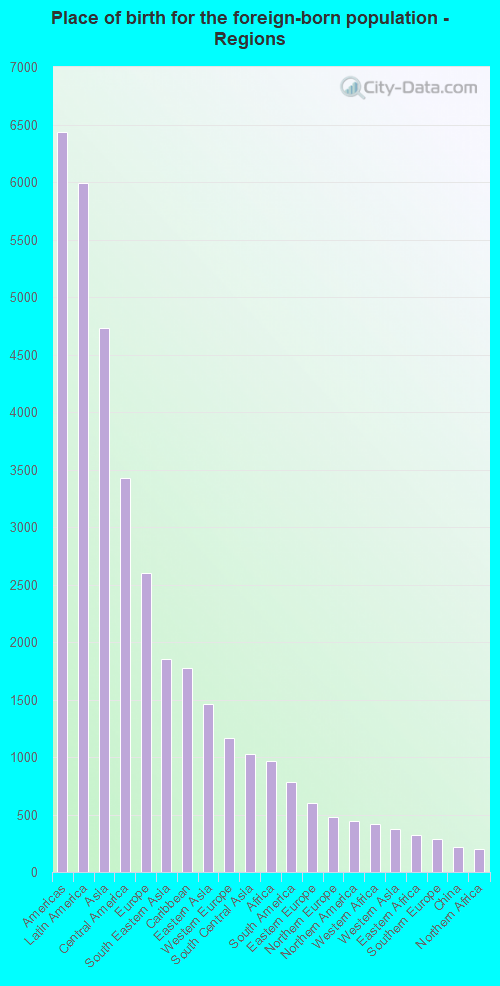
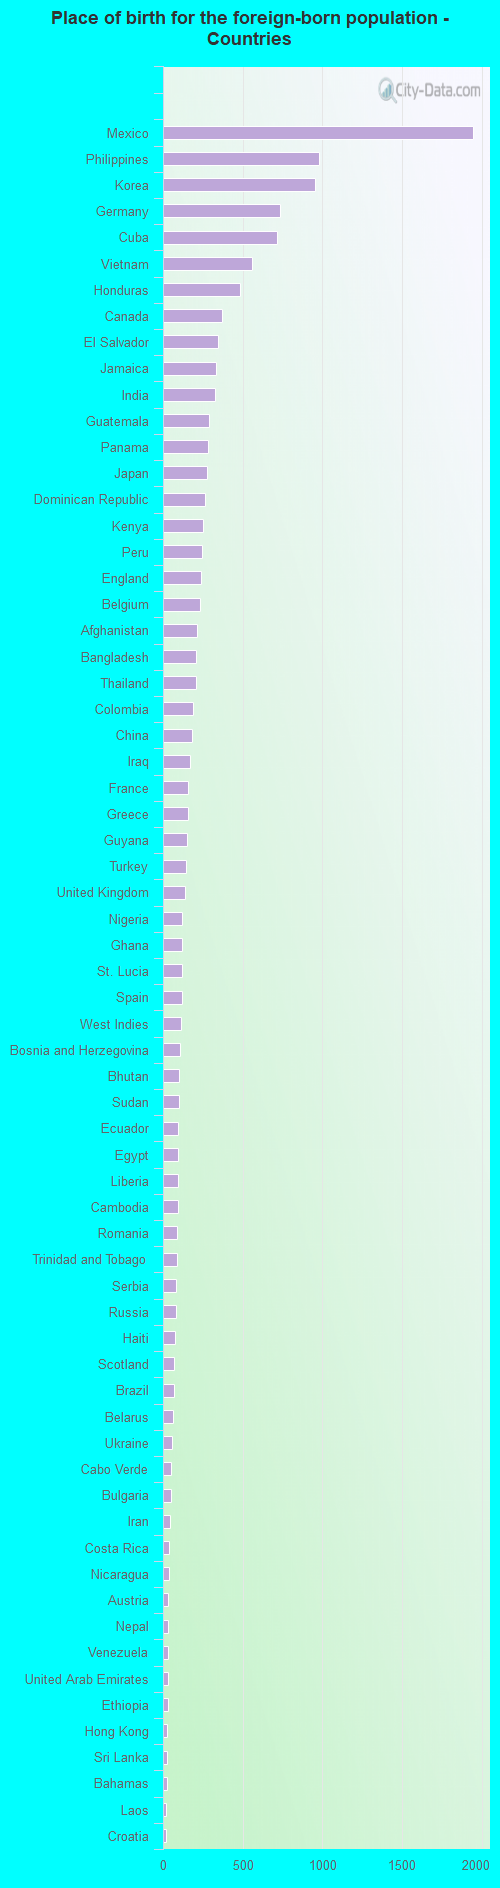
Place of birth for residents in Newport News 6,434 Americas5,987 Latin America4,728 Asia3,429 Central America2,604 Europe1,854 South Eastern Asia1,777 Caribbean1,458 Eastern Asia1,167 Western Europe1,024 South Central Asia969 Africa779 South America600 Eastern Europe482 Northern Europe447 Northern America415 Western Africa376 Western Asia319 Eastern Africa287 Southern Europe218 China199 Northern Africa18 Oceania11 Southern Africa9 Middle Africa1,949 Mexico978 Philippines954 Korea733 Germany713 Cuba556 Vietnam483 Honduras371 Canada345 El Salvador330 Jamaica329 India288 Guatemala284 Panama274 Japan261 Dominican Republic249 Kenya242 Peru240 England231 Belgium215 Afghanistan208 Bangladesh205 Thailand187 Colombia181 China171 Iraq156 France155 Greece149 Guyana144 Turkey140 United Kingdom120 Nigeria120 Ghana119 St. Lucia119 Spain112 West Indies108 Bosnia and Herzegovina101 Bhutan98 Sudan97 Ecuador96 Egypt95 Liberia92 Cambodia88 Romania87 Trinidad and Tobago80 Serbia79 Russia75 Haiti72 Scotland72 Brazil61 Belarus59 Ukraine52 Cabo Verde52 Bulgaria44 Iran40 Costa Rica37 Nicaragua34 Austria34 Nepal31 Venezuela31 United Arab Emirates29 Ethiopia28 Hong Kong26 Sri Lanka26 Bahamas21 Laos19 Croatia16 Sierra Leone16 Armenia14 Czechoslovakia13 Denmark12 Eritrea12 Italy12 Netherlands11 Sweden11 Micronesia11 South Africa10 Ivory Coast9 Pakistan9 Cameroon9 Moldova9 Hungary8 Taiwan8 Dominica8 Tanzania8 Georgia8 Poland7 Fiji5 Norway5 Israel
Grandparents responsible for own grandchildren in Newport News
Grandparents (30 to 59 years) White / Caucasian 27 13.2% Responsible for grandchildren178 86.8% Not responsible for grandchildrenBlack or African American 480 55.0% Responsible for grandchildren393 45.0% Not responsible for grandchildrenAsian 43 79.9% Responsible for grandchildren11 20.1% Not responsible for grandchildrenOther race 88 81.4% Responsible for grandchildren20 18.6% Not responsible for grandchildrenTwo or more races 122 33.6% Responsible for grandchildren241 66.4% Not responsible for grandchildrenWhite alone, not Hispanic / Latino 27 13.2% Responsible for grandchildren178 86.8% Not responsible for grandchildrenHispanic or Latino 74 34.6% Responsible for grandchildren140 65.4% Not responsible for grandchildrenGrandparents (60 years and over) White / Caucasian 342 35.2% Responsible for grandchildren629 64.8% Not responsible for grandchildrenBlack or African American 391 55.8% Responsible for grandchildren310 44.2% Not responsible for grandchildrenAsian 30 20.5% Responsible for grandchildren117 79.5% Not responsible for grandchildrenTwo or more races 22 21.7% Responsible for grandchildren80 78.3% Not responsible for grandchildrenWhite alone, not Hispanic / Latino 342 35.2% Responsible for grandchildren629 64.8% Not responsible for grandchildrenHispanic or Latino 113 100.0% Not responsible for grandchildren