Races in Normandy Park, Washington (WA) Detailed Stats
Ancestries, Foreign-born residents, place of birth
Settings
X


Recent posts about races in Normandy Park, Washington on our local forum with over 2,400,000 registered users:
 | Empty Nest Advice (14 replies) |
| Job opportunity near Orillia - where to live? (23 replies) |
| 55+ communities in Kent or surrounding area? (13 replies) |
| Love West Seattle, but it's changing and becoming too expensive. Where to go? (33 replies) |
| Thinking about moving to Seattle to raise my family (21 replies) |
| Would Burien or West Seattle be a good fit for us? (31 replies) |
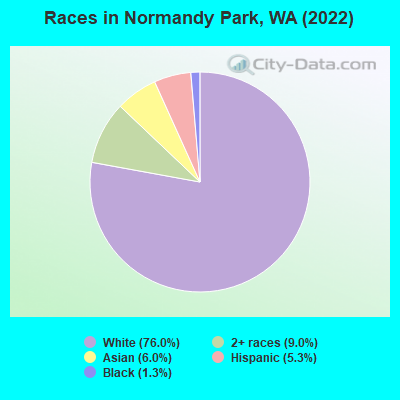
According to 2022 data, the most numerous races in Normandy Park, WA are White alone (5,120 residents), Hispanic (358 residents), and Asian alone (403 residents). 85.8% of Normandy Park residents speak English at home. 10.2% of Normandy Park, WA residents are foreign-born (3.4% born in Asia, 3.1% born in Europe, 1.4% born in Latin America, 1.1% born in Africa), which is 46.6% less than the foreign-born rate of 15.0% across the entire state of Washington.
Race distribution in Normandy Park
2000
2022

- 5,69589.1%White alone
- 2944.6%Asian alone
- 1562.4%Hispanic
- 1402.2%Two or more races
- 641.0%Black alone
- 210.3%American Indian alone
- 150.2%Native Hawaiian and Other
Pacific Islander alone - 70.1%Other race alone

-
- 5,12076.0%White alone
- 6049.0%Two or more races
- 4036.0%Asian alone
- 3585.3%Hispanic
- 861.3%Black alone
2000
2022
-
- 4,652,49078.9%White alone
- 441,5097.5%Hispanic
- 319,4015.4%Asian alone
- 184,6313.1%Black alone
- 175,9263.0%Two or more races
- 85,3961.4%American Indian alone
- 22,7790.4%Native Hawaiian and Other
Pacific Islander alone - 11,9890.2%Other race alone

-
- 4,941,45663.5%White alone
- 1,093,31314.0%Hispanic
- 755,8329.7%Asian alone
- 523,4486.7%Two or more races
- 299,5373.8%Black alone
- 69,0240.9%American Indian alone
- 52,2310.7%Native Hawaiian and Other
Pacific Islander alone - 50,9450.7%Other race alone

Income and house value in Normandy Park
- Median household income in 2022
- $123,545White non-Hispanic householders
- over $200,000Two or more races householders
- Median 2022 house value
- $987,821White Non-Hispanic householders
- over $1,000,000Black or African American householders
- $892,617Asian householders
- over $1,000,000Some other race householders
- over $1,000,000Two or more races householders
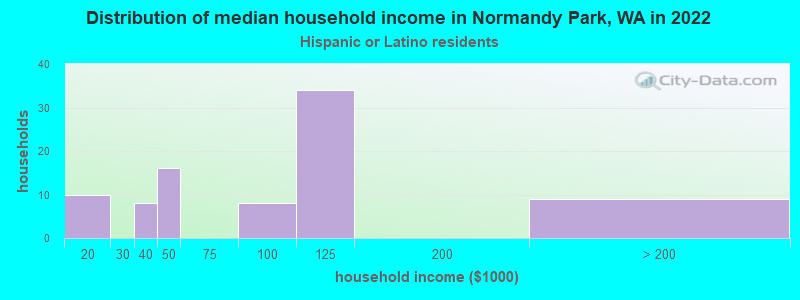
- over $1,000,000Hispanic or Latino householders
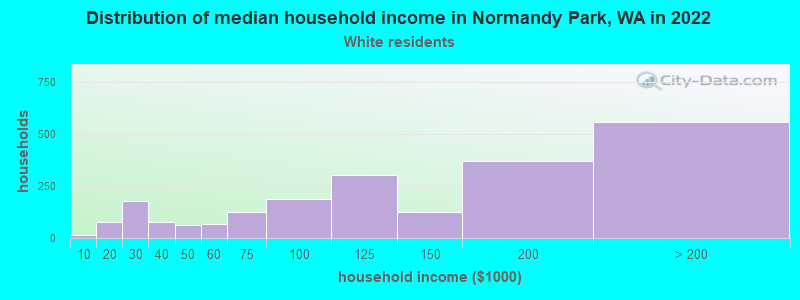
Household income for White non-Hispanic householders
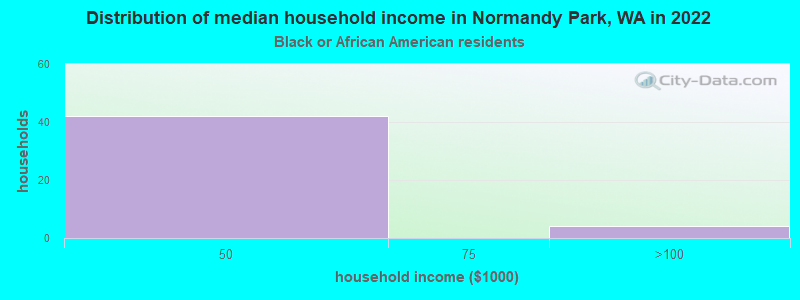
Household income for Black householders
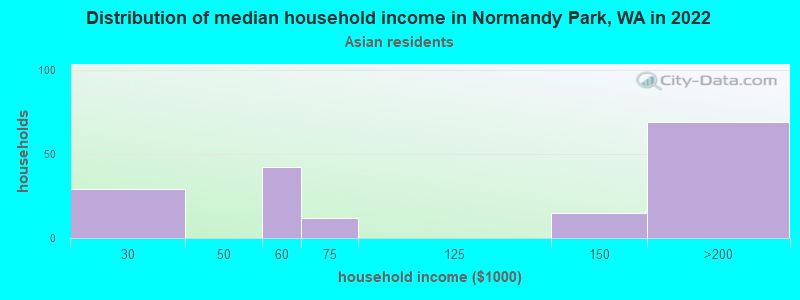
Household income for Asian householders
Household income for Some other race householders
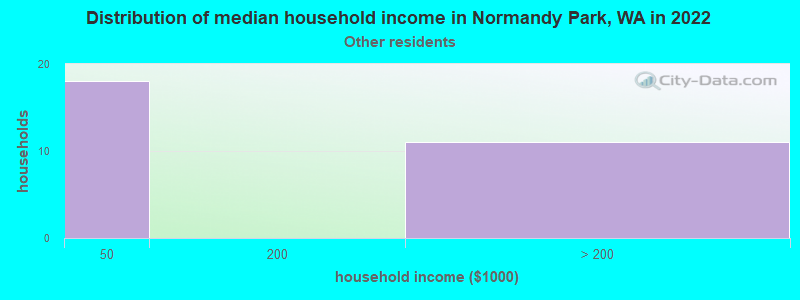
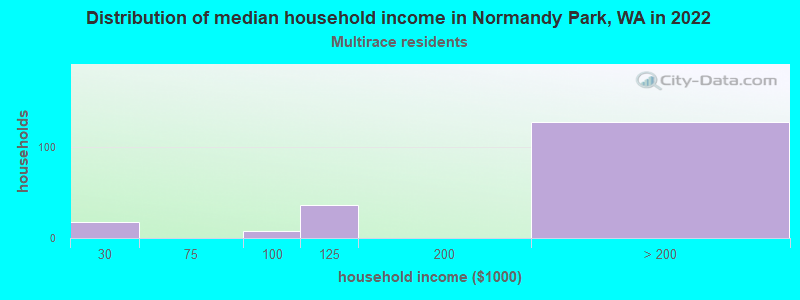
Household income for Two or more races householders
Household income for Hispanic or Latino race householders
Median age by race in Normandy Park
- 49.6Median age for White residents
- 47.9Males
- 50.6Females
- 59.9Median age for Black or African American residents
- 66.2Males
- -697,247,705.7Females
- -639,412,997.3Median age for American Indian / Alaska Native residents
- -658,092,175.1Males
- -631,249,999.4Females
- 60.3Median age for Asian residents
- 59.8Males
- 67.0Females
- -653,927,812.5Median age for Native Hawaiian / Pacific Islander residents
- -664,509,168.7Males
- -651,945,320.1Females
- 18.0Median age for Other race residents
- 3.5Males
- 34.4Females
- 31.0Median age for Two or more races residents
- 18.2Males
- 32.3Females
- 49.5Median age for White alone residents
- 47.9Males
- 50.5Females
- 26.2Median age for Hispanic or Latino residents
- 18.5Males
- 32.8Females
Owner/renter occupied households by race in Normandy Park
- House owners and renters - White residents
- 1,75981.6%Owner occupied
- 39618.4%Renter occupied
- House owners and renters - Black or African American residents
- 410.3%Owner occupied
- 3489.7%Renter occupied
- House owners and renters - Asian residents
- 165100.0%Owner occupied
- House owners and renters - Other race residents
- 922.5%Owner occupied
- 3077.5%Renter occupied
- House owners and renters - Two or more races residents
- 12568.0%Owner occupied
- 5932.0%Renter occupied
- House owners and renters - White alone residents
- 1,77882.4%Owner occupied
- 37917.6%Renter occupied
- House owners and renters - Hispanic or Latino residents
- 88.4%Owner occupied
- 9291.6%Renter occupied
Language usage in Normandy Park
- English speakers - Total
- 85.8% of residents of Normandy Park speak English at home.
- 3.7% of residents speak Spanish at home
- 18479.3%Speak English very well
- 4820.7%Speak English less than very well
- 8.8% of residents speak other language at home
- 45081.7%Speak English very well
- 10118.3%Speak English less than very well
- English speakers - Born in the United States
- 92.8% of residents of Normandy Park speak English at home.
- 4.1% of residents speak Spanish at home
- 75100.0%Speak English very well
- 2.8% of residents speak other language at home
- 51100.0%Speak English very well
- English speakers - Native, born elsewhere
- 28.2% of residents of Normandy Park speak English at home.
- 78.6% of residents speak other language at home
- 81100.0%Speak English very well
- English speakers - Foreign-born
- 24.1% of residents of Normandy Park speak English at home.
- 14.4% of residents speak Spanish at home
- 6767.7%Speak English very well
- 3232.3%Speak English less than very well
- 61.7% of residents speak other language at home
- 32576.5%Speak English very well
- 10023.5%Speak English less than very well
White (Caucasian) - Speak only English
| Native: | 96.3% (4,447) |
| Foreign-born: | 35.6% (91) |
White (Caucasian) - Speak another language
| Native: | 3.7% (171) |
| Foreign-born: | 64.3% (164) |
Black or African American - Speak only English
| Native: | 100.0% (9) |
| Foreign-born: | 65.5% (50) |
Asian - Speak only English
| Native: | 94.3% (154) |
| Foreign-born: | 9.2% (23) |
Other race - Speak another language
| Native: | 78.3% (43) |
| Foreign-born: | 100.0% (82) |
White alone - Speak only English
| Native: | 96.1% (4,473) |
| Foreign-born: | 35.9% (92) |
White alone - Speak another language
| Native: | 3.9% (182) |
| Foreign-born: | 63.5% (163) |
Hispanic or Latino - Speak another language
| Native: | 35.0% (55) |
| Foreign-born: | 100.0% (95) |
Foreign-born residents in Normandy Park
689 residents are foreign born (3.4% Asia, 3.1% Europe, 1.4% Latin America, 1.1% Africa).
| This city: | 10.2% |
| Washington: | 14.9% |


Marital status for residents in Normandy Park
Marital status - White (Caucasian) population 15 years and over
- Males
- 19.6%Never married
- 63.5%Now married
- 0.0%Separated
- 2.2%Widowed
- 14.6%Divorced
- Females
- 18.0%Never married
- 66.6%Now married
- 0.5%Separated
- 7.1%Widowed
- 7.8%Divorced
Women who gave birth in the past 12 months
| Now married: | 100.0% (112) |
| Unmarried: | 0.0% (0) |
Women who did not give birth in the past 12 months
| Now married: | 48.4% (354) |
| Unmarried: | 51.6% (378) |
Marital status - Black or African American population 15 years and over
- Males
- 0.0%Never married
- 8.7%Now married
- 0.0%Separated
- 0.0%Widowed
- 91.3%Divorced
- Females
- 100.0%Never married
- 0.0%Now married
- 0.0%Separated
- 0.0%Widowed
- 0.0%Divorced
Women who did not give birth in the past 12 months
| Now married: | 0.0% (0) |
| Unmarried: | 100.0% (20) |
Marital status - Asian population 15 years and over
- Males
- 29.1%Never married
- 64.5%Now married
- 0.0%Separated
- 0.0%Widowed
- 6.4%Divorced
- Females
- 0.0%Never married
- 100.0%Now married
- 0.0%Separated
- 0.0%Widowed
- 0.0%Divorced
Marital status - Other race population 15 years and over
- Males
- 77.8%Never married
- 22.2%Now married
- 0.0%Separated
- 0.0%Widowed
- 0.0%Divorced
- Females
- 17.7%Never married
- 14.5%Now married
- 0.0%Separated
- 0.0%Widowed
- 67.7%Divorced
Women who did not give birth in the past 12 months
| Now married: | 0.0% (0) |
| Unmarried: | 100.0% (46) |
Marital status - Two or more races population 15 years and over
- Males
- 29.6%Never married
- 70.4%Now married
- 0.0%Separated
- 0.0%Widowed
- 0.0%Divorced
- Females
- 28.5%Never married
- 71.5%Now married
- 0.0%Separated
- 0.0%Widowed
- 0.0%Divorced
Women who gave birth in the past 12 months
| Now married: | 0.0% (0) |
| Unmarried: | 100.0% (14) |
Women who did not give birth in the past 12 months
| Now married: | 73.2% (177) |
| Unmarried: | 26.8% (65) |
Marital status - White alone, not Hispanic / Latino population 15 years and over
- Males
- 19.9%Never married
- 63.1%Now married
- 0.0%Separated
- 2.2%Widowed
- 14.8%Divorced
- Females
- 18.2%Never married
- 66.8%Now married
- 0.5%Separated
- 7.2%Widowed
- 7.3%Divorced
Women who gave birth in the past 12 months
| Now married: | 100.0% (105) |
| Unmarried: | 0.0% (0) |
Women who did not give birth in the past 12 months
| Now married: | 48.4% (365) |
| Unmarried: | 51.6% (390) |
Marital status - Hispanic or Latino population 15 years and over
- Males
- 49.3%Never married
- 50.7%Now married
- 0.0%Separated
- 0.0%Widowed
- 0.0%Divorced
- Females
- 22.7%Never married
- 40.0%Now married
- 0.0%Separated
- 0.0%Widowed
- 37.3%Divorced
Women who gave birth in the past 12 months
| Now married: | 100.0% (11) |
| Unmarried: | 0.0% (0) |
Women who did not give birth in the past 12 months
| Now married: | 36.8% (36) |
| Unmarried: | 63.2% (62) |
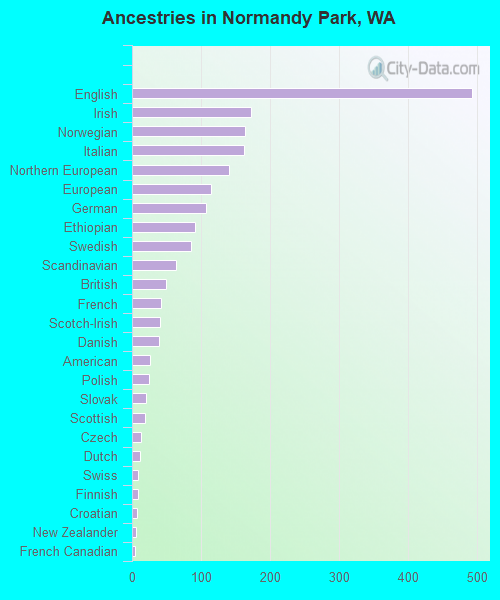
Ancestries in Normandy Park

- 49319.6%English
- 1726.8%Irish
- 1646.5%Norwegian
- 1626.5%Italian
- 1415.6%Northern European
- 1154.6%European
- 1074.3%German
- 923.7%Ethiopian
- 863.4%Swedish
- 642.5%Scandinavian
- 492.0%British
- 421.7%French
- 411.6%Scotch-Irish
- 391.6%Danish
- 261.0%American
- 251.0%Polish
- 210.8%Slovak
- 190.8%Scottish
- 130.5%Czech
- 110.4%Dutch
- 90.4%Swiss
- 80.3%Finnish
- 70.3%Croatian
- 60.2%New Zealander
- 50.2%French Canadian
Geographical mobility in Normandy Park

- Same house 1 year ago
- 4,49789.9%White (Caucasian)
- 7790.4%Black or African American
- 40199.2%Asian
- 7133.6%Other race
- 71298.1%Two or more races
- 4,58790.7%White alone, not Hispanic / Latino
- 14644.2%Hispanic or Latino

-
- Moved within same county
- 4248.5%White / Caucasian
- 13965.8%Other race
- 212.9%Two or more races
- 4188.3%White alone, not Hispanic / Latino
- 13340.1%Hispanic or Latino

-
- Moved within same state
- 140.3%White / Caucasian
- 1416.2%Black or African American
- 150.3%White alone, not Hispanic / Latino

-
- Moved from different state
- 541.1%White / Caucasian
- 60.9%Two or more races
- 210.4%White alone, not Hispanic / Latino
- 4814.6%Hispanic or Latino

-
- Moved from abroad
- 240.5%White
- 260.5%White alone, not Hispanic / Latino

Children Nativity (place of birth) in Normandy Park
Place of birth for residents in Normandy Park
![Place of birth for the foreign-born population - Regions]()
- 241Asia
- 221Europe
- 203South Eastern Asia
- 126Eastern Europe
- 126Americas
- 98Latin America
- 87Central America
- 78Africa
- 74Eastern Africa
- 69Northern Europe
- 37Eastern Asia
- 37China
- 28Northern America
- 25Western Europe
- 22Oceania
- 22Australia and New Zealand Subregion
- 11South America
- 4Southern Africa

![Place of birth for the foreign-born population - Countries]()
- 115Vietnam
- 109Bosnia and Herzegovina
- 88Philippines
- 74Ethiopia
- 69Mexico
- 38England
- 37Hong Kong
- 28Canada
- 17Czechoslovakia
- 17Costa Rica
- 16Sweden
- 13Scotland
- 12Netherlands
- 12Australia
- 11Colombia
- 9New Zealand
- 8France
- 4Germany
- 4South Africa

Zip codes: 98166.