Races in North Aurora, Illinois (IL) Detailed Stats
Data:
Races - White alone (%)
Races - White alone (% change since 2000)
Races - Black alone (%)
Races - Black alone (% change since 2000)
Races - American Indian alone (%)
Races - American Indian alone (% change since 2000)
Races - Asian alone (%)
Races - Asian alone (% change since 2000)
Races - Hispanic (%)
Races - Hispanic (% change since 2000)
Races - Native Hawaiian and Other Pacific Islander alone (%)
Races - Native Hawaiian and Other Pacific Islander alone (% change since 2000)
Races - Two or more races(%)
Races - Two or more races(% change since 2000)
Races - Other race alone (%)
Races - Other race alone (% change since 2000)
Racial diversity
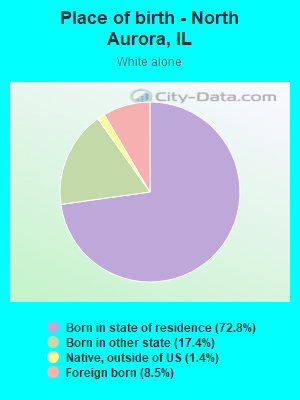
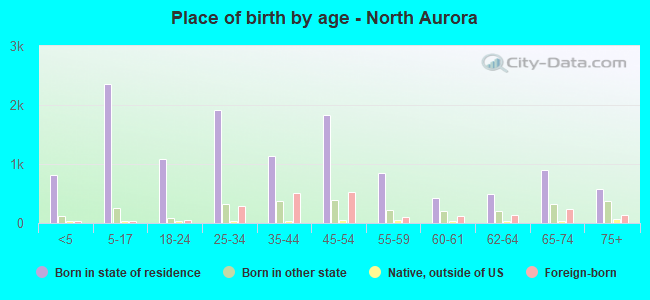
Place of birth - Born in state of residence (%)
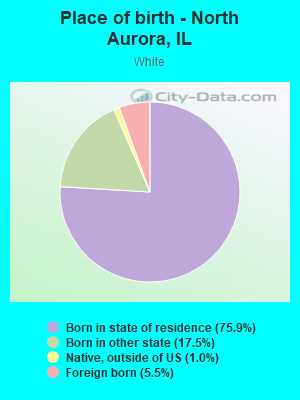
Place of birth - Born in state of residence (%) - White
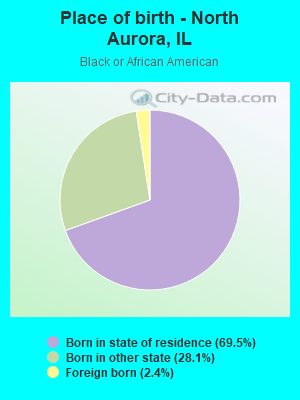
Place of birth - Born in state of residence (%) - Black or African American
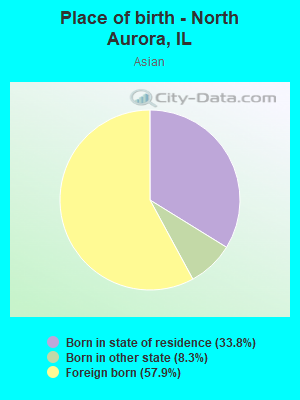
Place of birth - Born in state of residence (%) - Asian
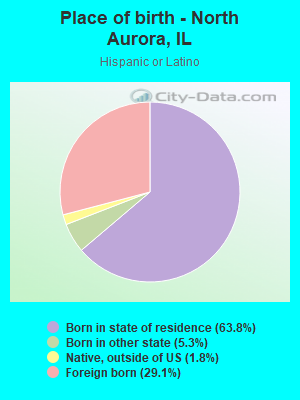
Place of birth - Born in state of residence (%) - Hispanic or Latino
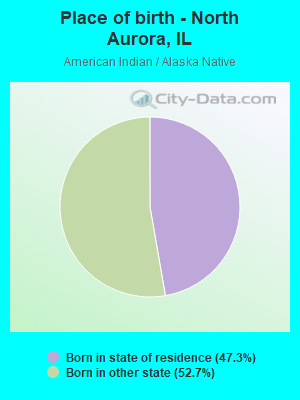
Place of birth - Born in state of residence (%) - American Indian and Alaska Native
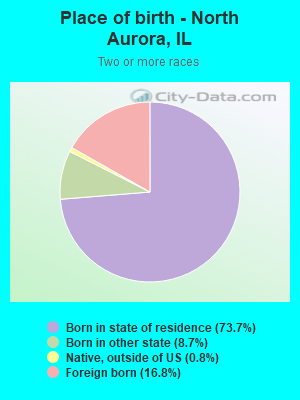
Place of birth - Born in state of residence (%) - Multirace
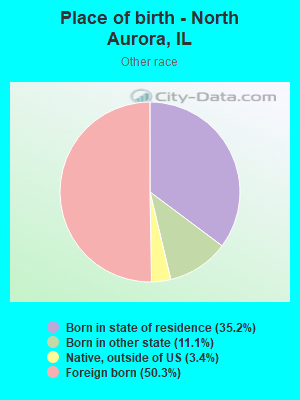
Place of birth - Born in state of residence (%) - Other Race
Place of birth - Born in other state (%)
Place of birth - Born in other state (%) - White
Place of birth - Born in other state (%) - Black or African American
Place of birth - Born in other state (%) - Asian
Place of birth - Born in other state (%) - Hispanic or Latino
Place of birth - Born in other state (%) - American Indian and Alaska Native
Place of birth - Born in other state (%) - Multirace
Place of birth - Born in other state (%) - Other Race
Place of birth - Native, outside of US (%)
Place of birth - Native, outside of US (%) - White
Place of birth - Native, outside of US (%) - Black or African American
Place of birth - Native, outside of US (%) - Asian
Place of birth - Native, outside of US (%) - Hispanic or Latino
Place of birth - Native, outside of US (%) - American Indian and Alaska Native
Place of birth - Native, outside of US (%) - Multirace
Place of birth - Native, outside of US (%) - Other Race
Place of birth - Foreign born (%)
Place of birth - Foreign born (%) - White
Place of birth - Foreign born (%) - Black or African American
Place of birth - Foreign born (%) - Asian
Place of birth - Foreign born (%) - Hispanic or Latino
Place of birth - Foreign born (%) - American Indian and Alaska Native
Place of birth - Foreign born (%) - Multirace
Place of birth - Foreign born (%) - Other Race
Residents speaking English at home (%)
Residents speaking English at home - Born in the United States (%)
Residents speaking English at home - Native, born elsewhere (%)
Residents speaking English at home - Foreign born (%)
Residents speaking Spanish at home (%)
Residents speaking Spanish at home - Born in the United States (%)
Residents speaking Spanish at home - Native, born elsewhere (%)
Residents speaking Spanish at home - Foreign born (%)
Residents speaking other language at home (%)
Residents speaking other language at home - Born in the United States (%)
Residents speaking other language at home - Native, born elsewhere (%)
Residents speaking other language at home - Foreign born (%)
Marital status - Never married (%)
Marital status - Now married (%)
Marital status - Separated (%)
Marital status - Widowed (%)
Marital status - Divorced (%)
Ancestries Reported - Arab (%)
Ancestries Reported - Czech (%)
Ancestries Reported - Danish (%)
Ancestries Reported - Dutch (%)
Ancestries Reported - English (%)
Ancestries Reported - French (%)
Ancestries Reported - French Canadian (%)
Ancestries Reported - German (%)
Ancestries Reported - Greek (%)
Ancestries Reported - Hungarian (%)
Ancestries Reported - Irish (%)
Ancestries Reported - Italian (%)
Ancestries Reported - Lithuanian (%)
Ancestries Reported - Norwegian (%)
Ancestries Reported - Polish (%)
Ancestries Reported - Portuguese (%)
Ancestries Reported - Russian (%)
Ancestries Reported - Scotch-Irish (%)
Ancestries Reported - Scottish (%)
Ancestries Reported - Slovak (%)
Ancestries Reported - Subsaharan African (%)
Ancestries Reported - Swedish (%)
Ancestries Reported - Swiss (%)
Ancestries Reported - Ukrainian (%)
Ancestries Reported - United States (%)
Ancestries Reported - Welsh (%)
Ancestries Reported - West Indian (%)
Ancestries Reported - Other (%)
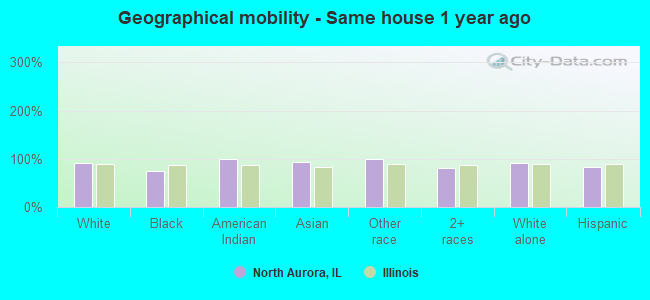
Geographical mobility - Same house 1 year ago (%)
Geographical mobility - Same house 1 year ago (%) - White
Geographical mobility - Same house 1 year ago (%) - Black or African American
Geographical mobility - Same house 1 year ago (%) - Asian
Geographical mobility - Same house 1 year ago (%) - Hispanic or Latino
Geographical mobility - Same house 1 year ago (%) - American Indian and Alaska Native
Geographical mobility - Same house 1 year ago (%) - Multirace
Geographical mobility - Same house 1 year ago (%) - Other Race
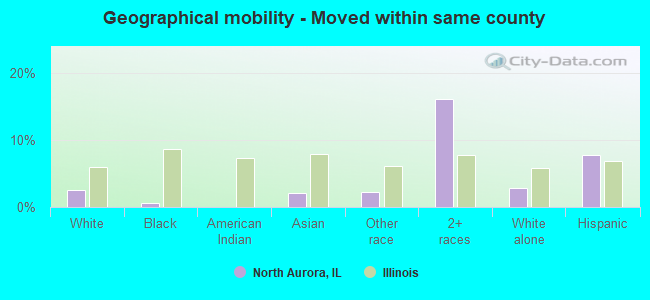
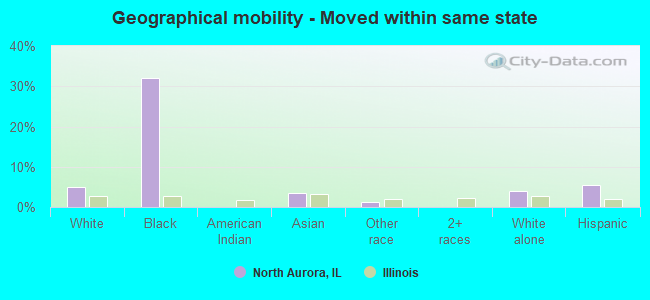
Geographical mobility - Moved within same county (%)
Geographical mobility - Moved within same county (%) - White
Geographical mobility - Moved within same county (%) - Black or African American
Geographical mobility - Moved within same county (%) - Asian
Geographical mobility - Moved within same county (%) - Hispanic or Latino
Geographical mobility - Moved within same county (%) - American Indian and Alaska Native
Geographical mobility - Moved within same county (%) - Multirace
Geographical mobility - Moved within same county (%) - Other Race
Geographical mobility - Moved from different county within same state (%)
Geographical mobility - Moved from different county within same state (%) - White
Geographical mobility - Moved from different county within same state (%) - Black or African American
Geographical mobility - Moved from different county within same state (%) - Asian
Geographical mobility - Moved from different county within same state (%) - Hispanic or Latino
Geographical mobility - Moved from different county within same state (%) - American Indian and Alaska Native
Geographical mobility - Moved from different county within same state (%) - Multirace
Geographical mobility - Moved from different county within same state (%) - Other Race
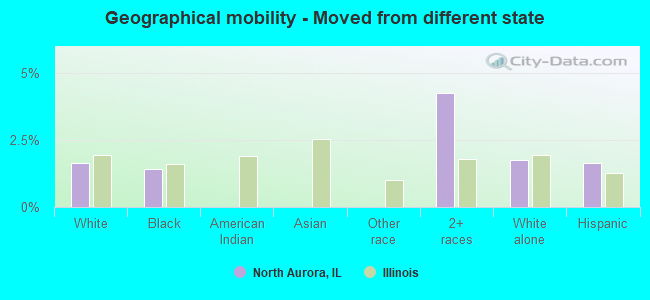
Geographical mobility - Moved from different state (%)
Geographical mobility - Moved from different state (%) - White
Geographical mobility - Moved from different state (%) - Black or African American
Geographical mobility - Moved from different state (%) - Asian
Geographical mobility - Moved from different state (%) - Hispanic or Latino
Geographical mobility - Moved from different state (%) - American Indian and Alaska Native
Geographical mobility - Moved from different state (%) - Multirace
Geographical mobility - Moved from different state (%) - Other Race
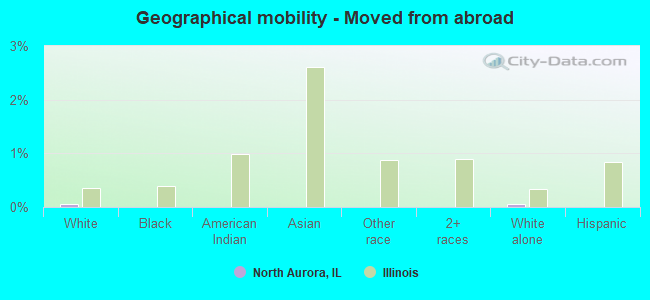
Geographical mobility - Moved from abroad (%)
Geographical mobility - Moved from abroad (%) - White
Geographical mobility - Moved from abroad (%) - Black or African American
Geographical mobility - Moved from abroad (%) - Asian
Geographical mobility - Moved from abroad (%) - Hispanic or Latino
Geographical mobility - Moved from abroad (%) - American Indian and Alaska Native
Geographical mobility - Moved from abroad (%) - Multirace
Geographical mobility - Moved from abroad (%) - Other Race
Place of birth for the foreign-born population - Ireland (%)
Place of birth for the foreign-born population - Denmark (%)
Place of birth for the foreign-born population - Norway (%)
Place of birth for the foreign-born population - Sweden (%)
Place of birth for the foreign-born population - United Kingdom (%)
Place of birth for the foreign-born population - England (%)
Place of birth for the foreign-born population - Scotland (%)
Place of birth for the foreign-born population - Other Northern Europe (%)
Place of birth for the foreign-born population - Austria (%)
Place of birth for the foreign-born population - Belgium (%)
Place of birth for the foreign-born population - France (%)
Place of birth for the foreign-born population - Germany (%)
Place of birth for the foreign-born population - Netherlands (%)
Place of birth for the foreign-born population - Switzerland (%)
Place of birth for the foreign-born population - Other Western Europe (%)
Place of birth for the foreign-born population - Greece (%)
Place of birth for the foreign-born population - Italy (%)
Place of birth for the foreign-born population - Portugal (%)
Place of birth for the foreign-born population - Spain (%)
Place of birth for the foreign-born population - Other Southern Europe (%)
Place of birth for the foreign-born population - Albania (%)
Place of birth for the foreign-born population - Belarus (%)
Place of birth for the foreign-born population - Bosnia and Herzegovina (%)
Place of birth for the foreign-born population - Bulgaria (%)
Place of birth for the foreign-born population - Croatia (%)
Place of birth for the foreign-born population - Czechoslovakia (%)
Place of birth for the foreign-born population - Hungary (%)
Place of birth for the foreign-born population - Latvia (%)
Place of birth for the foreign-born population - Lithuania (%)
Place of birth for the foreign-born population - North Macedonia (Macedonia) (%)
Place of birth for the foreign-born population - Moldova (%)
Place of birth for the foreign-born population - Poland (%)
Place of birth for the foreign-born population - Romania (%)
Place of birth for the foreign-born population - Russia (%)
Place of birth for the foreign-born population - Serbia (%)
Place of birth for the foreign-born population - Ukraine (%)
Place of birth for the foreign-born population - Other Eastern Europe (%)
Place of birth for the foreign-born population - China (%)
Place of birth for the foreign-born population - Hong Kong (%)
Place of birth for the foreign-born population - Taiwan (%)
Place of birth for the foreign-born population - Japan (%)
Place of birth for the foreign-born population - Korea (%)
Place of birth for the foreign-born population - Other Eastern Asia (%)
Place of birth for the foreign-born population - Afghanistan (%)
Place of birth for the foreign-born population - Bangladesh (%)
Place of birth for the foreign-born population - India (%)
Place of birth for the foreign-born population - Iran (%)
Place of birth for the foreign-born population - Kazakhstan (%)
Place of birth for the foreign-born population - Nepal (%)
Place of birth for the foreign-born population - Pakistan (%)
Place of birth for the foreign-born population - Sri Lanka (%)
Place of birth for the foreign-born population - Uzbekistan (%)
Place of birth for the foreign-born population - Other South Central Asia (%)
Place of birth for the foreign-born population - Burma (%)
Place of birth for the foreign-born population - Cambodia (%)
Place of birth for the foreign-born population - Indonesia (%)
Place of birth for the foreign-born population - Laos (%)
Place of birth for the foreign-born population - Malaysia (%)
Place of birth for the foreign-born population - Philippines (%)
Place of birth for the foreign-born population - Singapore (%)
Place of birth for the foreign-born population - Thailand (%)
Place of birth for the foreign-born population - Vietnam (%)
Place of birth for the foreign-born population - Other South Eastern Asia (%)
Place of birth for the foreign-born population - Armenia (%)
Place of birth for the foreign-born population - Iraq (%)
Place of birth for the foreign-born population - Israel (%)
Place of birth for the foreign-born population - Jordan (%)
Place of birth for the foreign-born population - Kuwait (%)
Place of birth for the foreign-born population - Lebanon (%)
Place of birth for the foreign-born population - Saudi Arabia (%)
Place of birth for the foreign-born population - Syria (%)
Place of birth for the foreign-born population - Turkey (%)
Place of birth for the foreign-born population - Yemen (%)
Place of birth for the foreign-born population - Other Western Asia (%)
Place of birth for the foreign-born population - Eritrea (%)
Place of birth for the foreign-born population - Ethiopia (%)
Place of birth for the foreign-born population - Kenya (%)
Place of birth for the foreign-born population - Somalia (%)
Place of birth for the foreign-born population - Uganda (%)
Place of birth for the foreign-born population - Zimbabwe (%)
Place of birth for the foreign-born population - Other Eastern Africa (%)
Place of birth for the foreign-born population - Cameroon (%)
Place of birth for the foreign-born population - Congo (%)
Place of birth for the foreign-born population - Democratic Republic of Congo (Zaire) (%)
Place of birth for the foreign-born population - Other Middle Africa (%)
Place of birth for the foreign-born population - Egypt (%)
Place of birth for the foreign-born population - Morocco (%)
Place of birth for the foreign-born population - Sudan (%)
Place of birth for the foreign-born population - Other Northern Africa (%)
Place of birth for the foreign-born population - South Africa (%)
Place of birth for the foreign-born population - Other Southern Africa (%)
Place of birth for the foreign-born population - Cabo Verde (%)
Place of birth for the foreign-born population - Ghana (%)
Place of birth for the foreign-born population - Liberia (%)
Place of birth for the foreign-born population - Nigeria (%)
Place of birth for the foreign-born population - Senegal (%)
Place of birth for the foreign-born population - Sierra Leone (%)
Place of birth for the foreign-born population - Other Western Africa (%)
Place of birth for the foreign-born population - Australia (%)
Place of birth for the foreign-born population - New Zealand (%)
Place of birth for the foreign-born population - Fiji (%)
Place of birth for the foreign-born population - Micronesia (%)
Place of birth for the foreign-born population - Bahamas (%)
Place of birth for the foreign-born population - Barbados (%)
Place of birth for the foreign-born population - Cuba (%)
Place of birth for the foreign-born population - Dominica (%)
Place of birth for the foreign-born population - Dominican Republic (%)
Place of birth for the foreign-born population - Grenada (%)
Place of birth for the foreign-born population - Haiti (%)
Place of birth for the foreign-born population - Jamaica (%)
Place of birth for the foreign-born population - St. Vincent and the Grenadines (%)
Place of birth for the foreign-born population - Trinidad and Tobago (%)
Place of birth for the foreign-born population - West Indies (%)
Place of birth for the foreign-born population - Other Caribbean (%)
Place of birth for the foreign-born population - Belize (%)
Place of birth for the foreign-born population - Costa Rica (%)
Place of birth for the foreign-born population - El Salvador (%)
Place of birth for the foreign-born population - Guatemala (%)
Place of birth for the foreign-born population - Honduras (%)
Place of birth for the foreign-born population - Mexico (%)
Place of birth for the foreign-born population - Nicaragua (%)
Place of birth for the foreign-born population - Panama (%)
Place of birth for the foreign-born population - Other Central America (%)
Place of birth for the foreign-born population - Argentina (%)
Place of birth for the foreign-born population - Bolivia (%)
Place of birth for the foreign-born population - Brazil (%)
Place of birth for the foreign-born population - Chile (%)
Place of birth for the foreign-born population - Colombia (%)
Place of birth for the foreign-born population - Ecuador (%)
Place of birth for the foreign-born population - Guyana (%)
Place of birth for the foreign-born population - Peru (%)
Place of birth for the foreign-born population - Uruguay (%)
Place of birth for the foreign-born population - Venezuela (%)
Place of birth for the foreign-born population - Other South America (%)
Place of birth for the foreign-born population - Canada (%)
Place of birth for the foreign-born population - Other Northern America (%)
Place of birth for the foreign-born population - Other (%)
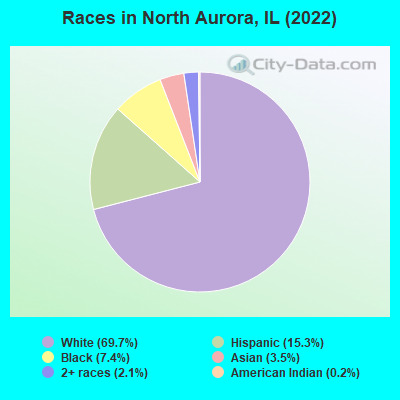
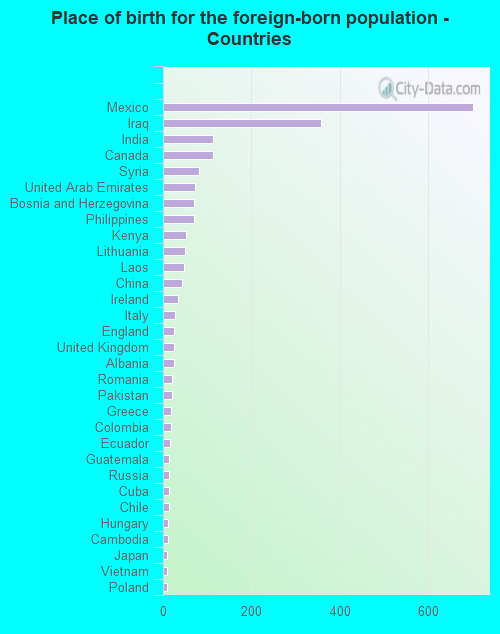
According to 2022 data, the most numerous races in North Aurora, IL are White alone (12,297 residents), Hispanic (2,694 residents), and Black alone (1,300 residents). 79.8% of North Aurora residents speak English at home. 11.9% of North Aurora, IL residents are foreign-born (4.7% born in Asia, 4.4% born in Latin America, 1.8% born in Europe), which is 17.2% less than the foreign-born rate of 14.0% across the entire state of Illinois.
Race distribution in North Aurora
2000 2022
8,424,140 67.8% White alone 1,856,152 14.9% Black alone 1,530,262 12.3% Hispanic 419,916 3.4% Asian alone 153,996 1.2% Two or more races 13,479 0.1% Other race alone 18,232 0.1% American Indian alone 3,116 0.03% Native Hawaiian and Other
7,356,301 58.5% White alone 2,299,726 18.3% Hispanic 1,660,423 13.2% Black alone 747,296 5.9% Asian alone 458,599 3.6% Two or more races 45,386 0.4% Other race alone 10,405 0.08% American Indian alone 3,896 0.03% Native Hawaiian and Other
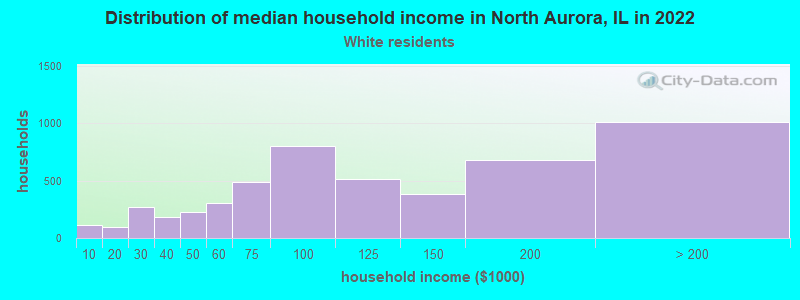
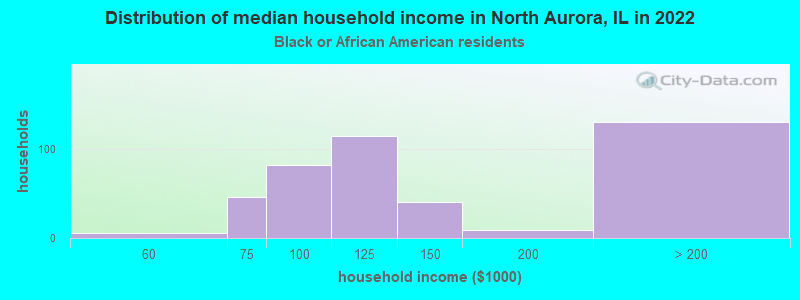
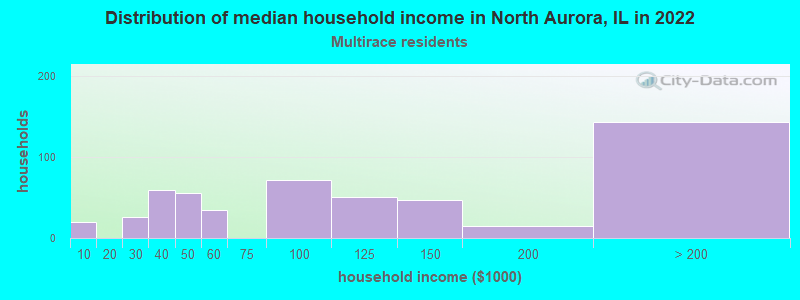
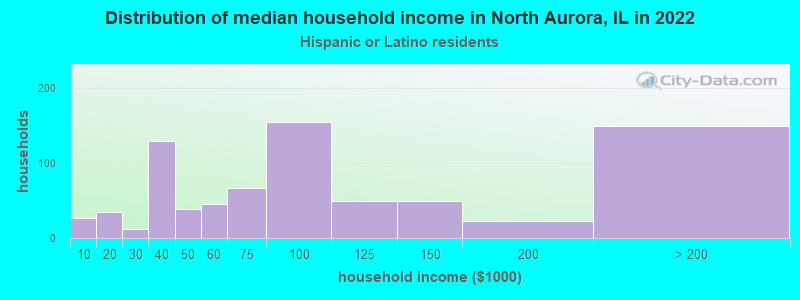
Income and house value in North Aurora Median household income in 2022 $100,296 White non-Hispanic householders$162,784 Black householders$154,055 Asian householders$71,517 Some other race householders$90,012 Two or more races householders$79,926 Hispanic or Latino race householdersMedian 2022 house value $320,553 White Non-Hispanic householders$289,227 Black or African American householders$348,660 American Indian or Alaska Native householders $293,304 Asian householders$311,112 Some other race householders$188,598 Two or more races householders$366,469 Hispanic or Latino householders
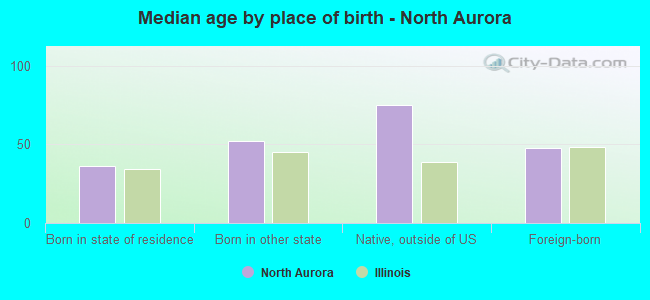
Median age by race in North Aurora
47.2 Median age for White residents49.2 46.1 34.9 Median age for Black or African American residents33.3 41.1 32.3 Median age for American Indian / Alaska Native residents-505,112,473.9 38.3 41.7 Median age for Asian residents34.5 41.5 -593,236,714.4 Median age for Native Hawaiian / Pacific Islander residents-658,536,584.7 -576,015,108.0 37.1 Median age for Other race residents36.9 34.0 29.1 Median age for Two or more races residents21.6 31.9 46.9 Median age for White alone residents48.0 44.9 29.2 Median age for Hispanic or Latino residents29.2 28.5
Owner/renter occupied households by race in North Aurora
House owners and renters - White residents 3,875 75.6% Owner occupied1,248 24.4% Renter occupiedHouse owners and renters - Black or African American residents 319 68.9% Owner occupied144 31.1% Renter occupiedHouse owners and renters - American Indian / Alaska Native residents 9 100.0% Owner occupiedHouse owners and renters - Asian residents 200 100.0% Owner occupiedHouse owners and renters - Other race residents 145 59.2% Owner occupied100 40.8% Renter occupiedHouse owners and renters - Two or more races residents 326 63.1% Owner occupied191 36.9% Renter occupiedHouse owners and renters - White alone residents 4,037 76.3% Owner occupied1,252 23.7% Renter occupiedHouse owners and renters - Hispanic or Latino residents 384 49.8% Owner occupied386 50.2% Renter occupied
Language usage in North Aurora
English speakers - Total 79.8% of residents of North Aurora speak English at home.
10.8% of residents speak Spanish at home 1,149 63.8% Speak English very well651 36.2% Speak English less than very well9.8% of residents speak other language at home 1,289 78.8% Speak English very well346 21.2% Speak English less than very well
English speakers - Born in the United States 92.3% of residents of North Aurora speak English at home.
5.3% of residents speak Spanish at home 146 100.0% Speak English very well2.9% of residents speak other language at home 80 100.0% Speak English very well
English speakers - Native, born elsewhere 35.0% of residents of North Aurora speak English at home.
22.2% of residents speak Spanish at home 40 100.0% Speak English very well63.9% of residents speak other language at home 78 67.8% Speak English very well37 32.2% Speak English less than very well
English speakers - Foreign-born 12.5% of residents of North Aurora speak English at home.
35.1% of residents speak Spanish at home 215 28.1% Speak English very well549 71.9% Speak English less than very well55.6% of residents speak other language at home 917 75.8% Speak English very well293 24.2% Speak English less than very well
White (Caucasian) - Speak only English Native:
100.0% (10,681)Foreign-born:
24.6% (161)
White (Caucasian) - Speak another language Native:
2.3% (241)Foreign-born:
75.6% (494)
Black or African American - Speak another language Native:
7.6% (88)Foreign-born:
81.8% (26)
Asian - Speak only English Native:
31.2% (80)Foreign-born:
18.1% (64)
Asian - Speak another language Native:
74.6% (192)Foreign-born:
81.9% (290)
Other race - Speak another language Native:
81.8% (340)Foreign-born:
97.5% (394)
Two or more races - Speak another language Native:
39.8% (494)Foreign-born:
99.3% (310)
White alone - Speak only English Native:
97.8% (10,616)Foreign-born:
17.5% (183)
White alone - Speak another language Native:
2.2% (237)Foreign-born:
83.2% (872)
Hispanic or Latino - Speak only English Native:
47.5% (782)Foreign-born:
1.9% (15)
Hispanic or Latino - Speak another language Native:
52.8% (870)Foreign-born:
97.2% (769)
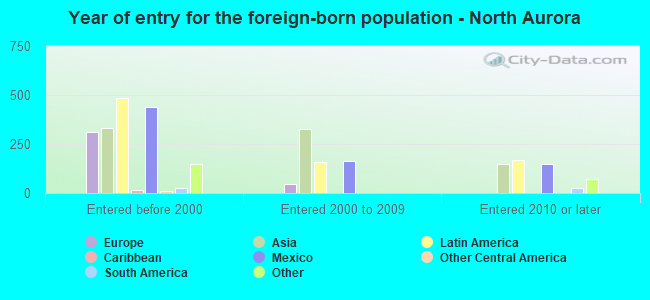
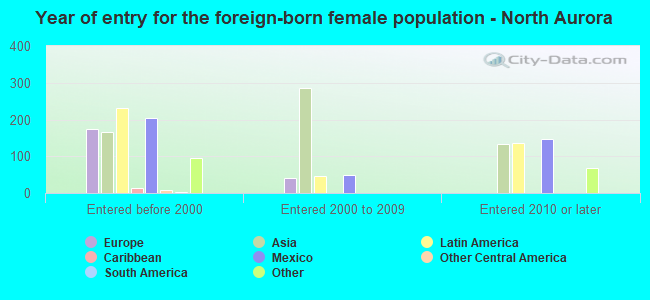
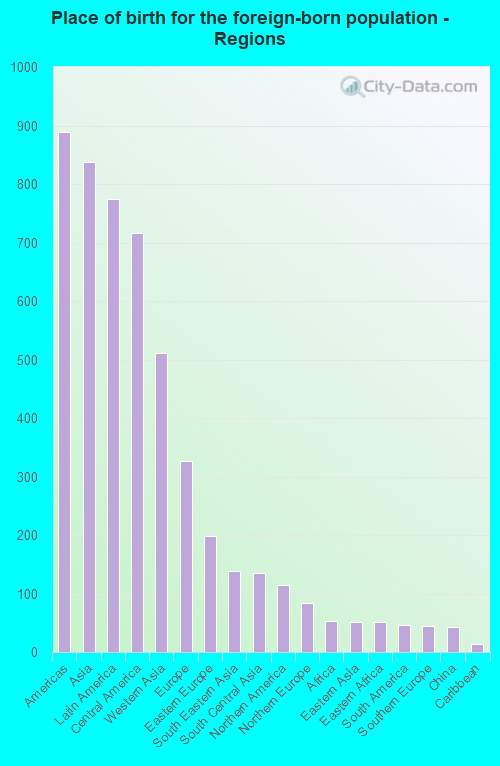
Foreign-born residents in North Aurora 2,108 residents are foreign born (4.7% Asia , 4.4% Latin America , 1.8% Europe ).
This city:
11.9%Illinois:
14.1%
Marital status for residents in North Aurora Marital status - White (Caucasian) population 15 years and over
Males 25.2% Never married58.8% Now married1.0% Separated1.9% Widowed13.1% DivorcedFemales 27.8% Never married51.8% Now married1.4% Separated7.6% Widowed11.4% DivorcedWomen who gave birth in the past 12 months Now married:
67.1% (41)Unmarried:
32.9% (20)
Women who did not give birth in the past 12 months Now married:
44.1% (1,117)Unmarried:
55.9% (1,416)
Marital status - Black or African American population 15 years and over
Males 36.2% Never married40.9% Now married4.1% Separated0.0% Widowed18.9% DivorcedFemales 21.2% Never married46.7% Now married0.0% Separated6.7% Widowed25.3% DivorcedWomen who gave birth in the past 12 months Now married:
92.9% (61)Unmarried:
7.1% (5)
Women who did not give birth in the past 12 months Now married:
46.0% (96)Unmarried:
54.0% (113)
Marital status - American Indian / Alaska Native population 15 years and over
Males 64.3% Never married0.0% Now married0.0% Separated0.0% Widowed35.7% DivorcedFemales 73.7% Never married26.3% Now married0.0% Separated0.0% Widowed0.0% DivorcedWomen who did not give birth in the past 12 months Now married:
0.0% (0)Unmarried:
100.0% (47)
Marital status - Asian population 15 years and over
Males 19.9% Never married77.8% Now married0.0% Separated0.0% Widowed2.3% DivorcedFemales 26.2% Never married55.6% Now married3.8% Separated0.0% Widowed14.4% DivorcedWomen who gave birth in the past 12 months Now married:
100.0% (17)Unmarried:
0.0% (0)
Women who did not give birth in the past 12 months Now married:
46.9% (78)Unmarried:
53.1% (88)
Marital status - Other race population 15 years and over
Males 29.4% Never married59.0% Now married0.0% Separated0.0% Widowed11.6% DivorcedFemales 35.9% Never married60.5% Now married0.0% Separated0.0% Widowed3.6% DivorcedWomen who gave birth in the past 12 months Now married:
100.0% (22)Unmarried:
0.0% (0)
Women who did not give birth in the past 12 months Now married:
60.8% (129)Unmarried:
39.2% (83)
Marital status - Two or more races population 15 years and over
Males 39.2% Never married52.6% Now married0.0% Separated0.0% Widowed8.2% DivorcedFemales 7.9% Never married50.5% Now married0.0% Separated29.2% Widowed12.5% DivorcedWomen who gave birth in the past 12 months Now married:
43.7% (47)Unmarried:
56.3% (61)
Women who did not give birth in the past 12 months Now married:
68.0% (155)Unmarried:
32.0% (73)
Marital status - White alone, not Hispanic / Latino population 15 years and over
Males 23.5% Never married59.6% Now married1.0% Separated2.0% Widowed13.8% DivorcedFemales 27.6% Never married51.4% Now married1.5% Separated7.7% Widowed11.8% DivorcedWomen who gave birth in the past 12 months Now married:
84.9% (42)Unmarried:
15.1% (7)
Women who did not give birth in the past 12 months Now married:
42.5% (1,156)Unmarried:
57.5% (1,562)
Marital status - Hispanic or Latino population 15 years and over
Males 41.8% Never married52.2% Now married0.0% Separated0.0% Widowed6.1% DivorcedFemales 26.1% Never married56.7% Now married0.0% Separated12.3% Widowed4.8% DivorcedWomen who gave birth in the past 12 months Now married:
40.6% (44)Unmarried:
59.4% (64)
Women who did not give birth in the past 12 months Now married:
63.4% (366)Unmarried:
36.6% (211)
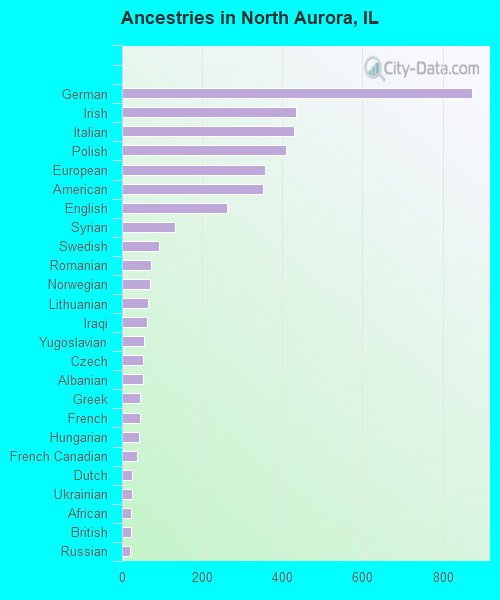
Ancestries in North Aurora
872 12.6% German434 6.3% Irish428 6.2% Italian410 5.9% Polish357 5.2% European351 5.1% American262 3.8% English132 1.9% Syrian92 1.3% Swedish72 1.0% Romanian71 1.0% Norwegian66 1.0% Lithuanian63 0.9% Iraqi54 0.8% Yugoslavian53 0.8% Czech52 0.8% Albanian46 0.7% Greek44 0.6% French42 0.6% Hungarian37 0.5% French Canadian26 0.4% Dutch24 0.3% Ukrainian23 0.3% African22 0.3% British20 0.3% Russian20 0.3% Scottish20 0.3% Welsh16 0.2% Northern European16 0.2% Swiss14 0.2% Portuguese14 0.2% Serbian13 0.2% Ethiopian10 0.1% Brazilian10 0.1% Czechoslovakian10 0.1% Eastern European9 0.1% Croatian9 0.1% Slovak8 0.1% Palestinian7 0.1% Scandinavian5 0.07% Slavic3 0.04% Austrian1 0.01% Nigerian
Children Nativity (place of birth) in North Aurora
Children under 6 years - Living with two parents Both parents native 681 100.0% NativeBoth parents foreign-born 90 100.0% NativeOne native, one foreign-born parent 189 100.0% NativeChildren under 6 years - Living with one parent Native parent 252 100.0% NativeForeign-born parent 17 100.0% NativeChildren 6 to 17 years - Living with two parents Both parents native 1,192 100.0% NativeBoth parents foreign-born 208 87.6% Native29 12.4% Foreign-bornOne native, one foreign-born parent 146 100.0% NativeChildren 6 to 17 years - Living with one parent Native parent 407 100.0% NativeForeign-born parent 295 51.0% Native283 49.0% Foreign-born
Grandparents responsible for own grandchildren in North Aurora
Grandparents (30 to 59 years) White / Caucasian 41 41.5% Responsible for grandchildren58 58.5% Not responsible for grandchildrenBlack or African American 50 100.0% Not responsible for grandchildrenOther race 35 100.0% Not responsible for grandchildrenWhite alone, not Hispanic / Latino 31 35.3% Responsible for grandchildren56 64.7% Not responsible for grandchildrenHispanic or Latino 19 30.0% Responsible for grandchildren44 70.0% Not responsible for grandchildrenGrandparents (60 years and over) White / Caucasian 36 25.0% Responsible for grandchildren108 75.0% Not responsible for grandchildrenWhite alone, not Hispanic / Latino 39 22.5% Responsible for grandchildren134 77.5% Not responsible for grandchildren