Races in North Richland Hills, Texas (TX) Detailed Stats
Data:
Races - White alone (%)
Races - White alone (% change since 2000)
Races - Black alone (%)
Races - Black alone (% change since 2000)
Races - American Indian alone (%)
Races - American Indian alone (% change since 2000)
Races - Asian alone (%)
Races - Asian alone (% change since 2000)
Races - Hispanic (%)
Races - Hispanic (% change since 2000)
Races - Native Hawaiian and Other Pacific Islander alone (%)
Races - Native Hawaiian and Other Pacific Islander alone (% change since 2000)
Races - Two or more races(%)
Races - Two or more races(% change since 2000)
Races - Other race alone (%)
Races - Other race alone (% change since 2000)
Racial diversity
Place of birth - Born in state of residence (%)
Place of birth - Born in state of residence (%) - White
Place of birth - Born in state of residence (%) - Black or African American
Place of birth - Born in state of residence (%) - Asian
Place of birth - Born in state of residence (%) - Hispanic or Latino
Place of birth - Born in state of residence (%) - American Indian and Alaska Native
Place of birth - Born in state of residence (%) - Multirace
Place of birth - Born in state of residence (%) - Other Race
Place of birth - Born in other state (%)
Place of birth - Born in other state (%) - White
Place of birth - Born in other state (%) - Black or African American
Place of birth - Born in other state (%) - Asian
Place of birth - Born in other state (%) - Hispanic or Latino
Place of birth - Born in other state (%) - American Indian and Alaska Native
Place of birth - Born in other state (%) - Multirace
Place of birth - Born in other state (%) - Other Race
Place of birth - Native, outside of US (%)
Place of birth - Native, outside of US (%) - White
Place of birth - Native, outside of US (%) - Black or African American
Place of birth - Native, outside of US (%) - Asian
Place of birth - Native, outside of US (%) - Hispanic or Latino
Place of birth - Native, outside of US (%) - American Indian and Alaska Native
Place of birth - Native, outside of US (%) - Multirace
Place of birth - Native, outside of US (%) - Other Race
Place of birth - Foreign born (%)
Place of birth - Foreign born (%) - White
Place of birth - Foreign born (%) - Black or African American
Place of birth - Foreign born (%) - Asian
Place of birth - Foreign born (%) - Hispanic or Latino
Place of birth - Foreign born (%) - American Indian and Alaska Native
Place of birth - Foreign born (%) - Multirace
Place of birth - Foreign born (%) - Other Race
Residents speaking English at home (%)
Residents speaking English at home - Born in the United States (%)
Residents speaking English at home - Native, born elsewhere (%)
Residents speaking English at home - Foreign born (%)
Residents speaking Spanish at home (%)
Residents speaking Spanish at home - Born in the United States (%)
Residents speaking Spanish at home - Native, born elsewhere (%)
Residents speaking Spanish at home - Foreign born (%)
Residents speaking other language at home (%)
Residents speaking other language at home - Born in the United States (%)
Residents speaking other language at home - Native, born elsewhere (%)
Residents speaking other language at home - Foreign born (%)
Marital status - Never married (%)
Marital status - Now married (%)
Marital status - Separated (%)
Marital status - Widowed (%)
Marital status - Divorced (%)
Ancestries Reported - Arab (%)
Ancestries Reported - Czech (%)
Ancestries Reported - Danish (%)
Ancestries Reported - Dutch (%)
Ancestries Reported - English (%)
Ancestries Reported - French (%)
Ancestries Reported - French Canadian (%)
Ancestries Reported - German (%)
Ancestries Reported - Greek (%)
Ancestries Reported - Hungarian (%)
Ancestries Reported - Irish (%)
Ancestries Reported - Italian (%)
Ancestries Reported - Lithuanian (%)
Ancestries Reported - Norwegian (%)
Ancestries Reported - Polish (%)
Ancestries Reported - Portuguese (%)
Ancestries Reported - Russian (%)
Ancestries Reported - Scotch-Irish (%)
Ancestries Reported - Scottish (%)
Ancestries Reported - Slovak (%)
Ancestries Reported - Subsaharan African (%)
Ancestries Reported - Swedish (%)
Ancestries Reported - Swiss (%)
Ancestries Reported - Ukrainian (%)
Ancestries Reported - United States (%)
Ancestries Reported - Welsh (%)
Ancestries Reported - West Indian (%)
Ancestries Reported - Other (%)
Geographical mobility - Same house 1 year ago (%)
Geographical mobility - Same house 1 year ago (%) - White
Geographical mobility - Same house 1 year ago (%) - Black or African American
Geographical mobility - Same house 1 year ago (%) - Asian
Geographical mobility - Same house 1 year ago (%) - Hispanic or Latino
Geographical mobility - Same house 1 year ago (%) - American Indian and Alaska Native
Geographical mobility - Same house 1 year ago (%) - Multirace
Geographical mobility - Same house 1 year ago (%) - Other Race
Geographical mobility - Moved within same county (%)
Geographical mobility - Moved within same county (%) - White
Geographical mobility - Moved within same county (%) - Black or African American
Geographical mobility - Moved within same county (%) - Asian
Geographical mobility - Moved within same county (%) - Hispanic or Latino
Geographical mobility - Moved within same county (%) - American Indian and Alaska Native
Geographical mobility - Moved within same county (%) - Multirace
Geographical mobility - Moved within same county (%) - Other Race
Geographical mobility - Moved from different county within same state (%)
Geographical mobility - Moved from different county within same state (%) - White
Geographical mobility - Moved from different county within same state (%) - Black or African American
Geographical mobility - Moved from different county within same state (%) - Asian
Geographical mobility - Moved from different county within same state (%) - Hispanic or Latino
Geographical mobility - Moved from different county within same state (%) - American Indian and Alaska Native
Geographical mobility - Moved from different county within same state (%) - Multirace
Geographical mobility - Moved from different county within same state (%) - Other Race
Geographical mobility - Moved from different state (%)
Geographical mobility - Moved from different state (%) - White
Geographical mobility - Moved from different state (%) - Black or African American
Geographical mobility - Moved from different state (%) - Asian
Geographical mobility - Moved from different state (%) - Hispanic or Latino
Geographical mobility - Moved from different state (%) - American Indian and Alaska Native
Geographical mobility - Moved from different state (%) - Multirace
Geographical mobility - Moved from different state (%) - Other Race
Geographical mobility - Moved from abroad (%)
Geographical mobility - Moved from abroad (%) - White
Geographical mobility - Moved from abroad (%) - Black or African American
Geographical mobility - Moved from abroad (%) - Asian
Geographical mobility - Moved from abroad (%) - Hispanic or Latino
Geographical mobility - Moved from abroad (%) - American Indian and Alaska Native
Geographical mobility - Moved from abroad (%) - Multirace
Geographical mobility - Moved from abroad (%) - Other Race
Place of birth for the foreign-born population - Ireland (%)
Place of birth for the foreign-born population - Denmark (%)
Place of birth for the foreign-born population - Norway (%)
Place of birth for the foreign-born population - Sweden (%)
Place of birth for the foreign-born population - United Kingdom (%)
Place of birth for the foreign-born population - England (%)
Place of birth for the foreign-born population - Scotland (%)
Place of birth for the foreign-born population - Other Northern Europe (%)
Place of birth for the foreign-born population - Austria (%)
Place of birth for the foreign-born population - Belgium (%)
Place of birth for the foreign-born population - France (%)
Place of birth for the foreign-born population - Germany (%)
Place of birth for the foreign-born population - Netherlands (%)
Place of birth for the foreign-born population - Switzerland (%)
Place of birth for the foreign-born population - Other Western Europe (%)
Place of birth for the foreign-born population - Greece (%)
Place of birth for the foreign-born population - Italy (%)
Place of birth for the foreign-born population - Portugal (%)
Place of birth for the foreign-born population - Spain (%)
Place of birth for the foreign-born population - Other Southern Europe (%)
Place of birth for the foreign-born population - Albania (%)
Place of birth for the foreign-born population - Belarus (%)
Place of birth for the foreign-born population - Bosnia and Herzegovina (%)
Place of birth for the foreign-born population - Bulgaria (%)
Place of birth for the foreign-born population - Croatia (%)
Place of birth for the foreign-born population - Czechoslovakia (%)
Place of birth for the foreign-born population - Hungary (%)
Place of birth for the foreign-born population - Latvia (%)
Place of birth for the foreign-born population - Lithuania (%)
Place of birth for the foreign-born population - North Macedonia (Macedonia) (%)
Place of birth for the foreign-born population - Moldova (%)
Place of birth for the foreign-born population - Poland (%)
Place of birth for the foreign-born population - Romania (%)
Place of birth for the foreign-born population - Russia (%)
Place of birth for the foreign-born population - Serbia (%)
Place of birth for the foreign-born population - Ukraine (%)
Place of birth for the foreign-born population - Other Eastern Europe (%)
Place of birth for the foreign-born population - China (%)
Place of birth for the foreign-born population - Hong Kong (%)
Place of birth for the foreign-born population - Taiwan (%)
Place of birth for the foreign-born population - Japan (%)
Place of birth for the foreign-born population - Korea (%)
Place of birth for the foreign-born population - Other Eastern Asia (%)
Place of birth for the foreign-born population - Afghanistan (%)
Place of birth for the foreign-born population - Bangladesh (%)
Place of birth for the foreign-born population - India (%)
Place of birth for the foreign-born population - Iran (%)
Place of birth for the foreign-born population - Kazakhstan (%)
Place of birth for the foreign-born population - Nepal (%)
Place of birth for the foreign-born population - Pakistan (%)
Place of birth for the foreign-born population - Sri Lanka (%)
Place of birth for the foreign-born population - Uzbekistan (%)
Place of birth for the foreign-born population - Other South Central Asia (%)
Place of birth for the foreign-born population - Burma (%)
Place of birth for the foreign-born population - Cambodia (%)
Place of birth for the foreign-born population - Indonesia (%)
Place of birth for the foreign-born population - Laos (%)
Place of birth for the foreign-born population - Malaysia (%)
Place of birth for the foreign-born population - Philippines (%)
Place of birth for the foreign-born population - Singapore (%)
Place of birth for the foreign-born population - Thailand (%)
Place of birth for the foreign-born population - Vietnam (%)
Place of birth for the foreign-born population - Other South Eastern Asia (%)
Place of birth for the foreign-born population - Armenia (%)
Place of birth for the foreign-born population - Iraq (%)
Place of birth for the foreign-born population - Israel (%)
Place of birth for the foreign-born population - Jordan (%)
Place of birth for the foreign-born population - Kuwait (%)
Place of birth for the foreign-born population - Lebanon (%)
Place of birth for the foreign-born population - Saudi Arabia (%)
Place of birth for the foreign-born population - Syria (%)
Place of birth for the foreign-born population - Turkey (%)
Place of birth for the foreign-born population - Yemen (%)
Place of birth for the foreign-born population - Other Western Asia (%)
Place of birth for the foreign-born population - Eritrea (%)
Place of birth for the foreign-born population - Ethiopia (%)
Place of birth for the foreign-born population - Kenya (%)
Place of birth for the foreign-born population - Somalia (%)
Place of birth for the foreign-born population - Uganda (%)
Place of birth for the foreign-born population - Zimbabwe (%)
Place of birth for the foreign-born population - Other Eastern Africa (%)
Place of birth for the foreign-born population - Cameroon (%)
Place of birth for the foreign-born population - Congo (%)
Place of birth for the foreign-born population - Democratic Republic of Congo (Zaire) (%)
Place of birth for the foreign-born population - Other Middle Africa (%)
Place of birth for the foreign-born population - Egypt (%)
Place of birth for the foreign-born population - Morocco (%)
Place of birth for the foreign-born population - Sudan (%)
Place of birth for the foreign-born population - Other Northern Africa (%)
Place of birth for the foreign-born population - South Africa (%)
Place of birth for the foreign-born population - Other Southern Africa (%)
Place of birth for the foreign-born population - Cabo Verde (%)
Place of birth for the foreign-born population - Ghana (%)
Place of birth for the foreign-born population - Liberia (%)
Place of birth for the foreign-born population - Nigeria (%)
Place of birth for the foreign-born population - Senegal (%)
Place of birth for the foreign-born population - Sierra Leone (%)
Place of birth for the foreign-born population - Other Western Africa (%)
Place of birth for the foreign-born population - Australia (%)
Place of birth for the foreign-born population - New Zealand (%)
Place of birth for the foreign-born population - Fiji (%)
Place of birth for the foreign-born population - Micronesia (%)
Place of birth for the foreign-born population - Bahamas (%)
Place of birth for the foreign-born population - Barbados (%)
Place of birth for the foreign-born population - Cuba (%)
Place of birth for the foreign-born population - Dominica (%)
Place of birth for the foreign-born population - Dominican Republic (%)
Place of birth for the foreign-born population - Grenada (%)
Place of birth for the foreign-born population - Haiti (%)
Place of birth for the foreign-born population - Jamaica (%)
Place of birth for the foreign-born population - St. Vincent and the Grenadines (%)
Place of birth for the foreign-born population - Trinidad and Tobago (%)
Place of birth for the foreign-born population - West Indies (%)
Place of birth for the foreign-born population - Other Caribbean (%)
Place of birth for the foreign-born population - Belize (%)
Place of birth for the foreign-born population - Costa Rica (%)
Place of birth for the foreign-born population - El Salvador (%)
Place of birth for the foreign-born population - Guatemala (%)
Place of birth for the foreign-born population - Honduras (%)
Place of birth for the foreign-born population - Mexico (%)
Place of birth for the foreign-born population - Nicaragua (%)
Place of birth for the foreign-born population - Panama (%)
Place of birth for the foreign-born population - Other Central America (%)
Place of birth for the foreign-born population - Argentina (%)
Place of birth for the foreign-born population - Bolivia (%)
Place of birth for the foreign-born population - Brazil (%)
Place of birth for the foreign-born population - Chile (%)
Place of birth for the foreign-born population - Colombia (%)
Place of birth for the foreign-born population - Ecuador (%)
Place of birth for the foreign-born population - Guyana (%)
Place of birth for the foreign-born population - Peru (%)
Place of birth for the foreign-born population - Uruguay (%)
Place of birth for the foreign-born population - Venezuela (%)
Place of birth for the foreign-born population - Other South America (%)
Place of birth for the foreign-born population - Canada (%)
Place of birth for the foreign-born population - Other Northern America (%)
Place of birth for the foreign-born population - Other (%)
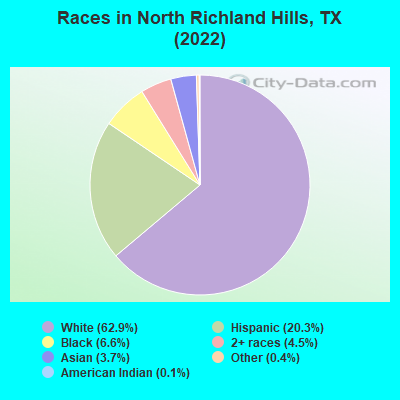
According to 2022 data, the most numerous races in North Richland Hills, TX are Hispanic (14,484 residents), White alone (44,978 residents), and Black alone (4,741 residents). 82.5% of North Richland Hills residents speak English at home. 11.0% of North Richland Hills, TX residents are foreign-born (5.0% born in Latin America, 2.7% born in Asia, 2.3% born in Africa), which is 54.2% less than the foreign-born rate of 17.0% across the entire state of Texas.
Race distribution in North Richland Hills
2000 2022
10,933,313 52.4% White alone 6,669,666 32.0% Hispanic 2,364,255 11.3% Black alone 554,445 2.7% Asian alone 230,567 1.1% Two or more races 68,859 0.3% American Indian alone 19,958 0.10% Other race alone 10,757 0.05% Native Hawaiian and Other
12,070,642 40.2% Hispanic 11,683,430 38.9% White alone 3,508,706 11.7% Black alone 1,608,173 5.4% Asian alone 956,560 3.2% Two or more races 125,763 0.4% Other race alone 47,023 0.2% American Indian alone 29,275 0.10% Native Hawaiian and Other
Income and house value in North Richland Hills Median household income in 2022 $87,626 White non-Hispanic householders$65,063 Black householders$116,250 American Indian and Alaska Native householders$79,739 Asian householders$44,385 Some other race householders$85,214 Two or more races householders$74,028 Hispanic or Latino race householdersMedian 2022 house value $347,460 White Non-Hispanic householders$382,516 Black or African American householders$199,334 American Indian or Alaska Native householders $313,092 Asian householders$335,775 Native Hawaiian and other Pacific Islander householders$295,565 Some other race householders$344,711 Two or more races householders$319,622 Hispanic or Latino householders
Median age by race in North Richland Hills
44.7 Median age for White residents46.5 42.7 23.9 Median age for Black or African American residents18.7 34.1 26.9 Median age for American Indian / Alaska Native residents44.0 24.6 49.1 Median age for Asian residents55.3 39.9 -666,666,666.0 Median age for Native Hawaiian / Pacific Islander residents-666,666,666.0 -666,666,666.0 30.9 Median age for Other race residents29.6 31.4 36.3 Median age for Two or more races residents35.5 37.3 47.4 Median age for White alone residents49.1 44.8 29.3 Median age for Hispanic or Latino residents32.2 25.8
Owner/renter occupied households by race in North Richland Hills
House owners and renters - White residents 14,384 66.6% Owner occupied7,198 33.4% Renter occupiedHouse owners and renters - Black or African American residents 580 24.6% Owner occupied1,780 75.4% Renter occupiedHouse owners and renters - American Indian / Alaska Native residents 118 59.9% Owner occupied79 40.1% Renter occupiedHouse owners and renters - Asian residents 631 69.8% Owner occupied273 30.2% Renter occupiedHouse owners and renters - Native Hawaiian / Pacific Islander residents 2 5.6% Owner occupied27 94.4% Renter occupiedHouse owners and renters - Other race residents 400 58.0% Owner occupied290 42.0% Renter occupiedHouse owners and renters - Two or more races residents 1,532 74.5% Owner occupied524 25.5% Renter occupiedHouse owners and renters - White alone residents 14,052 68.3% Owner occupied6,532 31.7% Renter occupiedHouse owners and renters - Hispanic or Latino residents 2,087 59.8% Owner occupied1,403 40.2% Renter occupied
Language usage in North Richland Hills
English speakers - Total 82.5% of residents of North Richland Hills speak English at home.
11.0% of residents speak Spanish at home 5,113 69.1% Speak English very well2,289 30.9% Speak English less than very well6.5% of residents speak other language at home 2,576 58.9% Speak English very well1,794 41.1% Speak English less than very well
English speakers - Born in the United States 92.4% of residents of North Richland Hills speak English at home.
5.1% of residents speak Spanish at home 971 92.6% Speak English very well78 7.4% Speak English less than very well2.5% of residents speak other language at home 292 55.5% Speak English very well234 44.5% Speak English less than very well
English speakers - Native, born elsewhere 44.3% of residents of North Richland Hills speak English at home.
5.0% of residents speak Spanish at home 137 100.0% Speak English very well50.7% of residents speak other language at home 1,394 100.0% Speak English very well
English speakers - Foreign-born 26.4% of residents of North Richland Hills speak English at home.
42.6% of residents speak Spanish at home 607 22.3% Speak English very well2,117 77.7% Speak English less than very well30.9% of residents speak other language at home 472 23.9% Speak English very well1,504 76.1% Speak English less than very well
White (Caucasian) - Speak only English Native:
94.8% (43,451)Foreign-born:
41.1% (818)
White (Caucasian) - Speak another language Native:
5.2% (2,375)Foreign-born:
58.9% (1,170)
Black or African American - Speak only English Native:
83.0% (2,984)Foreign-born:
32.9% (318)
Black or African American - Speak another language Native:
22.0% (790)Foreign-born:
66.7% (644)
American Indian / Alaska Native - Speak another language Native:
19.6% (134)Foreign-born:
100.0% (191)
Asian - Speak only English Native:
52.1% (357)Foreign-born:
8.6% (157)
Asian - Speak another language Native:
47.5% (325)Foreign-born:
91.1% (1,654)
Other race - Speak only English Native:
49.6% (805)Foreign-born:
5.8% (41)
Other race - Speak another language Native:
52.3% (849)Foreign-born:
93.5% (655)
Two or more races - Speak only English Native:
58.8% (5,555)Foreign-born:
4.2% (68)
Two or more races - Speak another language Native:
37.5% (3,549)Foreign-born:
96.2% (1,572)
White alone - Speak only English Native:
98.7% (41,442)Foreign-born:
40.6% (487)
White alone - Speak another language Native:
1.5% (617)Foreign-born:
59.9% (718)
Hispanic or Latino - Speak another language Native:
45.7% (4,302)Foreign-born:
100.0% (2,668)
Foreign-born residents in North Richland Hills 7,880 residents are foreign born (5.0% Latin America , 2.7% Asia , 2.3% Africa ).
This city:
11.0%Texas:
17.1%
Marital status for residents in North Richland Hills Marital status - White (Caucasian) population 15 years and over
Males 28.8% Never married59.4% Now married1.2% Separated2.6% Widowed8.1% DivorcedFemales 25.0% Never married53.1% Now married0.0% Separated6.0% Widowed15.9% DivorcedWomen who gave birth in the past 12 months Now married:
100.0% (324)Unmarried:
0.0% (0)
Women who did not give birth in the past 12 months Now married:
43.4% (5,042)Unmarried:
56.6% (6,585)
Marital status - Black or African American population 15 years and over
Males 57.1% Never married29.1% Now married1.9% Separated0.7% Widowed11.1% DivorcedFemales 45.8% Never married34.5% Now married2.6% Separated2.4% Widowed14.7% DivorcedWomen who did not give birth in the past 12 months Now married:
36.4% (418)Unmarried:
63.6% (729)
Marital status - American Indian / Alaska Native population 15 years and over
Males 45.4% Never married54.6% Now married0.0% Separated0.0% Widowed0.0% DivorcedFemales 46.1% Never married33.6% Now married0.0% Separated3.9% Widowed16.4% DivorcedWomen who did not give birth in the past 12 months Now married:
24.9% (82)Unmarried:
75.1% (247)
Marital status - Asian population 15 years and over
Males 23.9% Never married71.7% Now married0.0% Separated0.0% Widowed4.4% DivorcedFemales 15.7% Never married75.2% Now married2.2% Separated3.5% Widowed3.5% DivorcedWomen who gave birth in the past 12 months Now married:
100.0% (140)Unmarried:
0.0% (0)
Women who did not give birth in the past 12 months Now married:
72.8% (574)Unmarried:
27.2% (215)
Marital status - Native Hawaiian / Pacific Islander population 15 years and over
Males 100.0% Never married0.0% Now married0.0% Separated0.0% Widowed0.0% DivorcedFemales 0.0% Never married0.0% Now married0.0% Separated0.0% Widowed100.0% DivorcedMarital status - Other race population 15 years and over
Males 45.7% Never married47.0% Now married1.1% Separated0.0% Widowed6.1% DivorcedFemales 26.2% Never married47.7% Now married16.2% Separated6.2% Widowed3.8% DivorcedWomen who gave birth in the past 12 months Now married:
38.0% (18)Unmarried:
62.0% (29)
Women who did not give birth in the past 12 months Now married:
62.3% (437)Unmarried:
37.7% (265)
Marital status - Two or more races population 15 years and over
Males 42.7% Never married48.7% Now married0.9% Separated4.9% Widowed2.8% DivorcedFemales 48.4% Never married32.1% Now married1.9% Separated11.6% Widowed6.1% DivorcedWomen who gave birth in the past 12 months Now married:
100.0% (73)Unmarried:
0.0% (0)
Women who did not give birth in the past 12 months Now married:
27.3% (847)Unmarried:
72.7% (2,257)
Marital status - White alone, not Hispanic / Latino population 15 years and over
Males 26.5% Never married60.8% Now married1.3% Separated2.7% Widowed8.7% DivorcedFemales 24.4% Never married54.2% Now married0.0% Separated6.2% Widowed15.2% DivorcedWomen who gave birth in the past 12 months Now married:
100.0% (324)Unmarried:
0.0% (0)
Women who did not give birth in the past 12 months Now married:
42.8% (4,370)Unmarried:
57.2% (5,843)
Marital status - Hispanic or Latino population 15 years and over
Males 36.9% Never married48.8% Now married1.5% Separated10.5% Widowed2.3% DivorcedFemales 45.0% Never married30.7% Now married0.0% Separated4.3% Widowed20.1% DivorcedWomen who gave birth in the past 12 months Now married:
76.8% (125)Unmarried:
23.2% (38)
Women who did not give birth in the past 12 months Now married:
41.9% (1,721)Unmarried:
58.1% (2,383)
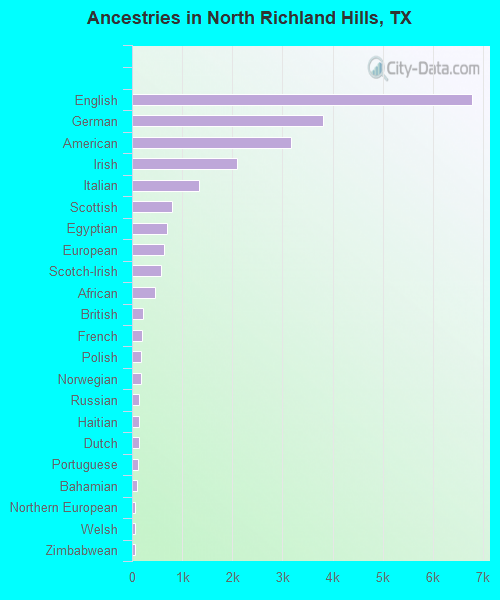
Ancestries in North Richland Hills
6,778 18.2% English3,813 10.2% German3,173 8.5% American2,093 5.6% Irish1,338 3.6% Italian796 2.1% Scottish692 1.9% Egyptian637 1.7% European581 1.6% Scotch-Irish458 1.2% African210 0.6% British192 0.5% French182 0.5% Polish172 0.5% Norwegian148 0.4% Russian140 0.4% Haitian138 0.4% Dutch128 0.3% Portuguese104 0.3% Bahamian69 0.2% Northern European66 0.2% Welsh62 0.2% Zimbabwean58 0.2% Danish55 0.1% Palestinian49 0.1% Eastern European48 0.1% Finnish44 0.1% Ethiopian41 0.1% Brazilian33 0.09% Czech33 0.09% Swedish28 0.08% Hungarian27 0.07% Scandinavian25 0.07% West Indian25 0.07% French Canadian23 0.06% Nigerian23 0.06% Greek19 0.05% Albanian17 0.05% Lebanese16 0.04% Canadian13 0.03% Romanian12 0.03% Maltese11 0.03% Belgian11 0.03% Jamaican10 0.03% Sudanese7 0.02% Iranian7 0.02% Croatian7 0.02% Cape Verdean5 0.01% Swiss4 0.01% Slovene
Geographical mobility in North Richland Hills Same house 1 year ago 45,051 90.4% White (Caucasian)3,029 63.2% Black or African American648 73.5% American Indian / Alaska Native2,253 85.5% Asian23 98.2% Native Hawaiian / Pacific Islander2,258 87.4% Other race10,574 85.0% Two or more races40,731 89.6% White alone, not Hispanic / Latino11,768 82.6% Hispanic or LatinoMoved within same county 2,757 5.5% White / Caucasian1,442 30.1% Black or African American131 14.9% American Indian / Alaska Native161 6.1% Asian198 7.7% Other race1,407 11.3% Two or more races2,695 5.9% White alone, not Hispanic / Latino1,337 9.4% Hispanic or LatinoMoved within same state 1,429 2.9% White / Caucasian42 0.9% Black or African American130 4.9% Asian25 1.0% Other race260 2.1% Two or more races1,429 3.1% White alone, not Hispanic / Latino338 2.4% Hispanic or LatinoMoved from different state 149 0.3% White / Caucasian326 6.8% Black or African American95 10.7% American Indian / Alaska Native24 0.9% Asian56 0.5% Two or more races149 0.3% White alone, not Hispanic / Latino549 3.9% Hispanic or LatinoMoved from abroad 461 0.9% White18 0.4% Black or African American3 0.3% American Indian / Alaska Native76 2.9% Asian45 1.8% Other race65 0.5% Two or more races461 1.0% White alone, not Hispanic / Latino119 0.8% Hispanic or Latino
Children Nativity (place of birth) in North Richland Hills
Children under 6 years - Living with two parents Both parents native 2,614 100.0% NativeBoth parents foreign-born 615 95.1% Native32 4.9% Foreign-bornOne native, one foreign-born parent 437 100.0% NativeChildren under 6 years - Living with one parent Native parent 811 100.0% NativeForeign-born parent 189 100.0% NativeChildren 6 to 17 years - Living with two parents Both parents native 4,780 99.5% Native23 0.5% Foreign-bornBoth parents foreign-born 1,144 79.6% Native293 20.4% Foreign-bornOne native, one foreign-born parent 474 94.6% Native27 5.4% Foreign-bornChildren 6 to 17 years - Living with one parent Native parent 3,049 100.0% NativeForeign-born parent 422 49.9% Native424 50.1% Foreign-born
Grandparents responsible for own grandchildren in North Richland Hills
Grandparents (30 to 59 years) White / Caucasian 97 42.5% Responsible for grandchildren131 57.5% Not responsible for grandchildrenOther race 23 40.0% Responsible for grandchildren35 60.0% Not responsible for grandchildrenTwo or more races 29 58.5% Responsible for grandchildren20 41.5% Not responsible for grandchildrenWhite alone, not Hispanic / Latino 117 42.4% Responsible for grandchildren159 57.6% Not responsible for grandchildrenHispanic or Latino 63 56.3% Responsible for grandchildren49 43.7% Not responsible for grandchildrenGrandparents (60 years and over) White / Caucasian 217 41.8% Responsible for grandchildren301 58.2% Not responsible for grandchildrenOther race 13 100.0% Responsible for grandchildrenTwo or more races 8 100.0% Responsible for grandchildrenWhite alone, not Hispanic / Latino 234 44.6% Responsible for grandchildren291 55.4% Not responsible for grandchildrenHispanic or Latino 28 100.0% Not responsible for grandchildren