Races in Northeast Tarrant, Texas (TX) Detailed Stats
Ancestries, Foreign-born residents, place of birth
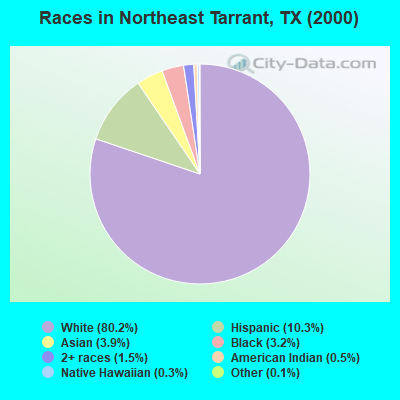
Race distribution in Northeast Tarrant

- 322,45880.2%White alone
- 41,58110.3%Hispanic
- 15,7413.9%Asian alone
- 12,7413.2%Black alone
- 5,9291.5%Two or more races
- 1,8950.5%American Indian alone
- 1,3220.3%Native Hawaiian and Other
Pacific Islander alone - 4630.1%Other race alone
2000
2022
-
- 10,933,31352.4%White alone
- 6,669,66632.0%Hispanic
- 2,364,25511.3%Black alone
- 554,4452.7%Asian alone
- 230,5671.1%Two or more races
- 68,8590.3%American Indian alone
- 19,9580.10%Other race alone
- 10,7570.05%Native Hawaiian and Other
Pacific Islander alone

-
- 12,070,64240.2%Hispanic
- 11,683,43038.9%White alone
- 3,508,70611.7%Black alone
- 1,608,1735.4%Asian alone
- 956,5603.2%Two or more races
- 125,7630.4%Other race alone
- 47,0230.2%American Indian alone
- 29,2750.10%Native Hawaiian and Other
Pacific Islander alone

Income and house value in Northeast Tarrant
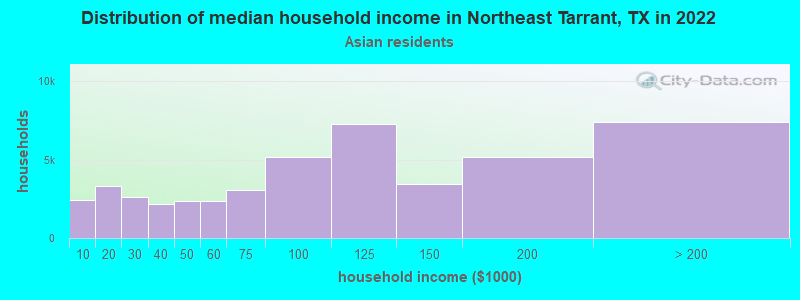
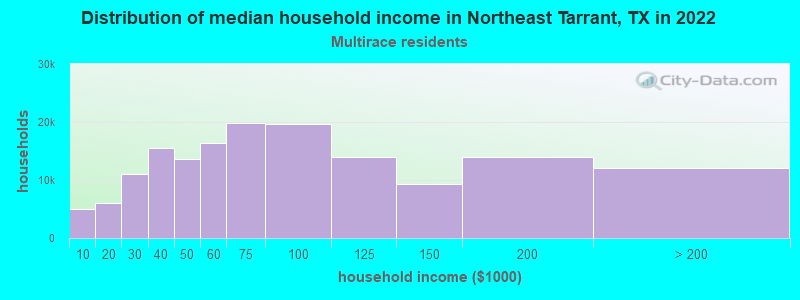
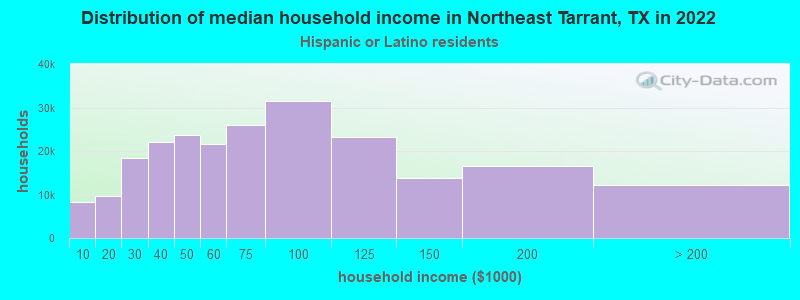
- Median household income in 2022
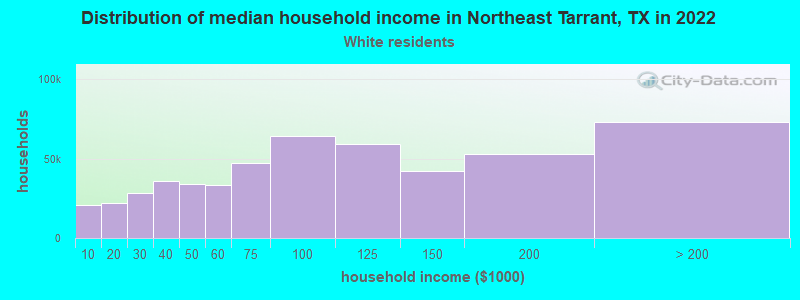
- $107,502White non-Hispanic householders
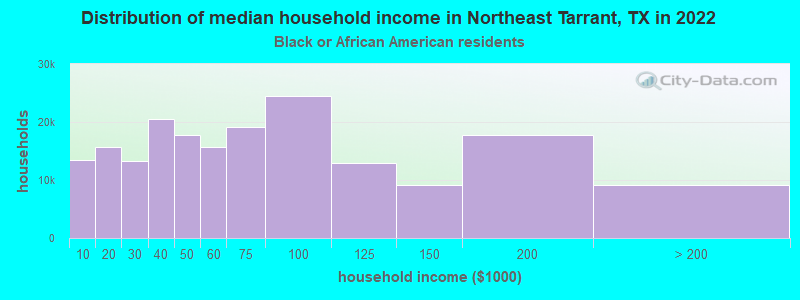
- $78,117Black householders
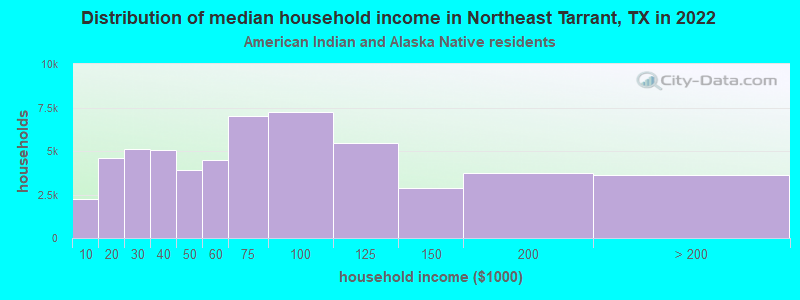
- $101,902American Indian and Alaska Native householders
- $110,715Asian householders
- $33,087Native Hawaiian and other Pacific Islander householders
- $68,996Some other race householders
- $82,465Two or more races householders
- $79,665Hispanic or Latino race householders
- Median 2022 house value
- $406,596White Non-Hispanic householders
- $410,116Black or African American householders
- $283,737American Indian or Alaska Native householders
- $369,281Asian householders
- $363,648Native Hawaiian and other Pacific Islander householders
- $293,594Some other race householders
- $368,577Two or more races householders
- $318,940Hispanic or Latino householders
Household income for White non-Hispanic householders
Household income for Black householders
Household income for American Indian and Alaska Native householders
Household income for Asian householders
Household income for Native Hawaiian and other Pacific Islander householders

Household income for Two or more races householders
Household income for Hispanic or Latino race householders
Zip code: 76180