Races in Olympia, Washington (WA) Detailed Stats
Data:
Races - White alone (%)
Races - White alone (% change since 2000)
Races - Black alone (%)
Races - Black alone (% change since 2000)
Races - American Indian alone (%)
Races - American Indian alone (% change since 2000)
Races - Asian alone (%)
Races - Asian alone (% change since 2000)
Races - Hispanic (%)
Races - Hispanic (% change since 2000)
Races - Native Hawaiian and Other Pacific Islander alone (%)
Races - Native Hawaiian and Other Pacific Islander alone (% change since 2000)
Races - Two or more races(%)
Races - Two or more races(% change since 2000)
Races - Other race alone (%)
Races - Other race alone (% change since 2000)
Racial diversity
Place of birth - Born in state of residence (%)
Place of birth - Born in state of residence (%) - White
Place of birth - Born in state of residence (%) - Black or African American
Place of birth - Born in state of residence (%) - Asian
Place of birth - Born in state of residence (%) - Hispanic or Latino
Place of birth - Born in state of residence (%) - American Indian and Alaska Native
Place of birth - Born in state of residence (%) - Multirace
Place of birth - Born in state of residence (%) - Other Race
Place of birth - Born in other state (%)
Place of birth - Born in other state (%) - White
Place of birth - Born in other state (%) - Black or African American
Place of birth - Born in other state (%) - Asian
Place of birth - Born in other state (%) - Hispanic or Latino
Place of birth - Born in other state (%) - American Indian and Alaska Native
Place of birth - Born in other state (%) - Multirace
Place of birth - Born in other state (%) - Other Race
Place of birth - Native, outside of US (%)
Place of birth - Native, outside of US (%) - White
Place of birth - Native, outside of US (%) - Black or African American
Place of birth - Native, outside of US (%) - Asian
Place of birth - Native, outside of US (%) - Hispanic or Latino
Place of birth - Native, outside of US (%) - American Indian and Alaska Native
Place of birth - Native, outside of US (%) - Multirace
Place of birth - Native, outside of US (%) - Other Race
Place of birth - Foreign born (%)
Place of birth - Foreign born (%) - White
Place of birth - Foreign born (%) - Black or African American
Place of birth - Foreign born (%) - Asian
Place of birth - Foreign born (%) - Hispanic or Latino
Place of birth - Foreign born (%) - American Indian and Alaska Native
Place of birth - Foreign born (%) - Multirace
Place of birth - Foreign born (%) - Other Race
Residents speaking English at home (%)
Residents speaking English at home - Born in the United States (%)
Residents speaking English at home - Native, born elsewhere (%)
Residents speaking English at home - Foreign born (%)
Residents speaking Spanish at home (%)
Residents speaking Spanish at home - Born in the United States (%)
Residents speaking Spanish at home - Native, born elsewhere (%)
Residents speaking Spanish at home - Foreign born (%)
Residents speaking other language at home (%)
Residents speaking other language at home - Born in the United States (%)
Residents speaking other language at home - Native, born elsewhere (%)
Residents speaking other language at home - Foreign born (%)
Marital status - Never married (%)
Marital status - Now married (%)
Marital status - Separated (%)
Marital status - Widowed (%)
Marital status - Divorced (%)
Ancestries Reported - Arab (%)
Ancestries Reported - Czech (%)
Ancestries Reported - Danish (%)
Ancestries Reported - Dutch (%)
Ancestries Reported - English (%)
Ancestries Reported - French (%)
Ancestries Reported - French Canadian (%)
Ancestries Reported - German (%)
Ancestries Reported - Greek (%)
Ancestries Reported - Hungarian (%)
Ancestries Reported - Irish (%)
Ancestries Reported - Italian (%)
Ancestries Reported - Lithuanian (%)
Ancestries Reported - Norwegian (%)
Ancestries Reported - Polish (%)
Ancestries Reported - Portuguese (%)
Ancestries Reported - Russian (%)
Ancestries Reported - Scotch-Irish (%)
Ancestries Reported - Scottish (%)
Ancestries Reported - Slovak (%)
Ancestries Reported - Subsaharan African (%)
Ancestries Reported - Swedish (%)
Ancestries Reported - Swiss (%)
Ancestries Reported - Ukrainian (%)
Ancestries Reported - United States (%)
Ancestries Reported - Welsh (%)
Ancestries Reported - West Indian (%)
Ancestries Reported - Other (%)
Geographical mobility - Same house 1 year ago (%)
Geographical mobility - Same house 1 year ago (%) - White
Geographical mobility - Same house 1 year ago (%) - Black or African American
Geographical mobility - Same house 1 year ago (%) - Asian
Geographical mobility - Same house 1 year ago (%) - Hispanic or Latino
Geographical mobility - Same house 1 year ago (%) - American Indian and Alaska Native
Geographical mobility - Same house 1 year ago (%) - Multirace
Geographical mobility - Same house 1 year ago (%) - Other Race
Geographical mobility - Moved within same county (%)
Geographical mobility - Moved within same county (%) - White
Geographical mobility - Moved within same county (%) - Black or African American
Geographical mobility - Moved within same county (%) - Asian
Geographical mobility - Moved within same county (%) - Hispanic or Latino
Geographical mobility - Moved within same county (%) - American Indian and Alaska Native
Geographical mobility - Moved within same county (%) - Multirace
Geographical mobility - Moved within same county (%) - Other Race
Geographical mobility - Moved from different county within same state (%)
Geographical mobility - Moved from different county within same state (%) - White
Geographical mobility - Moved from different county within same state (%) - Black or African American
Geographical mobility - Moved from different county within same state (%) - Asian
Geographical mobility - Moved from different county within same state (%) - Hispanic or Latino
Geographical mobility - Moved from different county within same state (%) - American Indian and Alaska Native
Geographical mobility - Moved from different county within same state (%) - Multirace
Geographical mobility - Moved from different county within same state (%) - Other Race
Geographical mobility - Moved from different state (%)
Geographical mobility - Moved from different state (%) - White
Geographical mobility - Moved from different state (%) - Black or African American
Geographical mobility - Moved from different state (%) - Asian
Geographical mobility - Moved from different state (%) - Hispanic or Latino
Geographical mobility - Moved from different state (%) - American Indian and Alaska Native
Geographical mobility - Moved from different state (%) - Multirace
Geographical mobility - Moved from different state (%) - Other Race
Geographical mobility - Moved from abroad (%)
Geographical mobility - Moved from abroad (%) - White
Geographical mobility - Moved from abroad (%) - Black or African American
Geographical mobility - Moved from abroad (%) - Asian
Geographical mobility - Moved from abroad (%) - Hispanic or Latino
Geographical mobility - Moved from abroad (%) - American Indian and Alaska Native
Geographical mobility - Moved from abroad (%) - Multirace
Geographical mobility - Moved from abroad (%) - Other Race
Place of birth for the foreign-born population - Ireland (%)
Place of birth for the foreign-born population - Denmark (%)
Place of birth for the foreign-born population - Norway (%)
Place of birth for the foreign-born population - Sweden (%)
Place of birth for the foreign-born population - United Kingdom (%)
Place of birth for the foreign-born population - England (%)
Place of birth for the foreign-born population - Scotland (%)
Place of birth for the foreign-born population - Other Northern Europe (%)
Place of birth for the foreign-born population - Austria (%)
Place of birth for the foreign-born population - Belgium (%)
Place of birth for the foreign-born population - France (%)
Place of birth for the foreign-born population - Germany (%)
Place of birth for the foreign-born population - Netherlands (%)
Place of birth for the foreign-born population - Switzerland (%)
Place of birth for the foreign-born population - Other Western Europe (%)
Place of birth for the foreign-born population - Greece (%)
Place of birth for the foreign-born population - Italy (%)
Place of birth for the foreign-born population - Portugal (%)
Place of birth for the foreign-born population - Spain (%)
Place of birth for the foreign-born population - Other Southern Europe (%)
Place of birth for the foreign-born population - Albania (%)
Place of birth for the foreign-born population - Belarus (%)
Place of birth for the foreign-born population - Bosnia and Herzegovina (%)
Place of birth for the foreign-born population - Bulgaria (%)
Place of birth for the foreign-born population - Croatia (%)
Place of birth for the foreign-born population - Czechoslovakia (%)
Place of birth for the foreign-born population - Hungary (%)
Place of birth for the foreign-born population - Latvia (%)
Place of birth for the foreign-born population - Lithuania (%)
Place of birth for the foreign-born population - North Macedonia (Macedonia) (%)
Place of birth for the foreign-born population - Moldova (%)
Place of birth for the foreign-born population - Poland (%)
Place of birth for the foreign-born population - Romania (%)
Place of birth for the foreign-born population - Russia (%)
Place of birth for the foreign-born population - Serbia (%)
Place of birth for the foreign-born population - Ukraine (%)
Place of birth for the foreign-born population - Other Eastern Europe (%)
Place of birth for the foreign-born population - China (%)
Place of birth for the foreign-born population - Hong Kong (%)
Place of birth for the foreign-born population - Taiwan (%)
Place of birth for the foreign-born population - Japan (%)
Place of birth for the foreign-born population - Korea (%)
Place of birth for the foreign-born population - Other Eastern Asia (%)
Place of birth for the foreign-born population - Afghanistan (%)
Place of birth for the foreign-born population - Bangladesh (%)
Place of birth for the foreign-born population - India (%)
Place of birth for the foreign-born population - Iran (%)
Place of birth for the foreign-born population - Kazakhstan (%)
Place of birth for the foreign-born population - Nepal (%)
Place of birth for the foreign-born population - Pakistan (%)
Place of birth for the foreign-born population - Sri Lanka (%)
Place of birth for the foreign-born population - Uzbekistan (%)
Place of birth for the foreign-born population - Other South Central Asia (%)
Place of birth for the foreign-born population - Burma (%)
Place of birth for the foreign-born population - Cambodia (%)
Place of birth for the foreign-born population - Indonesia (%)
Place of birth for the foreign-born population - Laos (%)
Place of birth for the foreign-born population - Malaysia (%)
Place of birth for the foreign-born population - Philippines (%)
Place of birth for the foreign-born population - Singapore (%)
Place of birth for the foreign-born population - Thailand (%)
Place of birth for the foreign-born population - Vietnam (%)
Place of birth for the foreign-born population - Other South Eastern Asia (%)
Place of birth for the foreign-born population - Armenia (%)
Place of birth for the foreign-born population - Iraq (%)
Place of birth for the foreign-born population - Israel (%)
Place of birth for the foreign-born population - Jordan (%)
Place of birth for the foreign-born population - Kuwait (%)
Place of birth for the foreign-born population - Lebanon (%)
Place of birth for the foreign-born population - Saudi Arabia (%)
Place of birth for the foreign-born population - Syria (%)
Place of birth for the foreign-born population - Turkey (%)
Place of birth for the foreign-born population - Yemen (%)
Place of birth for the foreign-born population - Other Western Asia (%)
Place of birth for the foreign-born population - Eritrea (%)
Place of birth for the foreign-born population - Ethiopia (%)
Place of birth for the foreign-born population - Kenya (%)
Place of birth for the foreign-born population - Somalia (%)
Place of birth for the foreign-born population - Uganda (%)
Place of birth for the foreign-born population - Zimbabwe (%)
Place of birth for the foreign-born population - Other Eastern Africa (%)
Place of birth for the foreign-born population - Cameroon (%)
Place of birth for the foreign-born population - Congo (%)
Place of birth for the foreign-born population - Democratic Republic of Congo (Zaire) (%)
Place of birth for the foreign-born population - Other Middle Africa (%)
Place of birth for the foreign-born population - Egypt (%)
Place of birth for the foreign-born population - Morocco (%)
Place of birth for the foreign-born population - Sudan (%)
Place of birth for the foreign-born population - Other Northern Africa (%)
Place of birth for the foreign-born population - South Africa (%)
Place of birth for the foreign-born population - Other Southern Africa (%)
Place of birth for the foreign-born population - Cabo Verde (%)
Place of birth for the foreign-born population - Ghana (%)
Place of birth for the foreign-born population - Liberia (%)
Place of birth for the foreign-born population - Nigeria (%)
Place of birth for the foreign-born population - Senegal (%)
Place of birth for the foreign-born population - Sierra Leone (%)
Place of birth for the foreign-born population - Other Western Africa (%)
Place of birth for the foreign-born population - Australia (%)
Place of birth for the foreign-born population - New Zealand (%)
Place of birth for the foreign-born population - Fiji (%)
Place of birth for the foreign-born population - Micronesia (%)
Place of birth for the foreign-born population - Bahamas (%)
Place of birth for the foreign-born population - Barbados (%)
Place of birth for the foreign-born population - Cuba (%)
Place of birth for the foreign-born population - Dominica (%)
Place of birth for the foreign-born population - Dominican Republic (%)
Place of birth for the foreign-born population - Grenada (%)
Place of birth for the foreign-born population - Haiti (%)
Place of birth for the foreign-born population - Jamaica (%)
Place of birth for the foreign-born population - St. Vincent and the Grenadines (%)
Place of birth for the foreign-born population - Trinidad and Tobago (%)
Place of birth for the foreign-born population - West Indies (%)
Place of birth for the foreign-born population - Other Caribbean (%)
Place of birth for the foreign-born population - Belize (%)
Place of birth for the foreign-born population - Costa Rica (%)
Place of birth for the foreign-born population - El Salvador (%)
Place of birth for the foreign-born population - Guatemala (%)
Place of birth for the foreign-born population - Honduras (%)
Place of birth for the foreign-born population - Mexico (%)
Place of birth for the foreign-born population - Nicaragua (%)
Place of birth for the foreign-born population - Panama (%)
Place of birth for the foreign-born population - Other Central America (%)
Place of birth for the foreign-born population - Argentina (%)
Place of birth for the foreign-born population - Bolivia (%)
Place of birth for the foreign-born population - Brazil (%)
Place of birth for the foreign-born population - Chile (%)
Place of birth for the foreign-born population - Colombia (%)
Place of birth for the foreign-born population - Ecuador (%)
Place of birth for the foreign-born population - Guyana (%)
Place of birth for the foreign-born population - Peru (%)
Place of birth for the foreign-born population - Uruguay (%)
Place of birth for the foreign-born population - Venezuela (%)
Place of birth for the foreign-born population - Other South America (%)
Place of birth for the foreign-born population - Canada (%)
Place of birth for the foreign-born population - Other Northern America (%)
Place of birth for the foreign-born population - Other (%)
Latest news about races in Olympia, WA collected exclusively by city-data.com from local newspapers, TV, and radio stations
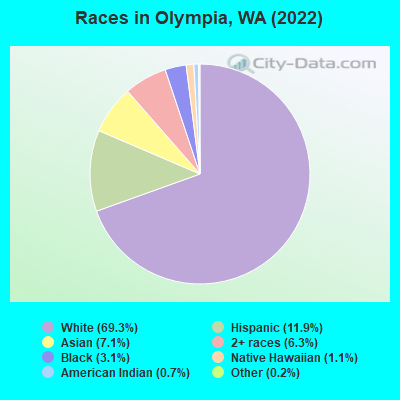
According to 2022 data, the most numerous races in Olympia, WA are White alone (38,782 residents), Hispanic (6,637 residents), and Asian alone (3,987 residents). 86.7% of Olympia residents speak English at home. 9.2% of Olympia, WA residents are foreign-born (4.7% born in Asia, 2.3% born in Latin America, 1.4% born in Europe), which is 63.3% less than the foreign-born rate of 15.0% across the entire state of Washington.
Race distribution in Olympia
2000 2022
4,652,490 78.9% White alone 441,509 7.5% Hispanic 319,401 5.4% Asian alone 184,631 3.1% Black alone 175,926 3.0% Two or more races 85,396 1.4% American Indian alone 22,779 0.4% Native Hawaiian and Other 11,989 0.2% Other race alone
4,941,456 63.5% White alone 1,093,313 14.0% Hispanic 755,832 9.7% Asian alone 523,448 6.7% Two or more races 299,537 3.8% Black alone 69,024 0.9% American Indian alone 52,231 0.7% Native Hawaiian and Other 50,945 0.7% Other race alone
Income and house value in Olympia Median household income in 2022 $75,917 White non-Hispanic householders$78,982 Black householders$78,721 Asian householders$31,052 Native Hawaiian and other Pacific Islander householders$26,878 Some other race householders$75,451 Two or more races householders$67,104 Hispanic or Latino race householdersMedian 2022 house value $494,359 White Non-Hispanic householders$511,275 Black or African American householders$474,681 American Indian or Alaska Native householders $510,239 Asian householders$388,375 Native Hawaiian and other Pacific Islander householders$535,440 Some other race householders$482,621 Two or more races householders$482,276 Hispanic or Latino householders
Median age by race in Olympia
42.8 Median age for White residents38.9 46.5 30.7 Median age for Black or African American residents29.4 30.6 29.6 Median age for American Indian / Alaska Native residents30.5 20.8 37.8 Median age for Asian residents37.7 38.0 43.0 Median age for Native Hawaiian / Pacific Islander residents45.1 40.6 42.0 Median age for Other race residents43.2 58.9 23.5 Median age for Two or more races residents25.1 22.6 43.6 Median age for White alone residents39.7 47.1 25.9 Median age for Hispanic or Latino residents25.0 28.0
Owner/renter occupied households by race in Olympia
House owners and renters - White residents 9,572 47.6% Owner occupied10,538 52.4% Renter occupiedHouse owners and renters - Black or African American residents 182 37.9% Owner occupied298 62.1% Renter occupiedHouse owners and renters - American Indian / Alaska Native residents 43 11.6% Owner occupied327 88.4% Renter occupiedHouse owners and renters - Asian residents 743 49.5% Owner occupied757 50.5% Renter occupiedHouse owners and renters - Native Hawaiian / Pacific Islander residents 233 100.0% Renter occupiedHouse owners and renters - Other race residents 69 25.9% Owner occupied197 74.1% Renter occupiedHouse owners and renters - Two or more races residents 1,377 58.0% Owner occupied997 42.0% Renter occupiedHouse owners and renters - White alone residents 9,506 49.7% Owner occupied9,626 50.3% Renter occupiedHouse owners and renters - Hispanic or Latino residents 623 26.0% Owner occupied1,773 74.0% Renter occupied
Language usage in Olympia
English speakers - Total 86.7% of residents of Olympia speak English at home.
3.6% of residents speak Spanish at home 1,319 69.0% Speak English very well592 31.0% Speak English less than very well9.7% of residents speak other language at home 3,227 62.7% Speak English very well1,921 37.3% Speak English less than very well
English speakers - Born in the United States 95.4% of residents of Olympia speak English at home.
2.1% of residents speak Spanish at home 455 90.6% Speak English very well47 9.4% Speak English less than very well1.9% of residents speak other language at home 451 100.0% Speak English very well
English speakers - Native, born elsewhere 54.1% of residents of Olympia speak English at home.
6.0% of residents speak Spanish at home 93 100.0% Speak English very well49.9% of residents speak other language at home 757 98.7% Speak English very well10 1.3% Speak English less than very well
English speakers - Foreign-born 21.0% of residents of Olympia speak English at home.
16.3% of residents speak Spanish at home 395 48.2% Speak English very well425 51.8% Speak English less than very well63.5% of residents speak other language at home 1,407 43.9% Speak English very well1,796 56.1% Speak English less than very well
White (Caucasian) - Speak only English Native:
96.7% (37,144)Foreign-born:
38.6% (489)
White (Caucasian) - Speak another language Native:
2.8% (1,079)Foreign-born:
60.4% (766)
Black or African American - Speak only English Native:
100.0% (1,188)Foreign-born:
42.1% (102)
Black or African American - Speak another language Native:
1.2% (15)Foreign-born:
60.6% (147)
American Indian / Alaska Native - Speak another language Native:
8.3% (47)Foreign-born:
100.0% (26)
Asian - Speak only English Native:
81.8% (1,129)Foreign-born:
12.8% (333)
Asian - Speak another language Native:
20.9% (288)Foreign-born:
87.2% (2,263)
Native Hawaiian / Pacific Islander - Speak only English Native:
10.9% (66)Foreign-born:
37.5% (35)
Native Hawaiian / Pacific Islander - Speak another language Native:
100.0% (610)Foreign-born:
64.7% (60)
Other race - Speak another language Native:
30.6% (142)Foreign-born:
77.6% (192)
Two or more races - Speak only English Native:
86.0% (4,627)Foreign-born:
33.8% (128)
Two or more races - Speak another language Native:
13.5% (724)Foreign-born:
65.7% (248)
White alone - Speak only English Native:
97.7% (35,975)Foreign-born:
43.8% (370)
White alone - Speak another language Native:
2.1% (758)Foreign-born:
54.6% (461)
Hispanic or Latino - Speak only English Native:
78.8% (3,626)Foreign-born:
22.9% (246)
Hispanic or Latino - Speak another language Native:
22.0% (1,013)Foreign-born:
77.6% (832)
Foreign-born residents in Olympia 5,143 residents are foreign born (4.7% Asia , 2.3% Latin America , 1.4% Europe ).
This city:
9.2%Washington:
14.9%
Marital status for residents in Olympia Marital status - White (Caucasian) population 15 years and over
Males 39.9% Never married44.6% Now married1.8% Separated2.7% Widowed11.0% DivorcedFemales 30.2% Never married38.7% Now married2.5% Separated9.6% Widowed19.0% DivorcedWomen who gave birth in the past 12 months Now married:
70.2% (338)Unmarried:
29.8% (143)
Women who did not give birth in the past 12 months Now married:
34.4% (3,173)Unmarried:
65.6% (6,054)
Marital status - Black or African American population 15 years and over
Males 58.2% Never married23.3% Now married5.6% Separated2.7% Widowed10.2% DivorcedFemales 51.0% Never married20.8% Now married3.3% Separated3.5% Widowed21.4% DivorcedWomen who did not give birth in the past 12 months Now married:
20.3% (133)Unmarried:
79.7% (522)
Marital status - American Indian / Alaska Native population 15 years and over
Males 24.6% Never married25.1% Now married0.0% Separated0.0% Widowed50.3% DivorcedFemales 36.1% Never married40.7% Now married0.0% Separated0.0% Widowed23.2% DivorcedWomen who did not give birth in the past 12 months Now married:
20.4% (47)Unmarried:
79.6% (184)
Marital status - Asian population 15 years and over
Males 41.9% Never married54.0% Now married0.0% Separated3.7% Widowed0.4% DivorcedFemales 24.0% Never married54.8% Now married4.5% Separated10.4% Widowed6.2% DivorcedWomen who gave birth in the past 12 months Now married:
100.0% (113)Unmarried:
0.0% (0)
Women who did not give birth in the past 12 months Now married:
50.3% (498)Unmarried:
49.7% (491)
Marital status - Native Hawaiian / Pacific Islander population 15 years and over
Males 20.2% Never married79.8% Now married0.0% Separated0.0% Widowed0.0% DivorcedFemales 21.4% Never married69.4% Now married0.0% Separated0.0% Widowed9.3% DivorcedWomen who gave birth in the past 12 months Now married:
100.0% (209)Unmarried:
0.0% (0)
Women who did not give birth in the past 12 months Now married:
0.0% (0)Unmarried:
100.0% (64)
Marital status - Other race population 15 years and over
Males 41.4% Never married55.5% Now married0.0% Separated0.0% Widowed3.0% DivorcedFemales 28.5% Never married51.0% Now married12.2% Separated5.3% Widowed3.0% DivorcedWomen who did not give birth in the past 12 months Now married:
54.4% (116)Unmarried:
45.6% (97)
Marital status - Two or more races population 15 years and over
Males 63.2% Never married29.7% Now married0.8% Separated0.0% Widowed6.2% DivorcedFemales 49.4% Never married30.9% Now married1.6% Separated3.9% Widowed14.1% DivorcedWomen who gave birth in the past 12 months Now married:
0.0% (0)Unmarried:
100.0% (50)
Women who did not give birth in the past 12 months Now married:
33.7% (484)Unmarried:
66.3% (953)
Marital status - White alone, not Hispanic / Latino population 15 years and over
Males 39.4% Never married44.8% Now married1.9% Separated2.8% Widowed11.0% DivorcedFemales 29.9% Never married38.4% Now married2.4% Separated9.9% Widowed19.4% DivorcedWomen who gave birth in the past 12 months Now married:
66.2% (204)Unmarried:
33.8% (104)
Women who did not give birth in the past 12 months Now married:
34.3% (3,011)Unmarried:
65.7% (5,781)
Marital status - Hispanic or Latino population 15 years and over
Males 52.8% Never married40.1% Now married0.0% Separated0.8% Widowed6.3% DivorcedFemales 42.5% Never married36.8% Now married5.4% Separated3.2% Widowed12.1% DivorcedWomen who gave birth in the past 12 months Now married:
66.5% (138)Unmarried:
33.5% (69)
Women who did not give birth in the past 12 months Now married:
35.4% (461)Unmarried:
64.6% (844)
Ancestries in Olympia
2,351 10.0% English2,106 8.9% German1,612 6.8% European1,588 6.7% Irish974 4.1% American792 3.4% Norwegian449 1.9% Italian427 1.8% Swedish425 1.8% Polish422 1.8% Scottish406 1.7% Scandinavian253 1.1% Dutch252 1.1% British191 0.8% Finnish168 0.7% Scotch-Irish164 0.7% French147 0.6% Northern European142 0.6% African132 0.6% Danish121 0.5% Romanian120 0.5% Nigerian111 0.5% Eastern European109 0.5% Haitian100 0.4% Welsh64 0.3% British West Indian53 0.2% Ukrainian48 0.2% Serbian44 0.2% Celtic39 0.2% Slovak38 0.2% Russian38 0.2% Turkish36 0.2% Lebanese34 0.1% Greek34 0.1% Canadian31 0.1% Czech30 0.1% French Canadian29 0.1% Cajun29 0.1% Slovene28 0.1% Swiss28 0.1% Czechoslovakian26 0.1% Kenyan23 0.10% Austrian17 0.07% Ethiopian14 0.06% Belgian13 0.06% Lithuanian13 0.06% Albanian13 0.06% Croatian8 0.03% West Indian6 0.03% Hungarian6 0.03% Afghan3 0.01% Slavic
Geographical mobility in Olympia Same house 1 year ago 31,890 78.2% White (Caucasian)1,269 69.1% Black or African American527 81.9% American Indian / Alaska Native3,245 79.3% Asian743 100.0% Native Hawaiian / Pacific Islander756 99.7% Other race5,209 80.9% Two or more races30,519 79.1% White alone, not Hispanic / Latino4,922 76.2% Hispanic or LatinoMoved within same county 3,765 9.2% White / Caucasian186 10.1% Black or African American88 13.8% American Indian / Alaska Native357 8.7% Asian21 2.8% Other race826 12.8% Two or more races3,337 8.6% White alone, not Hispanic / Latino721 11.2% Hispanic or LatinoMoved within same state 2,244 5.5% White / Caucasian32 1.8% Black or African American126 3.1% Asian202 3.1% Two or more races2,214 5.7% White alone, not Hispanic / Latino123 1.9% Hispanic or LatinoMoved from different state 2,327 5.7% White / Caucasian320 17.4% Black or African American197 4.8% Asian1 0.2% Other race131 2.0% Two or more races2,322 6.0% White alone, not Hispanic / Latino141 2.2% Hispanic or LatinoMoved from abroad 281 0.7% White57 1.4% Asian17 0.3% Two or more races91 0.2% White alone, not Hispanic / Latino112 1.7% Hispanic or Latino
Children Nativity (place of birth) in Olympia
Children under 6 years - Living with two parents Both parents native 1,182 100.0% NativeBoth parents foreign-born 178 100.0% NativeOne native, one foreign-born parent 554 100.0% NativeChildren under 6 years - Living with one parent Native parent 893 100.0% NativeForeign-born parent 134 100.0% NativeChildren 6 to 17 years - Living with two parents Both parents native 3,409 99.6% Native13 0.4% Foreign-bornBoth parents foreign-born 448 79.3% Native117 20.7% Foreign-bornOne native, one foreign-born parent 181 100.0% NativeChildren 6 to 17 years - Living with one parent Native parent 1,985 100.0% NativeForeign-born parent 330 64.1% Native185 35.9% Foreign-born
Grandparents responsible for own grandchildren in Olympia
Grandparents (30 to 59 years) White / Caucasian 30 17.9% Responsible for grandchildren137 82.1% Not responsible for grandchildrenBlack or African American 10 100.0% Not responsible for grandchildrenAsian 37 100.0% Responsible for grandchildrenOther race 11 100.0% Responsible for grandchildrenWhite alone, not Hispanic / Latino 30 18.2% Responsible for grandchildren134 81.8% Not responsible for grandchildrenHispanic or Latino 16 53.4% Responsible for grandchildren14 46.6% Not responsible for grandchildrenGrandparents (60 years and over) White / Caucasian 66 17.9% Responsible for grandchildren304 82.1% Not responsible for grandchildrenAsian 70 100.0% Not responsible for grandchildrenWhite alone, not Hispanic / Latino 66 23.6% Responsible for grandchildren215 76.4% Not responsible for grandchildrenHispanic or Latino 16 11.3% Responsible for grandchildren125 88.7% Not responsible for grandchildren