Races in Pampa, Texas (TX) Detailed Stats
Data:
Races - White alone (%)
Races - White alone (% change since 2000)
Races - Black alone (%)
Races - Black alone (% change since 2000)
Races - American Indian alone (%)
Races - American Indian alone (% change since 2000)
Races - Asian alone (%)
Races - Asian alone (% change since 2000)
Races - Hispanic (%)
Races - Hispanic (% change since 2000)
Races - Native Hawaiian and Other Pacific Islander alone (%)
Races - Native Hawaiian and Other Pacific Islander alone (% change since 2000)
Races - Two or more races(%)
Races - Two or more races(% change since 2000)
Races - Other race alone (%)
Races - Other race alone (% change since 2000)
Racial diversity
Place of birth - Born in state of residence (%)
Place of birth - Born in state of residence (%) - White
Place of birth - Born in state of residence (%) - Black or African American
Place of birth - Born in state of residence (%) - Asian
Place of birth - Born in state of residence (%) - Hispanic or Latino
Place of birth - Born in state of residence (%) - American Indian and Alaska Native
Place of birth - Born in state of residence (%) - Multirace
Place of birth - Born in state of residence (%) - Other Race
Place of birth - Born in other state (%)
Place of birth - Born in other state (%) - White
Place of birth - Born in other state (%) - Black or African American
Place of birth - Born in other state (%) - Asian
Place of birth - Born in other state (%) - Hispanic or Latino
Place of birth - Born in other state (%) - American Indian and Alaska Native
Place of birth - Born in other state (%) - Multirace
Place of birth - Born in other state (%) - Other Race
Place of birth - Native, outside of US (%)
Place of birth - Native, outside of US (%) - White
Place of birth - Native, outside of US (%) - Black or African American
Place of birth - Native, outside of US (%) - Asian
Place of birth - Native, outside of US (%) - Hispanic or Latino
Place of birth - Native, outside of US (%) - American Indian and Alaska Native
Place of birth - Native, outside of US (%) - Multirace
Place of birth - Native, outside of US (%) - Other Race
Place of birth - Foreign born (%)
Place of birth - Foreign born (%) - White
Place of birth - Foreign born (%) - Black or African American
Place of birth - Foreign born (%) - Asian
Place of birth - Foreign born (%) - Hispanic or Latino
Place of birth - Foreign born (%) - American Indian and Alaska Native
Place of birth - Foreign born (%) - Multirace
Place of birth - Foreign born (%) - Other Race
Residents speaking English at home (%)
Residents speaking English at home - Born in the United States (%)
Residents speaking English at home - Native, born elsewhere (%)
Residents speaking English at home - Foreign born (%)
Residents speaking Spanish at home (%)
Residents speaking Spanish at home - Born in the United States (%)
Residents speaking Spanish at home - Native, born elsewhere (%)
Residents speaking Spanish at home - Foreign born (%)
Residents speaking other language at home (%)
Residents speaking other language at home - Born in the United States (%)
Residents speaking other language at home - Native, born elsewhere (%)
Residents speaking other language at home - Foreign born (%)
Marital status - Never married (%)
Marital status - Now married (%)
Marital status - Separated (%)
Marital status - Widowed (%)
Marital status - Divorced (%)
Ancestries Reported - Arab (%)
Ancestries Reported - Czech (%)
Ancestries Reported - Danish (%)
Ancestries Reported - Dutch (%)
Ancestries Reported - English (%)
Ancestries Reported - French (%)
Ancestries Reported - French Canadian (%)
Ancestries Reported - German (%)
Ancestries Reported - Greek (%)
Ancestries Reported - Hungarian (%)
Ancestries Reported - Irish (%)
Ancestries Reported - Italian (%)
Ancestries Reported - Lithuanian (%)
Ancestries Reported - Norwegian (%)
Ancestries Reported - Polish (%)
Ancestries Reported - Portuguese (%)
Ancestries Reported - Russian (%)
Ancestries Reported - Scotch-Irish (%)
Ancestries Reported - Scottish (%)
Ancestries Reported - Slovak (%)
Ancestries Reported - Subsaharan African (%)
Ancestries Reported - Swedish (%)
Ancestries Reported - Swiss (%)
Ancestries Reported - Ukrainian (%)
Ancestries Reported - United States (%)
Ancestries Reported - Welsh (%)
Ancestries Reported - West Indian (%)
Ancestries Reported - Other (%)
Geographical mobility - Same house 1 year ago (%)
Geographical mobility - Same house 1 year ago (%) - White
Geographical mobility - Same house 1 year ago (%) - Black or African American
Geographical mobility - Same house 1 year ago (%) - Asian
Geographical mobility - Same house 1 year ago (%) - Hispanic or Latino
Geographical mobility - Same house 1 year ago (%) - American Indian and Alaska Native
Geographical mobility - Same house 1 year ago (%) - Multirace
Geographical mobility - Same house 1 year ago (%) - Other Race
Geographical mobility - Moved within same county (%)
Geographical mobility - Moved within same county (%) - White
Geographical mobility - Moved within same county (%) - Black or African American
Geographical mobility - Moved within same county (%) - Asian
Geographical mobility - Moved within same county (%) - Hispanic or Latino
Geographical mobility - Moved within same county (%) - American Indian and Alaska Native
Geographical mobility - Moved within same county (%) - Multirace
Geographical mobility - Moved within same county (%) - Other Race
Geographical mobility - Moved from different county within same state (%)
Geographical mobility - Moved from different county within same state (%) - White
Geographical mobility - Moved from different county within same state (%) - Black or African American
Geographical mobility - Moved from different county within same state (%) - Asian
Geographical mobility - Moved from different county within same state (%) - Hispanic or Latino
Geographical mobility - Moved from different county within same state (%) - American Indian and Alaska Native
Geographical mobility - Moved from different county within same state (%) - Multirace
Geographical mobility - Moved from different county within same state (%) - Other Race
Geographical mobility - Moved from different state (%)
Geographical mobility - Moved from different state (%) - White
Geographical mobility - Moved from different state (%) - Black or African American
Geographical mobility - Moved from different state (%) - Asian
Geographical mobility - Moved from different state (%) - Hispanic or Latino
Geographical mobility - Moved from different state (%) - American Indian and Alaska Native
Geographical mobility - Moved from different state (%) - Multirace
Geographical mobility - Moved from different state (%) - Other Race
Geographical mobility - Moved from abroad (%)
Geographical mobility - Moved from abroad (%) - White
Geographical mobility - Moved from abroad (%) - Black or African American
Geographical mobility - Moved from abroad (%) - Asian
Geographical mobility - Moved from abroad (%) - Hispanic or Latino
Geographical mobility - Moved from abroad (%) - American Indian and Alaska Native
Geographical mobility - Moved from abroad (%) - Multirace
Geographical mobility - Moved from abroad (%) - Other Race
Place of birth for the foreign-born population - Ireland (%)
Place of birth for the foreign-born population - Denmark (%)
Place of birth for the foreign-born population - Norway (%)
Place of birth for the foreign-born population - Sweden (%)
Place of birth for the foreign-born population - United Kingdom (%)
Place of birth for the foreign-born population - England (%)
Place of birth for the foreign-born population - Scotland (%)
Place of birth for the foreign-born population - Other Northern Europe (%)
Place of birth for the foreign-born population - Austria (%)
Place of birth for the foreign-born population - Belgium (%)
Place of birth for the foreign-born population - France (%)
Place of birth for the foreign-born population - Germany (%)
Place of birth for the foreign-born population - Netherlands (%)
Place of birth for the foreign-born population - Switzerland (%)
Place of birth for the foreign-born population - Other Western Europe (%)
Place of birth for the foreign-born population - Greece (%)
Place of birth for the foreign-born population - Italy (%)
Place of birth for the foreign-born population - Portugal (%)
Place of birth for the foreign-born population - Spain (%)
Place of birth for the foreign-born population - Other Southern Europe (%)
Place of birth for the foreign-born population - Albania (%)
Place of birth for the foreign-born population - Belarus (%)
Place of birth for the foreign-born population - Bosnia and Herzegovina (%)
Place of birth for the foreign-born population - Bulgaria (%)
Place of birth for the foreign-born population - Croatia (%)
Place of birth for the foreign-born population - Czechoslovakia (%)
Place of birth for the foreign-born population - Hungary (%)
Place of birth for the foreign-born population - Latvia (%)
Place of birth for the foreign-born population - Lithuania (%)
Place of birth for the foreign-born population - North Macedonia (Macedonia) (%)
Place of birth for the foreign-born population - Moldova (%)
Place of birth for the foreign-born population - Poland (%)
Place of birth for the foreign-born population - Romania (%)
Place of birth for the foreign-born population - Russia (%)
Place of birth for the foreign-born population - Serbia (%)
Place of birth for the foreign-born population - Ukraine (%)
Place of birth for the foreign-born population - Other Eastern Europe (%)
Place of birth for the foreign-born population - China (%)
Place of birth for the foreign-born population - Hong Kong (%)
Place of birth for the foreign-born population - Taiwan (%)
Place of birth for the foreign-born population - Japan (%)
Place of birth for the foreign-born population - Korea (%)
Place of birth for the foreign-born population - Other Eastern Asia (%)
Place of birth for the foreign-born population - Afghanistan (%)
Place of birth for the foreign-born population - Bangladesh (%)
Place of birth for the foreign-born population - India (%)
Place of birth for the foreign-born population - Iran (%)
Place of birth for the foreign-born population - Kazakhstan (%)
Place of birth for the foreign-born population - Nepal (%)
Place of birth for the foreign-born population - Pakistan (%)
Place of birth for the foreign-born population - Sri Lanka (%)
Place of birth for the foreign-born population - Uzbekistan (%)
Place of birth for the foreign-born population - Other South Central Asia (%)
Place of birth for the foreign-born population - Burma (%)
Place of birth for the foreign-born population - Cambodia (%)
Place of birth for the foreign-born population - Indonesia (%)
Place of birth for the foreign-born population - Laos (%)
Place of birth for the foreign-born population - Malaysia (%)
Place of birth for the foreign-born population - Philippines (%)
Place of birth for the foreign-born population - Singapore (%)
Place of birth for the foreign-born population - Thailand (%)
Place of birth for the foreign-born population - Vietnam (%)
Place of birth for the foreign-born population - Other South Eastern Asia (%)
Place of birth for the foreign-born population - Armenia (%)
Place of birth for the foreign-born population - Iraq (%)
Place of birth for the foreign-born population - Israel (%)
Place of birth for the foreign-born population - Jordan (%)
Place of birth for the foreign-born population - Kuwait (%)
Place of birth for the foreign-born population - Lebanon (%)
Place of birth for the foreign-born population - Saudi Arabia (%)
Place of birth for the foreign-born population - Syria (%)
Place of birth for the foreign-born population - Turkey (%)
Place of birth for the foreign-born population - Yemen (%)
Place of birth for the foreign-born population - Other Western Asia (%)
Place of birth for the foreign-born population - Eritrea (%)
Place of birth for the foreign-born population - Ethiopia (%)
Place of birth for the foreign-born population - Kenya (%)
Place of birth for the foreign-born population - Somalia (%)
Place of birth for the foreign-born population - Uganda (%)
Place of birth for the foreign-born population - Zimbabwe (%)
Place of birth for the foreign-born population - Other Eastern Africa (%)
Place of birth for the foreign-born population - Cameroon (%)
Place of birth for the foreign-born population - Congo (%)
Place of birth for the foreign-born population - Democratic Republic of Congo (Zaire) (%)
Place of birth for the foreign-born population - Other Middle Africa (%)
Place of birth for the foreign-born population - Egypt (%)
Place of birth for the foreign-born population - Morocco (%)
Place of birth for the foreign-born population - Sudan (%)
Place of birth for the foreign-born population - Other Northern Africa (%)
Place of birth for the foreign-born population - South Africa (%)
Place of birth for the foreign-born population - Other Southern Africa (%)
Place of birth for the foreign-born population - Cabo Verde (%)
Place of birth for the foreign-born population - Ghana (%)
Place of birth for the foreign-born population - Liberia (%)
Place of birth for the foreign-born population - Nigeria (%)
Place of birth for the foreign-born population - Senegal (%)
Place of birth for the foreign-born population - Sierra Leone (%)
Place of birth for the foreign-born population - Other Western Africa (%)
Place of birth for the foreign-born population - Australia (%)
Place of birth for the foreign-born population - New Zealand (%)
Place of birth for the foreign-born population - Fiji (%)
Place of birth for the foreign-born population - Micronesia (%)
Place of birth for the foreign-born population - Bahamas (%)
Place of birth for the foreign-born population - Barbados (%)
Place of birth for the foreign-born population - Cuba (%)
Place of birth for the foreign-born population - Dominica (%)
Place of birth for the foreign-born population - Dominican Republic (%)
Place of birth for the foreign-born population - Grenada (%)
Place of birth for the foreign-born population - Haiti (%)
Place of birth for the foreign-born population - Jamaica (%)
Place of birth for the foreign-born population - St. Vincent and the Grenadines (%)
Place of birth for the foreign-born population - Trinidad and Tobago (%)
Place of birth for the foreign-born population - West Indies (%)
Place of birth for the foreign-born population - Other Caribbean (%)
Place of birth for the foreign-born population - Belize (%)
Place of birth for the foreign-born population - Costa Rica (%)
Place of birth for the foreign-born population - El Salvador (%)
Place of birth for the foreign-born population - Guatemala (%)
Place of birth for the foreign-born population - Honduras (%)
Place of birth for the foreign-born population - Mexico (%)
Place of birth for the foreign-born population - Nicaragua (%)
Place of birth for the foreign-born population - Panama (%)
Place of birth for the foreign-born population - Other Central America (%)
Place of birth for the foreign-born population - Argentina (%)
Place of birth for the foreign-born population - Bolivia (%)
Place of birth for the foreign-born population - Brazil (%)
Place of birth for the foreign-born population - Chile (%)
Place of birth for the foreign-born population - Colombia (%)
Place of birth for the foreign-born population - Ecuador (%)
Place of birth for the foreign-born population - Guyana (%)
Place of birth for the foreign-born population - Peru (%)
Place of birth for the foreign-born population - Uruguay (%)
Place of birth for the foreign-born population - Venezuela (%)
Place of birth for the foreign-born population - Other South America (%)
Place of birth for the foreign-born population - Canada (%)
Place of birth for the foreign-born population - Other Northern America (%)
Place of birth for the foreign-born population - Other (%)
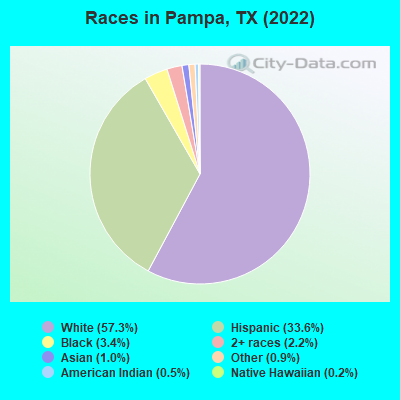
According to 2022 data, the most numerous races in Pampa, TX are Hispanic (5,819 residents), White alone (9,923 residents), and Black alone (589 residents). 77.3% of Pampa residents speak English at home. 11.6% of Pampa, TX residents are foreign-born (10.4% born in Latin America), which is 46.3% less than the foreign-born rate of 17.0% across the entire state of Texas.
Race distribution in Pampa
2000 2022
10,933,313 52.4% White alone 6,669,666 32.0% Hispanic 2,364,255 11.3% Black alone 554,445 2.7% Asian alone 230,567 1.1% Two or more races 68,859 0.3% American Indian alone 19,958 0.10% Other race alone 10,757 0.05% Native Hawaiian and Other
12,070,642 40.2% Hispanic 11,683,430 38.9% White alone 3,508,706 11.7% Black alone 1,608,173 5.4% Asian alone 956,560 3.2% Two or more races 125,763 0.4% Other race alone 47,023 0.2% American Indian alone 29,275 0.10% Native Hawaiian and Other
Income and house value in Pampa Median household income in 2022 $56,458 White non-Hispanic householders$40,439 Black householders$28,695 American Indian and Alaska Native householders$53,690 Asian householders$38,292 Some other race householders$26,029 Two or more races householders$39,942 Hispanic or Latino race householdersMedian 2022 house value $113,419 White Non-Hispanic householders$46,346 Black or African American householders$93,556 American Indian or Alaska Native householders $539,750 Asian householders$59,012 Some other race householders$75,708 Two or more races householders$61,315 Hispanic or Latino householders
Median age by race in Pampa
39.4 Median age for White residents38.1 42.2 34.6 Median age for Black or African American residents34.2 39.4 20.4 Median age for American Indian / Alaska Native residents20.2 24.9 27.5 Median age for Asian residents17.2 29.0 -581,560,283.1 Median age for Native Hawaiian / Pacific Islander residents-612,729,233.5 -577,777,777.2 27.1 Median age for Other race residents25.7 35.8 24.8 Median age for Two or more races residents16.7 25.9 46.3 Median age for White alone residents42.7 47.5 24.9 Median age for Hispanic or Latino residents24.4 25.9
Owner/renter occupied households by race in Pampa
House owners and renters - White residents 3,427 68.1% Owner occupied1,602 31.9% Renter occupiedHouse owners and renters - Black or African American residents 150 70.4% Owner occupied63 29.6% Renter occupiedHouse owners and renters - American Indian / Alaska Native residents 52 69.1% Owner occupied23 30.9% Renter occupiedHouse owners and renters - Asian residents 107 66.3% Owner occupied55 33.7% Renter occupiedHouse owners and renters - Other race residents 605 80.6% Owner occupied146 19.4% Renter occupiedHouse owners and renters - Two or more races residents 442 78.1% Owner occupied124 21.9% Renter occupiedHouse owners and renters - White alone residents 3,364 68.3% Owner occupied1,558 31.7% Renter occupiedHouse owners and renters - Hispanic or Latino residents 1,215 69.5% Owner occupied534 30.5% Renter occupied
Language usage in Pampa
English speakers - Total 77.3% of residents of Pampa speak English at home.
21.9% of residents speak Spanish at home 2,083 58.7% Speak English very well1,467 41.3% Speak English less than very well0.6% of residents speak other language at home 62 68.1% Speak English very well29 31.9% Speak English less than very well
English speakers - Born in the United States 84.1% of residents of Pampa speak English at home.
15.6% of residents speak Spanish at home 537 96.2% Speak English very well21 3.8% Speak English less than very well0.2% of residents speak other language at home 8 100.0% Speak English very well
English speakers - Native, born elsewhere 98.9% of residents of Pampa speak English at home.
English speakers - Foreign-born 15.0% of residents of Pampa speak English at home.
82.2% of residents speak Spanish at home 429 26.0% Speak English very well1,224 74.0% Speak English less than very well2.0% of residents speak other language at home 27 65.9% Speak English very well14 34.1% Speak English less than very well
White (Caucasian) - Speak only English Native:
99.2% (9,744)Foreign-born:
33.2% (151)
White (Caucasian) - Speak another language Native:
5.2% (506)Foreign-born:
71.8% (326)
Black or African American - Speak only English Native:
100.0% (580)Foreign-born:
90.7% (11)
American Indian / Alaska Native - Speak another language Native:
39.5% (79)Foreign-born:
98.9% (47)
Asian - Speak only English Native:
77.5% (122)Foreign-born:
76.3% (87)
Asian - Speak another language Native:
23.1% (36)Foreign-born:
26.1% (30)
Other race - Speak only English Native:
32.1% (350)Foreign-born:
1.6% (14)
Other race - Speak another language Native:
67.7% (739)Foreign-born:
98.0% (849)
Two or more races - Speak only English Native:
64.8% (947)Foreign-born:
2.1% (5)
Two or more races - Speak another language Native:
32.7% (479)Foreign-born:
98.1% (232)
White alone - Speak only English Native:
99.7% (9,409)Foreign-born:
86.1% (65)
White alone - Speak another language Native:
0.4% (40)Foreign-born:
14.1% (11)
Hispanic or Latino - Speak only English Native:
46.5% (1,633)Foreign-born:
8.1% (146)
Hispanic or Latino - Speak another language Native:
53.6% (1,883)Foreign-born:
92.1% (1,659)
Foreign-born residents in Pampa 2,012 residents are foreign born (10.4% Latin America ).
This city:
11.6%Texas:
17.1%
Marital status for residents in Pampa Marital status - White (Caucasian) population 15 years and over
Males 22.6% Never married61.8% Now married2.1% Separated2.9% Widowed10.7% DivorcedFemales 15.8% Never married55.0% Now married4.6% Separated11.1% Widowed13.5% DivorcedWomen who gave birth in the past 12 months Now married:
40.6% (44)Unmarried:
59.4% (64)
Women who did not give birth in the past 12 months Now married:
62.1% (1,326)Unmarried:
37.9% (809)
Marital status - Black or African American population 15 years and over
Males 39.4% Never married24.2% Now married12.9% Separated10.0% Widowed13.5% DivorcedFemales 19.9% Never married16.5% Now married22.2% Separated18.8% Widowed22.7% DivorcedWomen who did not give birth in the past 12 months Now married:
62.8% (60)Unmarried:
37.2% (35)
Marital status - American Indian / Alaska Native population 15 years and over
Males 63.5% Never married36.5% Now married0.0% Separated0.0% Widowed0.0% DivorcedFemales 41.0% Never married11.5% Now married0.0% Separated34.4% Widowed13.1% DivorcedWomen who gave birth in the past 12 months Now married:
0.0% (0)Unmarried:
100.0% (6)
Women who did not give birth in the past 12 months Now married:
19.4% (10)Unmarried:
80.6% (42)
Marital status - Asian population 15 years and over
Males 90.0% Never married5.7% Now married0.0% Separated0.0% Widowed4.3% DivorcedFemales 93.3% Never married6.7% Now married0.0% Separated0.0% Widowed0.0% DivorcedWomen who did not give birth in the past 12 months Now married:
6.7% (8)Unmarried:
93.3% (104)
Marital status - Other race population 15 years and over
Males 27.9% Never married50.1% Now married15.1% Separated0.0% Widowed7.0% DivorcedFemales 29.1% Never married40.0% Now married0.7% Separated4.5% Widowed25.7% DivorcedWomen who gave birth in the past 12 months Now married:
1.2% (1)Unmarried:
98.8% (117)
Women who did not give birth in the past 12 months Now married:
43.4% (152)Unmarried:
56.6% (199)
Marital status - Two or more races population 15 years and over
Males 46.5% Never married45.9% Now married0.6% Separated1.7% Widowed5.3% DivorcedFemales 19.8% Never married36.9% Now married20.7% Separated4.5% Widowed18.0% DivorcedWomen who gave birth in the past 12 months Now married:
100.0% (13)Unmarried:
0.0% (0)
Women who did not give birth in the past 12 months Now married:
61.3% (240)Unmarried:
38.7% (152)
Marital status - White alone, not Hispanic / Latino population 15 years and over
Males 19.1% Never married62.4% Now married1.8% Separated3.6% Widowed13.1% DivorcedFemales 14.8% Never married53.5% Now married3.6% Separated12.6% Widowed15.6% DivorcedWomen who gave birth in the past 12 months Now married:
26.9% (29)Unmarried:
73.1% (78)
Women who did not give birth in the past 12 months Now married:
59.7% (1,154)Unmarried:
40.3% (777)
Marital status - Hispanic or Latino population 15 years and over
Males 39.6% Never married50.8% Now married6.7% Separated0.3% Widowed2.6% DivorcedFemales 24.3% Never married50.1% Now married9.5% Separated4.6% Widowed11.5% DivorcedWomen who gave birth in the past 12 months Now married:
27.6% (35)Unmarried:
72.4% (93)
Women who did not give birth in the past 12 months Now married:
61.0% (760)Unmarried:
39.0% (487)
Ancestries in Pampa
975 10.9% American859 9.6% English579 6.5% German405 4.5% Irish176 2.0% European137 1.5% Italian133 1.5% Scottish51 0.6% Czech48 0.5% Norwegian43 0.5% Polish37 0.4% British33 0.4% Swedish22 0.2% Scotch-Irish15 0.2% Czechoslovakian10 0.1% Trinidadian and Tobagonian4 0.04% Dutch West Indian
Geographical mobility in Pampa Same house 1 year ago 9,011 84.9% White (Caucasian)292 49.2% Black or African American293 100.0% American Indian / Alaska Native221 81.1% Asian33 98.2% Native Hawaiian / Pacific Islander1,850 85.6% Other race1,590 82.6% Two or more races8,216 83.6% White alone, not Hispanic / Latino5,207 90.1% Hispanic or LatinoMoved within same county 571 5.4% White / Caucasian260 44.0% Black or African American6 2.0% American Indian / Alaska Native12 0.6% Other race171 8.9% Two or more races614 6.2% White alone, not Hispanic / Latino143 2.5% Hispanic or LatinoMoved within same state 581 5.5% White / Caucasian5 0.9% Black or African American7 2.6% Asian288 13.3% Other race129 6.7% Two or more races548 5.6% White alone, not Hispanic / Latino316 5.5% Hispanic or LatinoMoved from different state 534 5.0% White / Caucasian9 0.4% Other race23 1.2% Two or more races445 4.5% White alone, not Hispanic / Latino136 2.4% Hispanic or LatinoMoved from abroad 5 0.0% White50 18.3% Asian7 0.1% White alone, not Hispanic / Latino
Children Nativity (place of birth) in Pampa
Children under 6 years - Living with two parents Both parents native 418 100.0% NativeBoth parents foreign-born 191 100.0% NativeOne native, one foreign-born parent 106 100.0% NativeChildren under 6 years - Living with one parent Native parent 488 100.0% NativeForeign-born parent 29 100.0% NativeChildren 6 to 17 years - Living with two parents Both parents native 1,575 100.0% Native1 0.0% Foreign-bornBoth parents foreign-born 289 65.2% Native154 34.8% Foreign-bornOne native, one foreign-born parent 226 99.0% Native2 1.0% Foreign-bornChildren 6 to 17 years - Living with one parent Native parent 440 100.0% NativeForeign-born parent 130 59.0% Native90 41.0% Foreign-born
Grandparents responsible for own grandchildren in Pampa
Grandparents (30 to 59 years) White / Caucasian 29 55.0% Responsible for grandchildren23 45.0% Not responsible for grandchildrenOther race 39 56.5% Responsible for grandchildren30 43.5% Not responsible for grandchildrenWhite alone, not Hispanic / Latino 37 50.5% Responsible for grandchildren37 49.5% Not responsible for grandchildrenHispanic or Latino 32 57.6% Responsible for grandchildren23 42.4% Not responsible for grandchildrenGrandparents (60 years and over) White / Caucasian 52 45.1% Responsible for grandchildren63 54.9% Not responsible for grandchildrenOther race 10 100.0% Not responsible for grandchildrenWhite alone, not Hispanic / Latino 61 55.5% Responsible for grandchildren49 44.5% Not responsible for grandchildrenHispanic or Latino 40 100.0% Not responsible for grandchildren