Races in Rockwall, Texas (TX) Detailed Stats
Data:
Races - White alone (%)
Races - White alone (% change since 2000)
Races - Black alone (%)
Races - Black alone (% change since 2000)
Races - American Indian alone (%)
Races - American Indian alone (% change since 2000)
Races - Asian alone (%)
Races - Asian alone (% change since 2000)
Races - Hispanic (%)
Races - Hispanic (% change since 2000)
Races - Native Hawaiian and Other Pacific Islander alone (%)
Races - Native Hawaiian and Other Pacific Islander alone (% change since 2000)
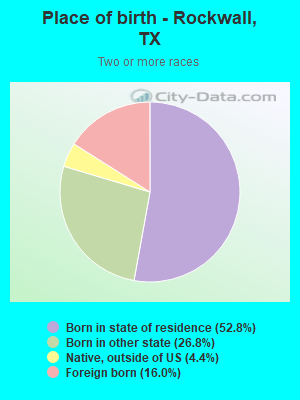
Races - Two or more races(%)
Races - Two or more races(% change since 2000)
Races - Other race alone (%)
Races - Other race alone (% change since 2000)
Racial diversity
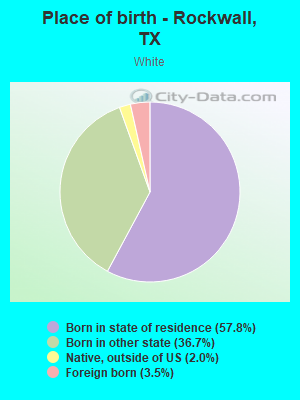
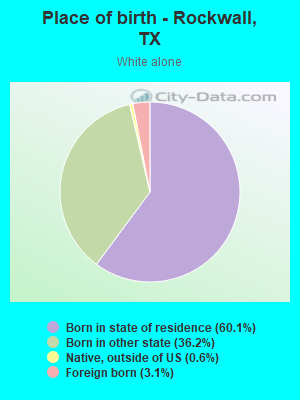
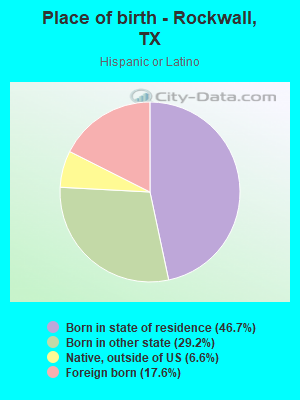
Place of birth - Born in state of residence (%)
Place of birth - Born in state of residence (%) - White
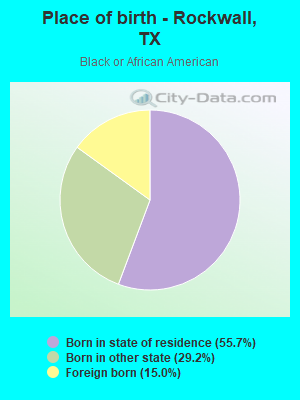
Place of birth - Born in state of residence (%) - Black or African American
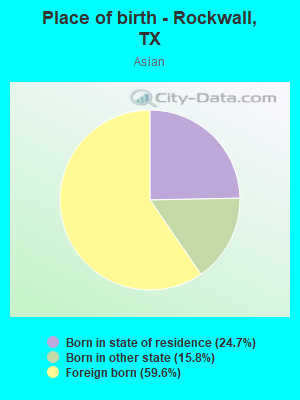
Place of birth - Born in state of residence (%) - Asian
Place of birth - Born in state of residence (%) - Hispanic or Latino
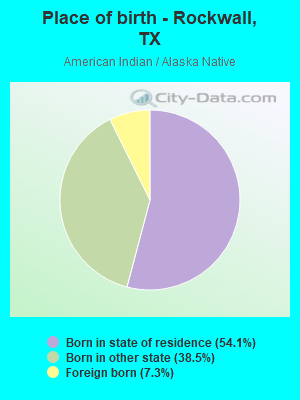
Place of birth - Born in state of residence (%) - American Indian and Alaska Native
Place of birth - Born in state of residence (%) - Multirace
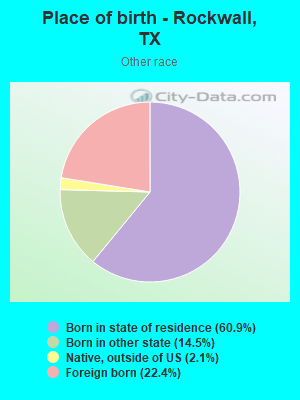
Place of birth - Born in state of residence (%) - Other Race
Place of birth - Born in other state (%)
Place of birth - Born in other state (%) - White
Place of birth - Born in other state (%) - Black or African American
Place of birth - Born in other state (%) - Asian
Place of birth - Born in other state (%) - Hispanic or Latino
Place of birth - Born in other state (%) - American Indian and Alaska Native
Place of birth - Born in other state (%) - Multirace
Place of birth - Born in other state (%) - Other Race
Place of birth - Native, outside of US (%)
Place of birth - Native, outside of US (%) - White
Place of birth - Native, outside of US (%) - Black or African American
Place of birth - Native, outside of US (%) - Asian
Place of birth - Native, outside of US (%) - Hispanic or Latino
Place of birth - Native, outside of US (%) - American Indian and Alaska Native
Place of birth - Native, outside of US (%) - Multirace
Place of birth - Native, outside of US (%) - Other Race
Place of birth - Foreign born (%)
Place of birth - Foreign born (%) - White
Place of birth - Foreign born (%) - Black or African American
Place of birth - Foreign born (%) - Asian
Place of birth - Foreign born (%) - Hispanic or Latino
Place of birth - Foreign born (%) - American Indian and Alaska Native
Place of birth - Foreign born (%) - Multirace
Place of birth - Foreign born (%) - Other Race
Residents speaking English at home (%)
Residents speaking English at home - Born in the United States (%)
Residents speaking English at home - Native, born elsewhere (%)
Residents speaking English at home - Foreign born (%)
Residents speaking Spanish at home (%)
Residents speaking Spanish at home - Born in the United States (%)
Residents speaking Spanish at home - Native, born elsewhere (%)
Residents speaking Spanish at home - Foreign born (%)
Residents speaking other language at home (%)
Residents speaking other language at home - Born in the United States (%)
Residents speaking other language at home - Native, born elsewhere (%)
Residents speaking other language at home - Foreign born (%)
Marital status - Never married (%)
Marital status - Now married (%)
Marital status - Separated (%)
Marital status - Widowed (%)
Marital status - Divorced (%)
Ancestries Reported - Arab (%)
Ancestries Reported - Czech (%)
Ancestries Reported - Danish (%)
Ancestries Reported - Dutch (%)
Ancestries Reported - English (%)
Ancestries Reported - French (%)
Ancestries Reported - French Canadian (%)
Ancestries Reported - German (%)
Ancestries Reported - Greek (%)
Ancestries Reported - Hungarian (%)
Ancestries Reported - Irish (%)
Ancestries Reported - Italian (%)
Ancestries Reported - Lithuanian (%)
Ancestries Reported - Norwegian (%)
Ancestries Reported - Polish (%)
Ancestries Reported - Portuguese (%)
Ancestries Reported - Russian (%)
Ancestries Reported - Scotch-Irish (%)
Ancestries Reported - Scottish (%)
Ancestries Reported - Slovak (%)
Ancestries Reported - Subsaharan African (%)
Ancestries Reported - Swedish (%)
Ancestries Reported - Swiss (%)
Ancestries Reported - Ukrainian (%)
Ancestries Reported - United States (%)
Ancestries Reported - Welsh (%)
Ancestries Reported - West Indian (%)
Ancestries Reported - Other (%)
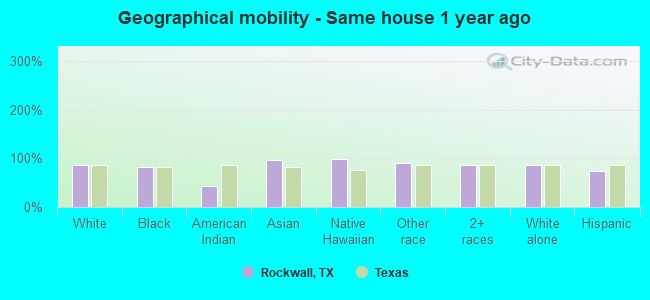
Geographical mobility - Same house 1 year ago (%)
Geographical mobility - Same house 1 year ago (%) - White
Geographical mobility - Same house 1 year ago (%) - Black or African American
Geographical mobility - Same house 1 year ago (%) - Asian
Geographical mobility - Same house 1 year ago (%) - Hispanic or Latino
Geographical mobility - Same house 1 year ago (%) - American Indian and Alaska Native
Geographical mobility - Same house 1 year ago (%) - Multirace
Geographical mobility - Same house 1 year ago (%) - Other Race
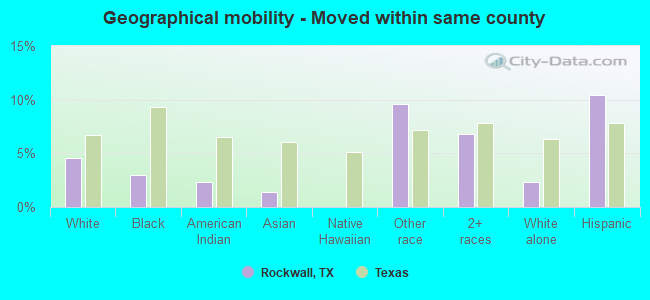
Geographical mobility - Moved within same county (%)
Geographical mobility - Moved within same county (%) - White
Geographical mobility - Moved within same county (%) - Black or African American
Geographical mobility - Moved within same county (%) - Asian
Geographical mobility - Moved within same county (%) - Hispanic or Latino
Geographical mobility - Moved within same county (%) - American Indian and Alaska Native
Geographical mobility - Moved within same county (%) - Multirace
Geographical mobility - Moved within same county (%) - Other Race
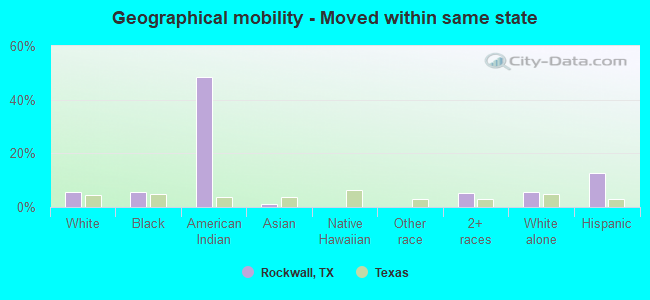
Geographical mobility - Moved from different county within same state (%)
Geographical mobility - Moved from different county within same state (%) - White
Geographical mobility - Moved from different county within same state (%) - Black or African American
Geographical mobility - Moved from different county within same state (%) - Asian
Geographical mobility - Moved from different county within same state (%) - Hispanic or Latino
Geographical mobility - Moved from different county within same state (%) - American Indian and Alaska Native
Geographical mobility - Moved from different county within same state (%) - Multirace
Geographical mobility - Moved from different county within same state (%) - Other Race
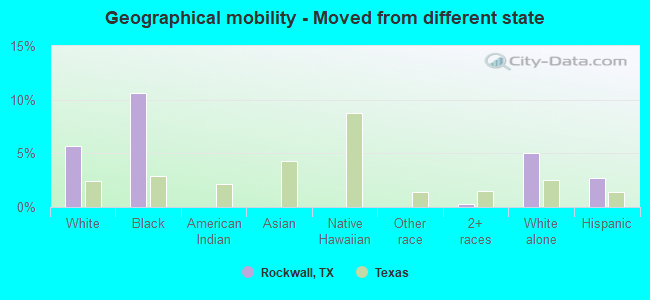
Geographical mobility - Moved from different state (%)
Geographical mobility - Moved from different state (%) - White
Geographical mobility - Moved from different state (%) - Black or African American
Geographical mobility - Moved from different state (%) - Asian
Geographical mobility - Moved from different state (%) - Hispanic or Latino
Geographical mobility - Moved from different state (%) - American Indian and Alaska Native
Geographical mobility - Moved from different state (%) - Multirace
Geographical mobility - Moved from different state (%) - Other Race
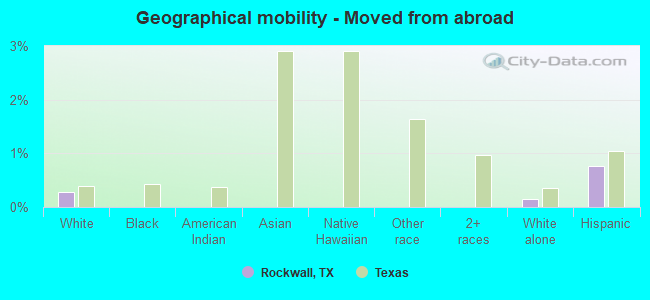
Geographical mobility - Moved from abroad (%)
Geographical mobility - Moved from abroad (%) - White
Geographical mobility - Moved from abroad (%) - Black or African American
Geographical mobility - Moved from abroad (%) - Asian
Geographical mobility - Moved from abroad (%) - Hispanic or Latino
Geographical mobility - Moved from abroad (%) - American Indian and Alaska Native
Geographical mobility - Moved from abroad (%) - Multirace
Geographical mobility - Moved from abroad (%) - Other Race
Place of birth for the foreign-born population - Ireland (%)
Place of birth for the foreign-born population - Denmark (%)
Place of birth for the foreign-born population - Norway (%)
Place of birth for the foreign-born population - Sweden (%)
Place of birth for the foreign-born population - United Kingdom (%)
Place of birth for the foreign-born population - England (%)
Place of birth for the foreign-born population - Scotland (%)
Place of birth for the foreign-born population - Other Northern Europe (%)
Place of birth for the foreign-born population - Austria (%)
Place of birth for the foreign-born population - Belgium (%)
Place of birth for the foreign-born population - France (%)
Place of birth for the foreign-born population - Germany (%)
Place of birth for the foreign-born population - Netherlands (%)
Place of birth for the foreign-born population - Switzerland (%)
Place of birth for the foreign-born population - Other Western Europe (%)
Place of birth for the foreign-born population - Greece (%)
Place of birth for the foreign-born population - Italy (%)
Place of birth for the foreign-born population - Portugal (%)
Place of birth for the foreign-born population - Spain (%)
Place of birth for the foreign-born population - Other Southern Europe (%)
Place of birth for the foreign-born population - Albania (%)
Place of birth for the foreign-born population - Belarus (%)
Place of birth for the foreign-born population - Bosnia and Herzegovina (%)
Place of birth for the foreign-born population - Bulgaria (%)
Place of birth for the foreign-born population - Croatia (%)
Place of birth for the foreign-born population - Czechoslovakia (%)
Place of birth for the foreign-born population - Hungary (%)
Place of birth for the foreign-born population - Latvia (%)
Place of birth for the foreign-born population - Lithuania (%)
Place of birth for the foreign-born population - North Macedonia (Macedonia) (%)
Place of birth for the foreign-born population - Moldova (%)
Place of birth for the foreign-born population - Poland (%)
Place of birth for the foreign-born population - Romania (%)
Place of birth for the foreign-born population - Russia (%)
Place of birth for the foreign-born population - Serbia (%)
Place of birth for the foreign-born population - Ukraine (%)
Place of birth for the foreign-born population - Other Eastern Europe (%)
Place of birth for the foreign-born population - China (%)
Place of birth for the foreign-born population - Hong Kong (%)
Place of birth for the foreign-born population - Taiwan (%)
Place of birth for the foreign-born population - Japan (%)
Place of birth for the foreign-born population - Korea (%)
Place of birth for the foreign-born population - Other Eastern Asia (%)
Place of birth for the foreign-born population - Afghanistan (%)
Place of birth for the foreign-born population - Bangladesh (%)
Place of birth for the foreign-born population - India (%)
Place of birth for the foreign-born population - Iran (%)
Place of birth for the foreign-born population - Kazakhstan (%)
Place of birth for the foreign-born population - Nepal (%)
Place of birth for the foreign-born population - Pakistan (%)
Place of birth for the foreign-born population - Sri Lanka (%)
Place of birth for the foreign-born population - Uzbekistan (%)
Place of birth for the foreign-born population - Other South Central Asia (%)
Place of birth for the foreign-born population - Burma (%)
Place of birth for the foreign-born population - Cambodia (%)
Place of birth for the foreign-born population - Indonesia (%)
Place of birth for the foreign-born population - Laos (%)
Place of birth for the foreign-born population - Malaysia (%)
Place of birth for the foreign-born population - Philippines (%)
Place of birth for the foreign-born population - Singapore (%)
Place of birth for the foreign-born population - Thailand (%)
Place of birth for the foreign-born population - Vietnam (%)
Place of birth for the foreign-born population - Other South Eastern Asia (%)
Place of birth for the foreign-born population - Armenia (%)
Place of birth for the foreign-born population - Iraq (%)
Place of birth for the foreign-born population - Israel (%)
Place of birth for the foreign-born population - Jordan (%)
Place of birth for the foreign-born population - Kuwait (%)
Place of birth for the foreign-born population - Lebanon (%)
Place of birth for the foreign-born population - Saudi Arabia (%)
Place of birth for the foreign-born population - Syria (%)
Place of birth for the foreign-born population - Turkey (%)
Place of birth for the foreign-born population - Yemen (%)
Place of birth for the foreign-born population - Other Western Asia (%)
Place of birth for the foreign-born population - Eritrea (%)
Place of birth for the foreign-born population - Ethiopia (%)
Place of birth for the foreign-born population - Kenya (%)
Place of birth for the foreign-born population - Somalia (%)
Place of birth for the foreign-born population - Uganda (%)
Place of birth for the foreign-born population - Zimbabwe (%)
Place of birth for the foreign-born population - Other Eastern Africa (%)
Place of birth for the foreign-born population - Cameroon (%)
Place of birth for the foreign-born population - Congo (%)
Place of birth for the foreign-born population - Democratic Republic of Congo (Zaire) (%)
Place of birth for the foreign-born population - Other Middle Africa (%)
Place of birth for the foreign-born population - Egypt (%)
Place of birth for the foreign-born population - Morocco (%)
Place of birth for the foreign-born population - Sudan (%)
Place of birth for the foreign-born population - Other Northern Africa (%)
Place of birth for the foreign-born population - South Africa (%)
Place of birth for the foreign-born population - Other Southern Africa (%)
Place of birth for the foreign-born population - Cabo Verde (%)
Place of birth for the foreign-born population - Ghana (%)
Place of birth for the foreign-born population - Liberia (%)
Place of birth for the foreign-born population - Nigeria (%)
Place of birth for the foreign-born population - Senegal (%)
Place of birth for the foreign-born population - Sierra Leone (%)
Place of birth for the foreign-born population - Other Western Africa (%)
Place of birth for the foreign-born population - Australia (%)
Place of birth for the foreign-born population - New Zealand (%)
Place of birth for the foreign-born population - Fiji (%)
Place of birth for the foreign-born population - Micronesia (%)
Place of birth for the foreign-born population - Bahamas (%)
Place of birth for the foreign-born population - Barbados (%)
Place of birth for the foreign-born population - Cuba (%)
Place of birth for the foreign-born population - Dominica (%)
Place of birth for the foreign-born population - Dominican Republic (%)
Place of birth for the foreign-born population - Grenada (%)
Place of birth for the foreign-born population - Haiti (%)
Place of birth for the foreign-born population - Jamaica (%)
Place of birth for the foreign-born population - St. Vincent and the Grenadines (%)
Place of birth for the foreign-born population - Trinidad and Tobago (%)
Place of birth for the foreign-born population - West Indies (%)
Place of birth for the foreign-born population - Other Caribbean (%)
Place of birth for the foreign-born population - Belize (%)
Place of birth for the foreign-born population - Costa Rica (%)
Place of birth for the foreign-born population - El Salvador (%)
Place of birth for the foreign-born population - Guatemala (%)
Place of birth for the foreign-born population - Honduras (%)
Place of birth for the foreign-born population - Mexico (%)
Place of birth for the foreign-born population - Nicaragua (%)
Place of birth for the foreign-born population - Panama (%)
Place of birth for the foreign-born population - Other Central America (%)
Place of birth for the foreign-born population - Argentina (%)
Place of birth for the foreign-born population - Bolivia (%)
Place of birth for the foreign-born population - Brazil (%)
Place of birth for the foreign-born population - Chile (%)
Place of birth for the foreign-born population - Colombia (%)
Place of birth for the foreign-born population - Ecuador (%)
Place of birth for the foreign-born population - Guyana (%)
Place of birth for the foreign-born population - Peru (%)
Place of birth for the foreign-born population - Uruguay (%)
Place of birth for the foreign-born population - Venezuela (%)
Place of birth for the foreign-born population - Other South America (%)
Place of birth for the foreign-born population - Canada (%)
Place of birth for the foreign-born population - Other Northern America (%)
Place of birth for the foreign-born population - Other (%)
Latest news about races in Rockwall, TX collected exclusively by city-data.com from local newspapers, TV, and radio stations
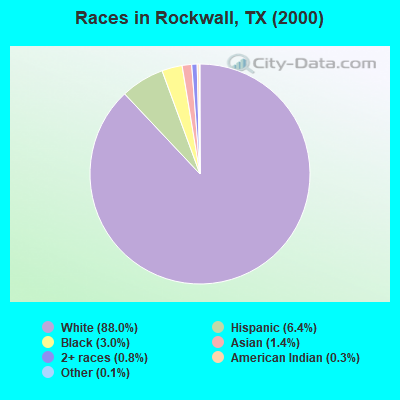
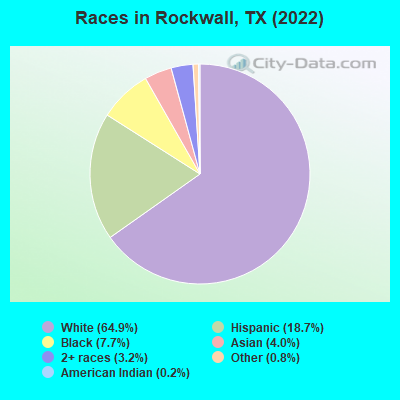
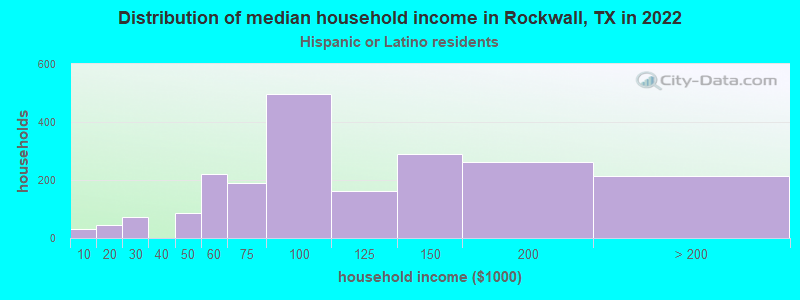
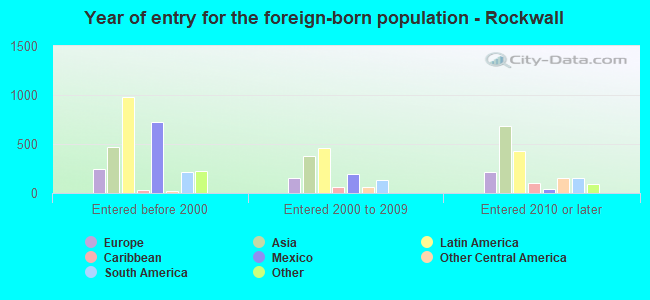
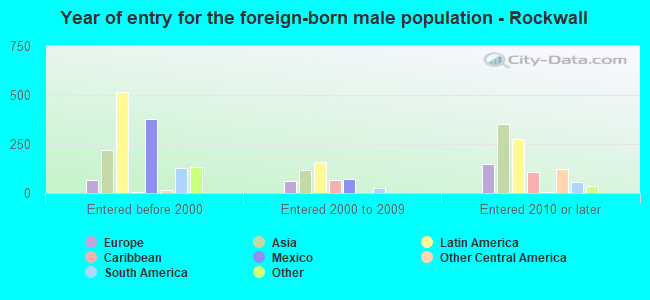
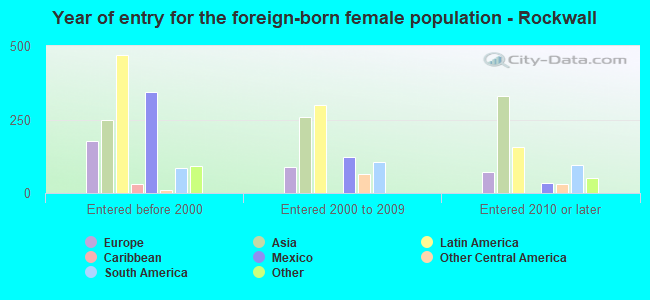
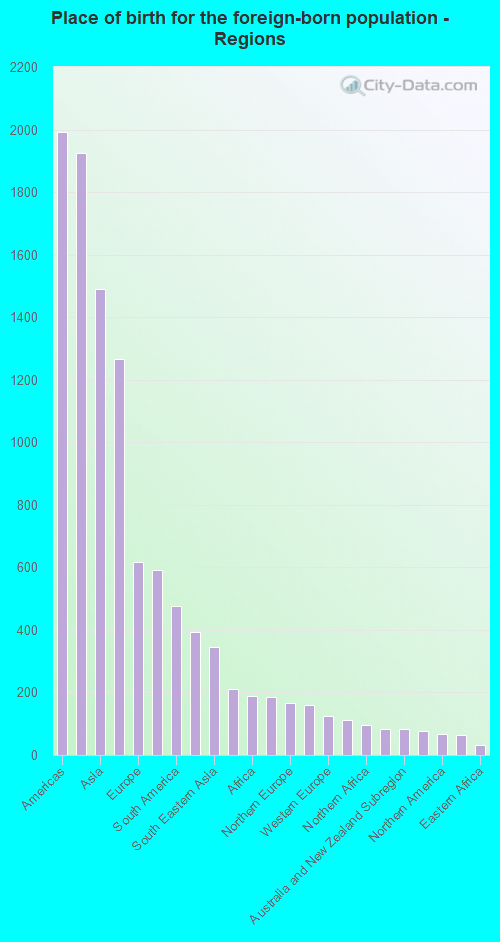
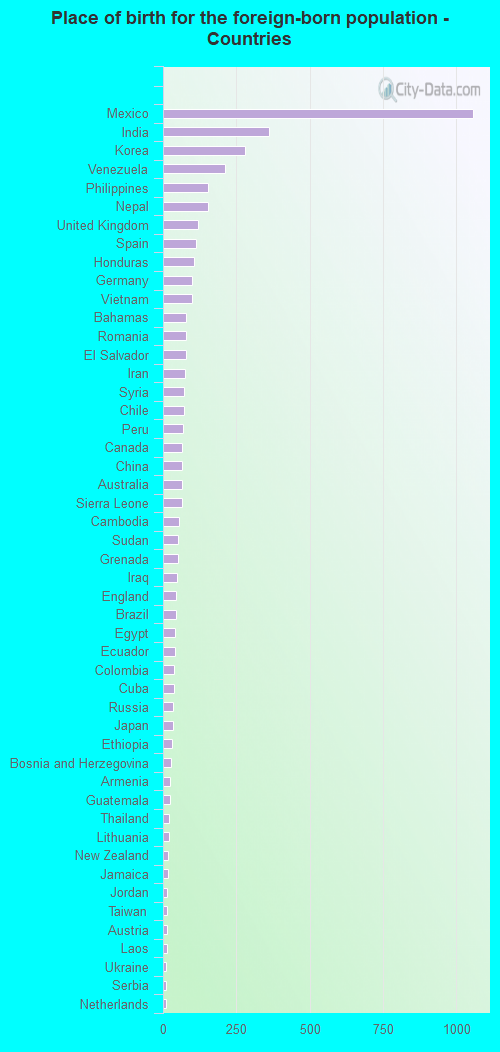
According to 2022 data, the most numerous races in Rockwall, TX are Hispanic (9,987 residents), White alone (34,612 residents), and Black alone (4,103 residents). 84.6% of Rockwall residents speak English at home. 8.2% of Rockwall, TX residents are foreign-born (3.9% born in Latin America, 3.0% born in Asia, 1.2% born in Europe), which is 107.1% less than the foreign-born rate of 17.0% across the entire state of Texas.
Race distribution in Rockwall
2000 2022
10,933,313 52.4% White alone 6,669,666 32.0% Hispanic 2,364,255 11.3% Black alone 554,445 2.7% Asian alone 230,567 1.1% Two or more races 68,859 0.3% American Indian alone 19,958 0.10% Other race alone 10,757 0.05% Native Hawaiian and Other
12,070,642 40.2% Hispanic 11,683,430 38.9% White alone 3,508,706 11.7% Black alone 1,608,173 5.4% Asian alone 956,560 3.2% Two or more races 125,763 0.4% Other race alone 47,023 0.2% American Indian alone 29,275 0.10% Native Hawaiian and Other
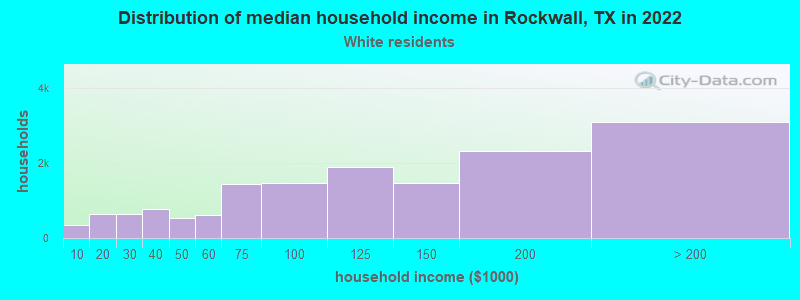
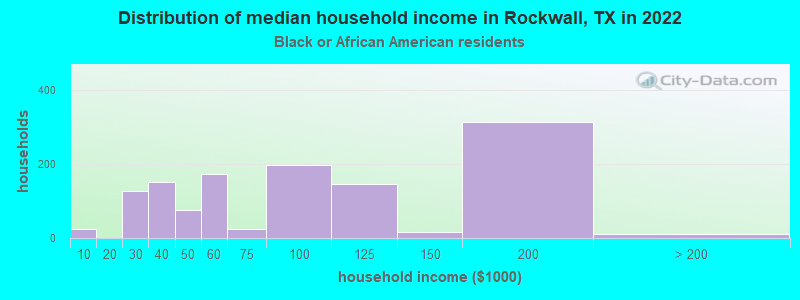
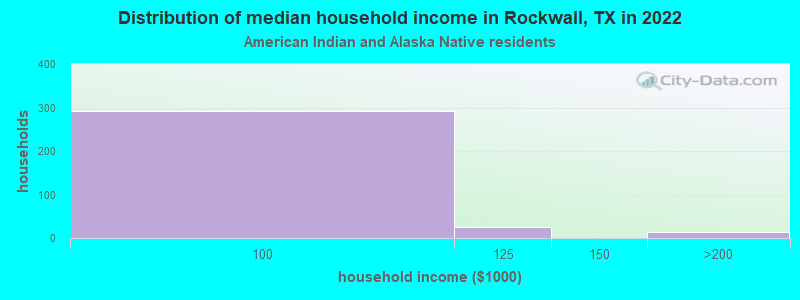
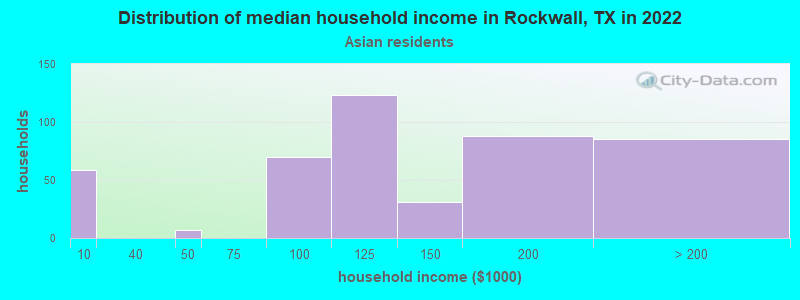
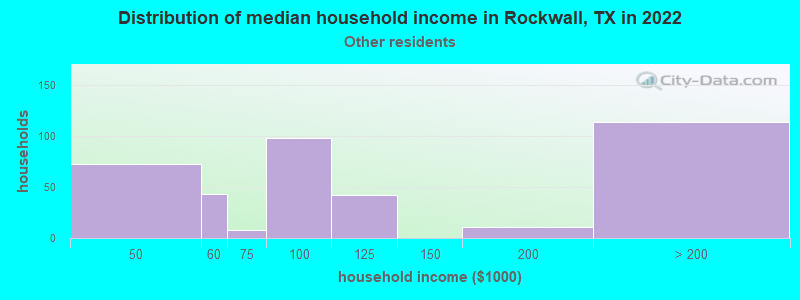
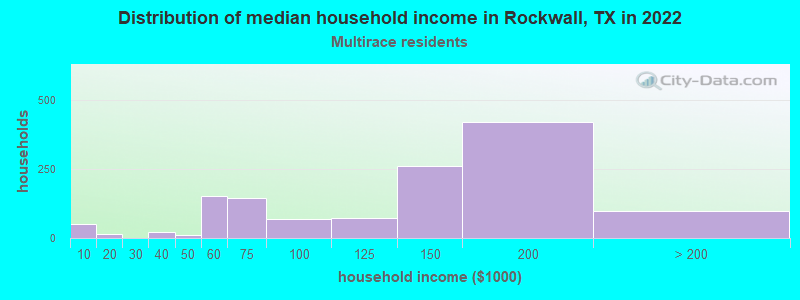
Income and house value in Rockwall Median household income in 2022 $116,807 White non-Hispanic householders$101,742 Black householders$74,300 American Indian and Alaska Native householders$129,314 Asian householders$85,912 Some other race householders$132,692 Two or more races householders$88,277 Hispanic or Latino race householdersMedian 2022 house value $418,774 White Non-Hispanic householders$206,042 Black or African American householders$489,685 American Indian or Alaska Native householders $444,998 Asian householders$358,567 Some other race householders$356,694 Two or more races householders$383,453 Hispanic or Latino householders
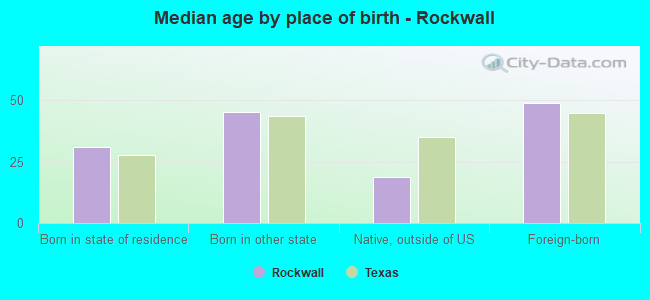
Median age by race in Rockwall
40.2 Median age for White residents39.9 40.4 39.5 Median age for Black or African American residents29.3 53.0 28.1 Median age for American Indian / Alaska Native residents28.2 23.4 38.7 Median age for Asian residents35.2 39.0 -581,560,283.1 Median age for Native Hawaiian / Pacific Islander residents-612,729,233.5 -577,777,777.2 40.5 Median age for Other race residents39.9 49.8 37.1 Median age for Two or more races residents38.2 39.5 42.3 Median age for White alone residents41.2 43.1 30.8 Median age for Hispanic or Latino residents29.1 31.3
Owner/renter occupied households by race in Rockwall
House owners and renters - White residents 11,926 77.8% Owner occupied3,402 22.2% Renter occupiedHouse owners and renters - Black or African American residents 655 51.1% Owner occupied627 48.9% Renter occupiedHouse owners and renters - American Indian / Alaska Native residents 107 30.4% Owner occupied244 69.6% Renter occupiedHouse owners and renters - Asian residents 304 65.7% Owner occupied159 34.3% Renter occupiedHouse owners and renters - Native Hawaiian / Pacific Islander residents 25 100.0% Owner occupiedHouse owners and renters - Other race residents 314 86.8% Owner occupied48 13.2% Renter occupiedHouse owners and renters - Two or more races residents 781 69.7% Owner occupied339 30.3% Renter occupiedHouse owners and renters - White alone residents 11,068 76.0% Owner occupied3,496 24.0% Renter occupiedHouse owners and renters - Hispanic or Latino residents 1,538 80.3% Owner occupied377 19.7% Renter occupied
Language usage in Rockwall
English speakers - Total 84.6% of residents of Rockwall speak English at home.
9.5% of residents speak Spanish at home 3,769 78.1% Speak English very well1,056 21.9% Speak English less than very well6.0% of residents speak other language at home 2,291 75.1% Speak English very well759 24.9% Speak English less than very well
English speakers - Born in the United States 91.5% of residents of Rockwall speak English at home.
6.5% of residents speak Spanish at home 1,072 94.3% Speak English very well65 5.7% Speak English less than very well1.9% of residents speak other language at home 337 100.0% Speak English very well
English speakers - Native, born elsewhere 50.6% of residents of Rockwall speak English at home.
45.4% of residents speak Spanish at home 428 100.0% Speak English very well2.0% of residents speak other language at home 19 100.0% Speak English very well
English speakers - Foreign-born 22.8% of residents of Rockwall speak English at home.
31.9% of residents speak Spanish at home 956 61.4% Speak English very well600 38.6% Speak English less than very well48.3% of residents speak other language at home 1,733 73.6% Speak English very well621 26.4% Speak English less than very well
White (Caucasian) - Speak only English Native:
93.9% (32,548)Foreign-born:
37.6% (498)
White (Caucasian) - Speak another language Native:
6.0% (2,091)Foreign-born:
61.6% (816)
Black or African American - Speak only English Native:
100.0% (2,965)Foreign-born:
47.4% (146)
American Indian / Alaska Native - Speak only English Native:
80.8% (704)Foreign-born:
71.4% (60)
American Indian / Alaska Native - Speak another language Native:
9.1% (79)Foreign-born:
38.7% (32)
Asian - Speak only English Native:
51.7% (407)Foreign-born:
14.4% (175)
Asian - Speak another language Native:
48.7% (383)Foreign-born:
86.0% (1,044)
Other race - Speak only English Native:
46.4% (651)Foreign-born:
4.8% (17)
Other race - Speak another language Native:
54.3% (762)Foreign-born:
95.1% (336)
Two or more races - Speak only English Native:
77.2% (3,104)Foreign-born:
26.5% (238)
Two or more races - Speak another language Native:
22.6% (908)Foreign-born:
71.0% (638)
White alone - Speak only English Native:
98.7% (31,677)Foreign-born:
49.3% (521)
White alone - Speak another language Native:
1.0% (320)Foreign-born:
50.8% (537)
Hispanic or Latino - Speak only English Native:
57.2% (4,166)Foreign-born:
15.8% (280)
Hispanic or Latino - Speak another language Native:
42.8% (3,116)Foreign-born:
85.4% (1,516)
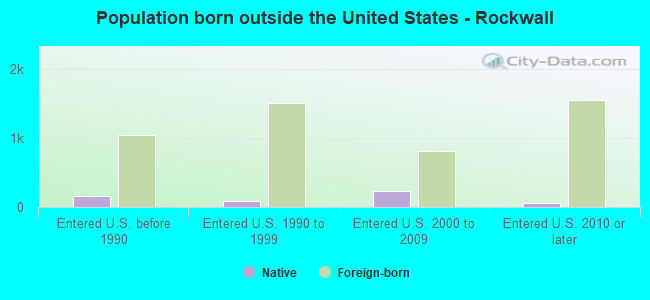
Foreign-born residents in Rockwall 4,376 residents are foreign born (3.9% Latin America , 3.0% Asia , 1.2% Europe ).
This city:
8.2%Texas:
17.1%
Marital status for residents in Rockwall Marital status - White (Caucasian) population 15 years and over
Males 25.8% Never married66.6% Now married0.2% Separated1.5% Widowed5.9% DivorcedFemales 21.5% Never married60.1% Now married0.8% Separated7.1% Widowed10.6% DivorcedWomen who gave birth in the past 12 months Now married:
91.6% (231)Unmarried:
8.4% (21)
Women who did not give birth in the past 12 months Now married:
56.8% (4,901)Unmarried:
43.2% (3,735)
Marital status - Black or African American population 15 years and over
Males 20.4% Never married70.9% Now married0.6% Separated1.6% Widowed6.5% DivorcedFemales 54.7% Never married33.2% Now married1.9% Separated2.5% Widowed7.7% DivorcedWomen who gave birth in the past 12 months Now married:
0.0% (0)Unmarried:
100.0% (207)
Women who did not give birth in the past 12 months Now married:
50.5% (722)Unmarried:
49.5% (706)
Marital status - American Indian / Alaska Native population 15 years and over
Males 29.9% Never married68.5% Now married0.0% Separated1.5% Widowed0.0% DivorcedFemales 19.8% Never married78.2% Now married0.0% Separated0.0% Widowed2.0% DivorcedWomen who gave birth in the past 12 months Now married:
100.0% (257)Unmarried:
0.0% (0)
Women who did not give birth in the past 12 months Now married:
26.5% (26)Unmarried:
73.5% (72)
Marital status - Asian population 15 years and over
Males 34.7% Never married52.4% Now married8.3% Separated0.0% Widowed4.6% DivorcedFemales 28.0% Never married64.5% Now married0.0% Separated7.4% Widowed0.0% DivorcedWomen who gave birth in the past 12 months Now married:
87.8% (85)Unmarried:
12.2% (12)
Women who did not give birth in the past 12 months Now married:
63.7% (315)Unmarried:
36.3% (180)
Marital status - Other race population 15 years and over
Males 45.3% Never married51.0% Now married0.0% Separated2.3% Widowed1.3% DivorcedFemales 25.1% Never married62.7% Now married3.8% Separated2.5% Widowed5.9% DivorcedWomen who did not give birth in the past 12 months Now married:
64.9% (293)Unmarried:
35.1% (158)
Marital status - Two or more races population 15 years and over
Males 36.5% Never married48.9% Now married1.6% Separated0.0% Widowed13.1% DivorcedFemales 19.1% Never married72.2% Now married1.9% Separated1.2% Widowed5.6% DivorcedWomen who gave birth in the past 12 months Now married:
100.0% (101)Unmarried:
0.0% (0)
Women who did not give birth in the past 12 months Now married:
62.9% (581)Unmarried:
37.1% (342)
Marital status - White alone, not Hispanic / Latino population 15 years and over
Males 25.0% Never married67.0% Now married0.2% Separated1.6% Widowed6.2% DivorcedFemales 20.1% Never married60.5% Now married0.5% Separated7.7% Widowed11.3% DivorcedWomen who gave birth in the past 12 months Now married:
88.6% (173)Unmarried:
11.4% (22)
Women who did not give birth in the past 12 months Now married:
56.9% (4,416)Unmarried:
43.1% (3,342)
Marital status - Hispanic or Latino population 15 years and over
Males 35.8% Never married56.5% Now married0.0% Separated0.6% Widowed7.1% DivorcedFemales 29.6% Never married63.0% Now married2.2% Separated1.0% Widowed4.1% DivorcedWomen who gave birth in the past 12 months Now married:
100.0% (364)Unmarried:
0.0% (0)
Women who did not give birth in the past 12 months Now married:
57.2% (1,454)Unmarried:
42.8% (1,087)
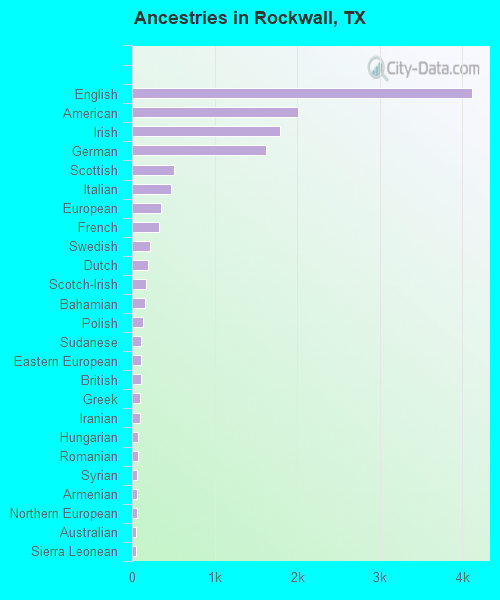
Ancestries in Rockwall
4,121 17.9% English2,013 8.7% American1,799 7.8% Irish1,630 7.1% German508 2.2% Scottish476 2.1% Italian346 1.5% European327 1.4% French223 1.0% Swedish189 0.8% Dutch169 0.7% Scotch-Irish154 0.7% Bahamian130 0.6% Polish114 0.5% Sudanese111 0.5% Eastern European108 0.5% British98 0.4% Greek91 0.4% Iranian78 0.3% Hungarian70 0.3% Romanian63 0.3% Syrian60 0.3% Armenian57 0.2% Northern European53 0.2% Australian49 0.2% Sierra Leonean45 0.2% Norwegian36 0.2% Iraqi34 0.1% Welsh30 0.1% Lithuanian22 0.10% Serbian21 0.09% Canadian20 0.09% Russian20 0.09% Ukrainian19 0.08% Czech19 0.08% Portuguese19 0.08% Albanian19 0.08% Scandinavian17 0.07% French Canadian14 0.06% Latvian12 0.05% Austrian12 0.05% African11 0.05% Lebanese11 0.05% Arab8 0.03% Croatian
Geographical mobility in Rockwall Same house 1 year ago 32,306 85.7% White (Caucasian)2,759 83.2% Black or African American428 42.6% American Indian / Alaska Native1,805 96.6% Asian20 98.2% Native Hawaiian / Pacific Islander1,598 89.8% Other race4,978 87.2% Two or more races29,740 86.6% White alone, not Hispanic / Latino6,143 73.6% Hispanic or LatinoMoved within same county 1,733 4.6% White / Caucasian99 3.0% Black or African American24 2.4% American Indian / Alaska Native27 1.4% Asian170 9.6% Other race390 6.8% Two or more races795 2.3% White alone, not Hispanic / Latino872 10.5% Hispanic or LatinoMoved within same state 2,094 5.6% White / Caucasian186 5.6% Black or African American488 48.5% American Indian / Alaska Native22 1.2% Asian301 5.3% Two or more races1,950 5.7% White alone, not Hispanic / Latino1,042 12.5% Hispanic or LatinoMoved from different state 2,156 5.7% White / Caucasian353 10.7% Black or African American15 0.3% Two or more races1,727 5.0% White alone, not Hispanic / Latino229 2.7% Hispanic or LatinoMoved from abroad 108 0.3% White49 0.1% White alone, not Hispanic / Latino63 0.8% Hispanic or Latino
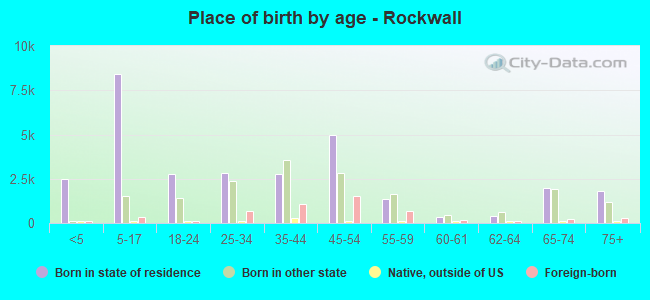
Children Nativity (place of birth) in Rockwall
Children under 6 years - Living with two parents Both parents native 1,667 100.0% NativeBoth parents foreign-born 103 100.0% NativeOne native, one foreign-born parent 571 100.0% NativeChildren under 6 years - Living with one parent Native parent 736 100.0% NativeForeign-born parent 68 100.0% NativeChildren 6 to 17 years - Living with two parents Both parents native 5,098 99.1% Native44 0.9% Foreign-bornBoth parents foreign-born 574 76.1% Native180 23.9% Foreign-bornOne native, one foreign-born parent 711 97.4% Native19 2.6% Foreign-bornChildren 6 to 17 years - Living with one parent Native parent 1,204 100.0% NativeForeign-born parent 365 57.5% Native271 42.5% Foreign-born
Grandparents responsible for own grandchildren in Rockwall
Grandparents (30 to 59 years) White / Caucasian 256 59.4% Responsible for grandchildren175 40.6% Not responsible for grandchildrenBlack or African American 98 25.4% Responsible for grandchildren288 74.6% Not responsible for grandchildrenAsian 5 100.0% Not responsible for grandchildrenWhite alone, not Hispanic / Latino 335 100.0% Responsible for grandchildrenHispanic or Latino 268 100.0% Not responsible for grandchildrenGrandparents (60 years and over) White / Caucasian 90 52.9% Responsible for grandchildren80 47.1% Not responsible for grandchildrenBlack or African American 4 6.0% Responsible for grandchildren57 94.0% Not responsible for grandchildrenAsian 22 29.2% Responsible for grandchildren54 70.8% Not responsible for grandchildrenWhite alone, not Hispanic / Latino 107 49.3% Responsible for grandchildren110 50.7% Not responsible for grandchildrenHispanic or Latino 27 100.0% Not responsible for grandchildren