Races in Round Rock, Texas (TX) Detailed Stats
Data:
Races - White alone (%)
Races - White alone (% change since 2000)
Races - Black alone (%)
Races - Black alone (% change since 2000)
Races - American Indian alone (%)
Races - American Indian alone (% change since 2000)
Races - Asian alone (%)
Races - Asian alone (% change since 2000)
Races - Hispanic (%)
Races - Hispanic (% change since 2000)
Races - Native Hawaiian and Other Pacific Islander alone (%)
Races - Native Hawaiian and Other Pacific Islander alone (% change since 2000)
Races - Two or more races(%)
Races - Two or more races(% change since 2000)
Races - Other race alone (%)
Races - Other race alone (% change since 2000)
Racial diversity
Place of birth - Born in state of residence (%)
Place of birth - Born in state of residence (%) - White
Place of birth - Born in state of residence (%) - Black or African American
Place of birth - Born in state of residence (%) - Asian
Place of birth - Born in state of residence (%) - Hispanic or Latino
Place of birth - Born in state of residence (%) - American Indian and Alaska Native
Place of birth - Born in state of residence (%) - Multirace
Place of birth - Born in state of residence (%) - Other Race
Place of birth - Born in other state (%)
Place of birth - Born in other state (%) - White
Place of birth - Born in other state (%) - Black or African American
Place of birth - Born in other state (%) - Asian
Place of birth - Born in other state (%) - Hispanic or Latino
Place of birth - Born in other state (%) - American Indian and Alaska Native
Place of birth - Born in other state (%) - Multirace
Place of birth - Born in other state (%) - Other Race
Place of birth - Native, outside of US (%)
Place of birth - Native, outside of US (%) - White
Place of birth - Native, outside of US (%) - Black or African American
Place of birth - Native, outside of US (%) - Asian
Place of birth - Native, outside of US (%) - Hispanic or Latino
Place of birth - Native, outside of US (%) - American Indian and Alaska Native
Place of birth - Native, outside of US (%) - Multirace
Place of birth - Native, outside of US (%) - Other Race
Place of birth - Foreign born (%)
Place of birth - Foreign born (%) - White
Place of birth - Foreign born (%) - Black or African American
Place of birth - Foreign born (%) - Asian
Place of birth - Foreign born (%) - Hispanic or Latino
Place of birth - Foreign born (%) - American Indian and Alaska Native
Place of birth - Foreign born (%) - Multirace
Place of birth - Foreign born (%) - Other Race
Residents speaking English at home (%)
Residents speaking English at home - Born in the United States (%)
Residents speaking English at home - Native, born elsewhere (%)
Residents speaking English at home - Foreign born (%)
Residents speaking Spanish at home (%)
Residents speaking Spanish at home - Born in the United States (%)
Residents speaking Spanish at home - Native, born elsewhere (%)
Residents speaking Spanish at home - Foreign born (%)
Residents speaking other language at home (%)
Residents speaking other language at home - Born in the United States (%)
Residents speaking other language at home - Native, born elsewhere (%)
Residents speaking other language at home - Foreign born (%)
Marital status - Never married (%)
Marital status - Now married (%)
Marital status - Separated (%)
Marital status - Widowed (%)
Marital status - Divorced (%)
Ancestries Reported - Arab (%)
Ancestries Reported - Czech (%)
Ancestries Reported - Danish (%)
Ancestries Reported - Dutch (%)
Ancestries Reported - English (%)
Ancestries Reported - French (%)
Ancestries Reported - French Canadian (%)
Ancestries Reported - German (%)
Ancestries Reported - Greek (%)
Ancestries Reported - Hungarian (%)
Ancestries Reported - Irish (%)
Ancestries Reported - Italian (%)
Ancestries Reported - Lithuanian (%)
Ancestries Reported - Norwegian (%)
Ancestries Reported - Polish (%)
Ancestries Reported - Portuguese (%)
Ancestries Reported - Russian (%)
Ancestries Reported - Scotch-Irish (%)
Ancestries Reported - Scottish (%)
Ancestries Reported - Slovak (%)
Ancestries Reported - Subsaharan African (%)
Ancestries Reported - Swedish (%)
Ancestries Reported - Swiss (%)
Ancestries Reported - Ukrainian (%)
Ancestries Reported - United States (%)
Ancestries Reported - Welsh (%)
Ancestries Reported - West Indian (%)
Ancestries Reported - Other (%)
Geographical mobility - Same house 1 year ago (%)
Geographical mobility - Same house 1 year ago (%) - White
Geographical mobility - Same house 1 year ago (%) - Black or African American
Geographical mobility - Same house 1 year ago (%) - Asian
Geographical mobility - Same house 1 year ago (%) - Hispanic or Latino
Geographical mobility - Same house 1 year ago (%) - American Indian and Alaska Native
Geographical mobility - Same house 1 year ago (%) - Multirace
Geographical mobility - Same house 1 year ago (%) - Other Race
Geographical mobility - Moved within same county (%)
Geographical mobility - Moved within same county (%) - White
Geographical mobility - Moved within same county (%) - Black or African American
Geographical mobility - Moved within same county (%) - Asian
Geographical mobility - Moved within same county (%) - Hispanic or Latino
Geographical mobility - Moved within same county (%) - American Indian and Alaska Native
Geographical mobility - Moved within same county (%) - Multirace
Geographical mobility - Moved within same county (%) - Other Race
Geographical mobility - Moved from different county within same state (%)
Geographical mobility - Moved from different county within same state (%) - White
Geographical mobility - Moved from different county within same state (%) - Black or African American
Geographical mobility - Moved from different county within same state (%) - Asian
Geographical mobility - Moved from different county within same state (%) - Hispanic or Latino
Geographical mobility - Moved from different county within same state (%) - American Indian and Alaska Native
Geographical mobility - Moved from different county within same state (%) - Multirace
Geographical mobility - Moved from different county within same state (%) - Other Race
Geographical mobility - Moved from different state (%)
Geographical mobility - Moved from different state (%) - White
Geographical mobility - Moved from different state (%) - Black or African American
Geographical mobility - Moved from different state (%) - Asian
Geographical mobility - Moved from different state (%) - Hispanic or Latino
Geographical mobility - Moved from different state (%) - American Indian and Alaska Native
Geographical mobility - Moved from different state (%) - Multirace
Geographical mobility - Moved from different state (%) - Other Race
Geographical mobility - Moved from abroad (%)
Geographical mobility - Moved from abroad (%) - White
Geographical mobility - Moved from abroad (%) - Black or African American
Geographical mobility - Moved from abroad (%) - Asian
Geographical mobility - Moved from abroad (%) - Hispanic or Latino
Geographical mobility - Moved from abroad (%) - American Indian and Alaska Native
Geographical mobility - Moved from abroad (%) - Multirace
Geographical mobility - Moved from abroad (%) - Other Race
Place of birth for the foreign-born population - Ireland (%)
Place of birth for the foreign-born population - Denmark (%)
Place of birth for the foreign-born population - Norway (%)
Place of birth for the foreign-born population - Sweden (%)
Place of birth for the foreign-born population - United Kingdom (%)
Place of birth for the foreign-born population - England (%)
Place of birth for the foreign-born population - Scotland (%)
Place of birth for the foreign-born population - Other Northern Europe (%)
Place of birth for the foreign-born population - Austria (%)
Place of birth for the foreign-born population - Belgium (%)
Place of birth for the foreign-born population - France (%)
Place of birth for the foreign-born population - Germany (%)
Place of birth for the foreign-born population - Netherlands (%)
Place of birth for the foreign-born population - Switzerland (%)
Place of birth for the foreign-born population - Other Western Europe (%)
Place of birth for the foreign-born population - Greece (%)
Place of birth for the foreign-born population - Italy (%)
Place of birth for the foreign-born population - Portugal (%)
Place of birth for the foreign-born population - Spain (%)
Place of birth for the foreign-born population - Other Southern Europe (%)
Place of birth for the foreign-born population - Albania (%)
Place of birth for the foreign-born population - Belarus (%)
Place of birth for the foreign-born population - Bosnia and Herzegovina (%)
Place of birth for the foreign-born population - Bulgaria (%)
Place of birth for the foreign-born population - Croatia (%)
Place of birth for the foreign-born population - Czechoslovakia (%)
Place of birth for the foreign-born population - Hungary (%)
Place of birth for the foreign-born population - Latvia (%)
Place of birth for the foreign-born population - Lithuania (%)
Place of birth for the foreign-born population - North Macedonia (Macedonia) (%)
Place of birth for the foreign-born population - Moldova (%)
Place of birth for the foreign-born population - Poland (%)
Place of birth for the foreign-born population - Romania (%)
Place of birth for the foreign-born population - Russia (%)
Place of birth for the foreign-born population - Serbia (%)
Place of birth for the foreign-born population - Ukraine (%)
Place of birth for the foreign-born population - Other Eastern Europe (%)
Place of birth for the foreign-born population - China (%)
Place of birth for the foreign-born population - Hong Kong (%)
Place of birth for the foreign-born population - Taiwan (%)
Place of birth for the foreign-born population - Japan (%)
Place of birth for the foreign-born population - Korea (%)
Place of birth for the foreign-born population - Other Eastern Asia (%)
Place of birth for the foreign-born population - Afghanistan (%)
Place of birth for the foreign-born population - Bangladesh (%)
Place of birth for the foreign-born population - India (%)
Place of birth for the foreign-born population - Iran (%)
Place of birth for the foreign-born population - Kazakhstan (%)
Place of birth for the foreign-born population - Nepal (%)
Place of birth for the foreign-born population - Pakistan (%)
Place of birth for the foreign-born population - Sri Lanka (%)
Place of birth for the foreign-born population - Uzbekistan (%)
Place of birth for the foreign-born population - Other South Central Asia (%)
Place of birth for the foreign-born population - Burma (%)
Place of birth for the foreign-born population - Cambodia (%)
Place of birth for the foreign-born population - Indonesia (%)
Place of birth for the foreign-born population - Laos (%)
Place of birth for the foreign-born population - Malaysia (%)
Place of birth for the foreign-born population - Philippines (%)
Place of birth for the foreign-born population - Singapore (%)
Place of birth for the foreign-born population - Thailand (%)
Place of birth for the foreign-born population - Vietnam (%)
Place of birth for the foreign-born population - Other South Eastern Asia (%)
Place of birth for the foreign-born population - Armenia (%)
Place of birth for the foreign-born population - Iraq (%)
Place of birth for the foreign-born population - Israel (%)
Place of birth for the foreign-born population - Jordan (%)
Place of birth for the foreign-born population - Kuwait (%)
Place of birth for the foreign-born population - Lebanon (%)
Place of birth for the foreign-born population - Saudi Arabia (%)
Place of birth for the foreign-born population - Syria (%)
Place of birth for the foreign-born population - Turkey (%)
Place of birth for the foreign-born population - Yemen (%)
Place of birth for the foreign-born population - Other Western Asia (%)
Place of birth for the foreign-born population - Eritrea (%)
Place of birth for the foreign-born population - Ethiopia (%)
Place of birth for the foreign-born population - Kenya (%)
Place of birth for the foreign-born population - Somalia (%)
Place of birth for the foreign-born population - Uganda (%)
Place of birth for the foreign-born population - Zimbabwe (%)
Place of birth for the foreign-born population - Other Eastern Africa (%)
Place of birth for the foreign-born population - Cameroon (%)
Place of birth for the foreign-born population - Congo (%)
Place of birth for the foreign-born population - Democratic Republic of Congo (Zaire) (%)
Place of birth for the foreign-born population - Other Middle Africa (%)
Place of birth for the foreign-born population - Egypt (%)
Place of birth for the foreign-born population - Morocco (%)
Place of birth for the foreign-born population - Sudan (%)
Place of birth for the foreign-born population - Other Northern Africa (%)
Place of birth for the foreign-born population - South Africa (%)
Place of birth for the foreign-born population - Other Southern Africa (%)
Place of birth for the foreign-born population - Cabo Verde (%)
Place of birth for the foreign-born population - Ghana (%)
Place of birth for the foreign-born population - Liberia (%)
Place of birth for the foreign-born population - Nigeria (%)
Place of birth for the foreign-born population - Senegal (%)
Place of birth for the foreign-born population - Sierra Leone (%)
Place of birth for the foreign-born population - Other Western Africa (%)
Place of birth for the foreign-born population - Australia (%)
Place of birth for the foreign-born population - New Zealand (%)
Place of birth for the foreign-born population - Fiji (%)
Place of birth for the foreign-born population - Micronesia (%)
Place of birth for the foreign-born population - Bahamas (%)
Place of birth for the foreign-born population - Barbados (%)
Place of birth for the foreign-born population - Cuba (%)
Place of birth for the foreign-born population - Dominica (%)
Place of birth for the foreign-born population - Dominican Republic (%)
Place of birth for the foreign-born population - Grenada (%)
Place of birth for the foreign-born population - Haiti (%)
Place of birth for the foreign-born population - Jamaica (%)
Place of birth for the foreign-born population - St. Vincent and the Grenadines (%)
Place of birth for the foreign-born population - Trinidad and Tobago (%)
Place of birth for the foreign-born population - West Indies (%)
Place of birth for the foreign-born population - Other Caribbean (%)
Place of birth for the foreign-born population - Belize (%)
Place of birth for the foreign-born population - Costa Rica (%)
Place of birth for the foreign-born population - El Salvador (%)
Place of birth for the foreign-born population - Guatemala (%)
Place of birth for the foreign-born population - Honduras (%)
Place of birth for the foreign-born population - Mexico (%)
Place of birth for the foreign-born population - Nicaragua (%)
Place of birth for the foreign-born population - Panama (%)
Place of birth for the foreign-born population - Other Central America (%)
Place of birth for the foreign-born population - Argentina (%)
Place of birth for the foreign-born population - Bolivia (%)
Place of birth for the foreign-born population - Brazil (%)
Place of birth for the foreign-born population - Chile (%)
Place of birth for the foreign-born population - Colombia (%)
Place of birth for the foreign-born population - Ecuador (%)
Place of birth for the foreign-born population - Guyana (%)
Place of birth for the foreign-born population - Peru (%)
Place of birth for the foreign-born population - Uruguay (%)
Place of birth for the foreign-born population - Venezuela (%)
Place of birth for the foreign-born population - Other South America (%)
Place of birth for the foreign-born population - Canada (%)
Place of birth for the foreign-born population - Other Northern America (%)
Place of birth for the foreign-born population - Other (%)
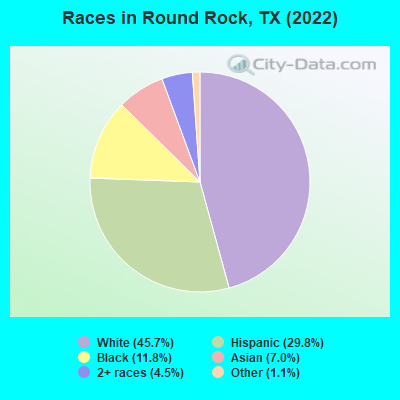
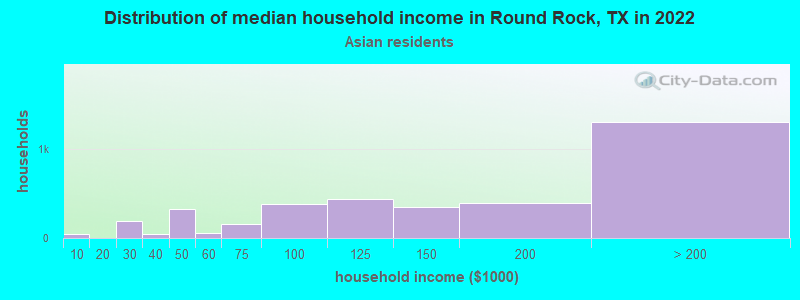
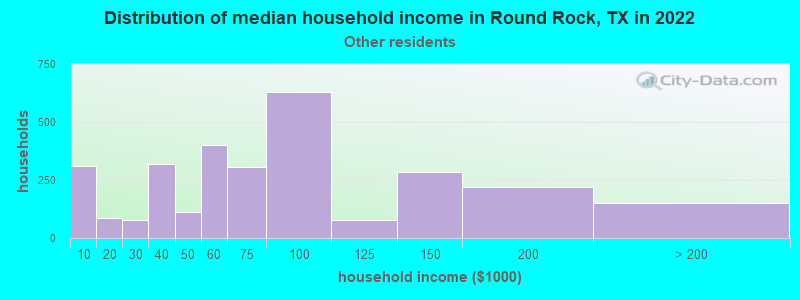
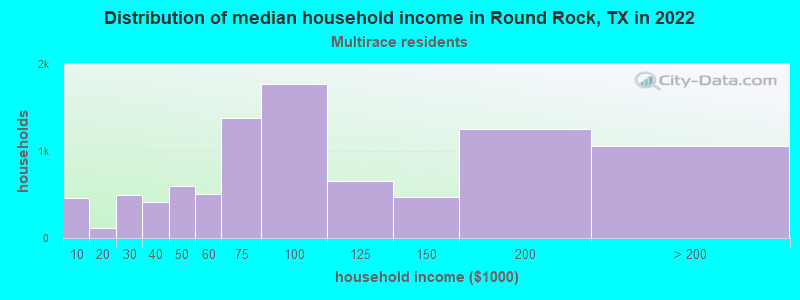
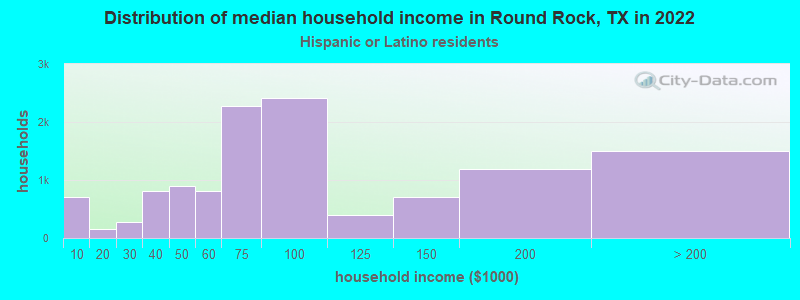
According to 2022 data, the most numerous races in Round Rock, TX are Hispanic (37,140 residents), White alone (57,085 residents), and Black alone (14,739 residents). 69.4% of Round Rock residents speak English at home. 14.2% of Round Rock, TX residents are foreign-born (6.6% born in Latin America, 5.6% born in Asia), which is 19.5% less than the foreign-born rate of 17.0% across the entire state of Texas.
Race distribution in Round Rock
2000 2022
40,113 65.6% White alone 13,511 22.1% Hispanic 4,560 7.5% Black alone 1,727 2.8% Asian alone 891 1.5% Two or more races 210 0.3% American Indian alone 69 0.1% Other race alone 55 0.09% Native Hawaiian and Other
57,085 45.7% White alone 37,140 29.8% Hispanic 14,739 11.8% Black alone 8,737 7.0% Asian alone 5,645 4.5% Two or more races 1,414 1.1% Other race alone 30 0.02% American Indian alone
2000 2022
10,933,313 52.4% White alone 6,669,666 32.0% Hispanic 2,364,255 11.3% Black alone 554,445 2.7% Asian alone 230,567 1.1% Two or more races 68,859 0.3% American Indian alone 19,958 0.10% Other race alone 10,757 0.05% Native Hawaiian and Other
12,070,642 40.2% Hispanic 11,683,430 38.9% White alone 3,508,706 11.7% Black alone 1,608,173 5.4% Asian alone 956,560 3.2% Two or more races 125,763 0.4% Other race alone 47,023 0.2% American Indian alone 29,275 0.10% Native Hawaiian and Other
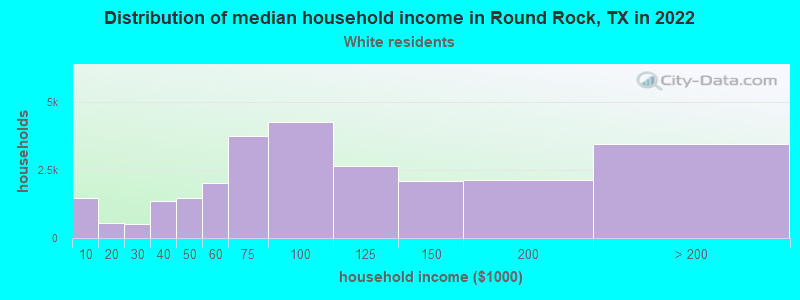
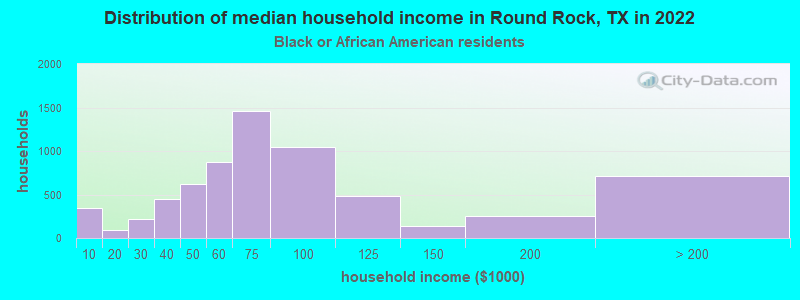
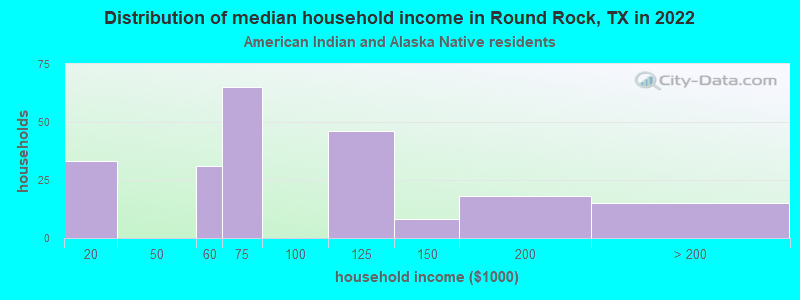
Income and house value in Round Rock Median household income in 2022 $80,924 White non-Hispanic householders$73,835 Black householders$113,045 American Indian and Alaska Native householders$156,922 Asian householders$67,627 Some other race householders$87,561 Two or more races householders$80,097 Hispanic or Latino race householdersMedian 2022 house value $460,804 White Non-Hispanic householders$432,469 Black or African American householders$304,592 American Indian or Alaska Native householders $496,594 Asian householders$205,050 Native Hawaiian and other Pacific Islander householders$351,195 Some other race householders$455,957 Two or more races householders$373,937 Hispanic or Latino householders
Median age by race in Round Rock
38.5 Median age for White residents38.6 38.4 30.0 Median age for Black or African American residents25.9 39.4 33.8 Median age for American Indian / Alaska Native residents68.3 32.5 34.6 Median age for Asian residents34.1 35.3 -666,666,666.0 Median age for Native Hawaiian / Pacific Islander residents-666,666,666.0 -666,666,666.0 37.4 Median age for Other race residents40.8 29.1 26.8 Median age for Two or more races residents23.4 36.8 39.0 Median age for White alone residents39.0 39.1 29.9 Median age for Hispanic or Latino residents26.6 36.7
Owner/renter occupied households by race in Round Rock
House owners and renters - White residents 15,287 59.7% Owner occupied10,324 40.3% Renter occupiedHouse owners and renters - Black or African American residents 1,229 22.2% Owner occupied4,310 77.8% Renter occupiedHouse owners and renters - American Indian / Alaska Native residents 100 45.2% Owner occupied121 54.8% Renter occupiedHouse owners and renters - Asian residents 1,916 73.8% Owner occupied679 26.2% Renter occupiedHouse owners and renters - Native Hawaiian / Pacific Islander residents 52 29.5% Owner occupied125 70.5% Renter occupiedHouse owners and renters - Other race residents 1,567 55.6% Owner occupied1,252 44.4% Renter occupiedHouse owners and renters - Two or more races residents 4,815 52.5% Owner occupied4,352 47.5% Renter occupiedHouse owners and renters - White alone residents 14,267 62.0% Owner occupied8,739 38.0% Renter occupiedHouse owners and renters - Hispanic or Latino residents 5,733 47.2% Owner occupied6,411 52.8% Renter occupied
Language usage in Round Rock
English speakers - Total 69.4% of residents of Round Rock speak English at home.
19.7% of residents speak Spanish at home 17,563 75.2% Speak English very well5,787 24.8% Speak English less than very well10.8% of residents speak other language at home 8,525 66.5% Speak English very well4,301 33.5% Speak English less than very well
English speakers - Born in the United States 87.7% of residents of Round Rock speak English at home.
9.2% of residents speak Spanish at home 2,806 81.2% Speak English very well648 18.8% Speak English less than very well3.0% of residents speak other language at home 838 73.4% Speak English very well303 26.6% Speak English less than very well
English speakers - Native, born elsewhere 59.5% of residents of Round Rock speak English at home.
27.0% of residents speak Spanish at home 611 91.7% Speak English very well55 8.3% Speak English less than very well13.4% of residents speak other language at home 331 100.0% Speak English very well
English speakers - Foreign-born 12.2% of residents of Round Rock speak English at home.
36.1% of residents speak Spanish at home 2,967 43.2% Speak English very well3,900 56.8% Speak English less than very well51.7% of residents speak other language at home 5,942 60.4% Speak English very well3,893 39.6% Speak English less than very well
White (Caucasian) - Speak only English Native:
89.2% (51,788)Foreign-born:
18.5% (792)
White (Caucasian) - Speak another language Native:
10.8% (6,274)Foreign-born:
81.5% (3,486)
Black or African American - Speak only English Native:
94.6% (10,893)Foreign-born:
26.7% (664)
Black or African American - Speak another language Native:
5.1% (590)Foreign-born:
72.5% (1,802)
American Indian / Alaska Native - Speak another language Native:
83.8% (294)Foreign-born:
98.9% (357)
Asian - Speak only English Native:
57.1% (1,632)Foreign-born:
9.5% (512)
Asian - Speak another language Native:
42.9% (1,224)Foreign-born:
90.5% (4,878)
Other race - Speak only English Native:
35.7% (1,916)Foreign-born:
7.1% (117)
Other race - Speak another language Native:
64.3% (3,456)Foreign-born:
92.9% (1,527)
Two or more races - Speak only English Native:
64.2% (13,687)Foreign-born:
3.0% (141)
Two or more races - Speak another language Native:
35.8% (7,621)Foreign-born:
97.0% (4,550)
White alone - Speak only English Native:
94.8% (48,816)Foreign-born:
29.8% (792)
White alone - Speak another language Native:
5.2% (2,687)Foreign-born:
70.2% (1,866)
Hispanic or Latino - Speak only English Native:
48.0% (13,351)Foreign-born:
1.9% (143)
Hispanic or Latino - Speak another language Native:
52.0% (14,465)Foreign-born:
98.1% (7,511)
Foreign-born residents in Round Rock 18,641 residents are foreign born (6.6% Latin America , 5.6% Asia ).
This city:
14.2%Texas:
17.1%
Marital status for residents in Round Rock Marital status - White (Caucasian) population 15 years and over
Males 34.9% Never married56.6% Now married0.3% Separated0.8% Widowed7.4% DivorcedFemales 29.9% Never married44.7% Now married4.8% Separated5.3% Widowed15.4% DivorcedWomen who gave birth in the past 12 months Now married:
59.9% (299)Unmarried:
40.1% (200)
Women who did not give birth in the past 12 months Now married:
42.1% (6,799)Unmarried:
57.9% (9,363)
Marital status - Black or African American population 15 years and over
Males 47.8% Never married40.9% Now married1.9% Separated0.0% Widowed9.4% DivorcedFemales 39.2% Never married29.6% Now married1.7% Separated8.0% Widowed21.4% DivorcedWomen who gave birth in the past 12 months Now married:
72.6% (245)Unmarried:
27.4% (92)
Women who did not give birth in the past 12 months Now married:
26.1% (1,255)Unmarried:
73.9% (3,550)
Marital status - American Indian / Alaska Native population 15 years and over
Males 62.7% Never married30.7% Now married0.0% Separated0.0% Widowed6.6% DivorcedFemales 64.0% Never married24.2% Now married0.0% Separated11.8% Widowed0.0% DivorcedWomen who did not give birth in the past 12 months Now married:
15.6% (37)Unmarried:
84.4% (202)
Marital status - Asian population 15 years and over
Males 21.7% Never married75.6% Now married0.0% Separated0.7% Widowed2.0% DivorcedFemales 18.0% Never married72.8% Now married0.0% Separated4.4% Widowed4.9% DivorcedWomen who gave birth in the past 12 months Now married:
100.0% (162)Unmarried:
0.0% (0)
Women who did not give birth in the past 12 months Now married:
78.7% (1,646)Unmarried:
21.3% (446)
Marital status - Other race population 15 years and over
Males 32.7% Never married51.5% Now married2.1% Separated4.0% Widowed9.5% DivorcedFemales 22.4% Never married48.2% Now married0.0% Separated0.0% Widowed29.3% DivorcedWomen who gave birth in the past 12 months Now married:
92.2% (240)Unmarried:
7.8% (20)
Women who did not give birth in the past 12 months Now married:
42.6% (1,101)Unmarried:
57.4% (1,485)
Marital status - Two or more races population 15 years and over
Males 47.0% Never married42.6% Now married6.9% Separated0.3% Widowed3.2% DivorcedFemales 29.3% Never married49.8% Now married5.0% Separated6.3% Widowed9.6% DivorcedWomen who gave birth in the past 12 months Now married:
65.3% (132)Unmarried:
34.7% (70)
Women who did not give birth in the past 12 months Now married:
58.5% (4,176)Unmarried:
41.5% (2,964)
Marital status - White alone, not Hispanic / Latino population 15 years and over
Males 35.0% Never married56.0% Now married0.3% Separated0.9% Widowed7.9% DivorcedFemales 29.5% Never married45.4% Now married3.4% Separated5.9% Widowed15.8% DivorcedWomen who gave birth in the past 12 months Now married:
55.6% (250)Unmarried:
44.4% (200)
Women who did not give birth in the past 12 months Now married:
40.5% (5,344)Unmarried:
59.5% (7,843)
Marital status - Hispanic or Latino population 15 years and over
Males 42.8% Never married47.8% Now married4.2% Separated1.1% Widowed4.1% DivorcedFemales 30.5% Never married48.0% Now married6.7% Separated4.1% Widowed10.8% DivorcedWomen who gave birth in the past 12 months Now married:
100.0% (238)Unmarried:
0.0% (0)
Women who did not give birth in the past 12 months Now married:
55.6% (6,197)Unmarried:
44.4% (4,946)
Ancestries in Round Rock
5,556 8.9% German4,185 6.7% English3,886 6.2% American1,473 2.4% Irish1,134 1.8% Italian1,123 1.8% European571 0.9% Nigerian539 0.9% French466 0.7% Canadian436 0.7% African397 0.6% Scottish375 0.6% Norwegian369 0.6% Palestinian368 0.6% Turkish361 0.6% Ethiopian325 0.5% French Canadian319 0.5% Dutch311 0.5% Scotch-Irish283 0.5% Arab221 0.4% Polish221 0.4% British191 0.3% Portuguese185 0.3% Czech177 0.3% Eastern European167 0.3% Swedish167 0.3% Welsh161 0.3% Brazilian144 0.2% Israeli137 0.2% Russian130 0.2% Cajun123 0.2% Iranian110 0.2% Haitian103 0.2% Danish72 0.1% Romanian72 0.1% Scandinavian71 0.1% Lebanese63 0.1% Northern European63 0.1% Iraqi61 0.10% Kenyan61 0.10% Jamaican56 0.09% Austrian49 0.08% Syrian48 0.08% Slovene46 0.07% Czechoslovakian43 0.07% Ukrainian40 0.06% Albanian38 0.06% Zimbabwean37 0.06% Trinidadian and Tobagonian34 0.05% Hungarian32 0.05% Yugoslavian30 0.05% Swiss28 0.04% Egyptian26 0.04% Afghan21 0.03% Slovak21 0.03% Australian20 0.03% Greek19 0.03% Maltese16 0.03% West Indian15 0.02% Finnish15 0.02% Belgian11 0.02% Lithuanian10 0.02% Barbadian5 0.01% Armenian
Geographical mobility in Round Rock Same house 1 year ago 55,982 86.3% White (Caucasian)8,956 59.5% Black or African American632 91.9% American Indian / Alaska Native6,656 76.2% Asian256 72.4% Native Hawaiian / Pacific Islander7,871 80.3% Other race22,964 82.9% Two or more races48,548 85.8% White alone, not Hispanic / Latino31,176 84.2% Hispanic or LatinoMoved within same county 3,264 5.0% White / Caucasian1,235 8.2% Black or African American35 5.0% American Indian / Alaska Native395 4.5% Asian19 5.4% Native Hawaiian / Pacific Islander483 4.9% Other race1,268 4.6% Two or more races3,129 5.5% White alone, not Hispanic / Latino1,396 3.8% Hispanic or LatinoMoved within same state 3,930 6.1% White / Caucasian956 6.3% Black or African American26 3.7% American Indian / Alaska Native456 5.2% Asian815 8.3% Other race3,335 12.0% Two or more races3,539 6.3% White alone, not Hispanic / Latino4,031 10.9% Hispanic or LatinoMoved from different state 1,229 1.9% White / Caucasian3,554 23.6% Black or African American1,232 14.1% Asian91 25.7% Native Hawaiian / Pacific Islander57 0.6% Other race147 0.5% Two or more races993 1.8% White alone, not Hispanic / Latino342 0.9% Hispanic or LatinoMoved from abroad 441 0.7% White363 2.4% Black or African American72 0.7% Other race377 0.7% White alone, not Hispanic / Latino64 0.2% Hispanic or Latino
Children Nativity (place of birth) in Round Rock
Children under 6 years - Living with two parents Both parents native 3,093 100.0% NativeBoth parents foreign-born 2,332 96.0% Native96 4.0% Foreign-bornOne native, one foreign-born parent 784 100.0% NativeChildren under 6 years - Living with one parent Native parent 1,805 100.0% NativeForeign-born parent 347 100.0% NativeChildren 6 to 17 years - Living with two parents Both parents native 11,054 100.0% NativeBoth parents foreign-born 2,060 71.2% Native834 28.8% Foreign-bornOne native, one foreign-born parent 2,107 96.3% Native82 3.7% Foreign-bornChildren 6 to 17 years - Living with one parent Native parent 4,228 100.0% NativeForeign-born parent 1,538 50.0% Native1,538 50.0% Foreign-born
Place of birth for residents in Round Rock 8,555 Americas8,285 Latin America7,011 Asia6,933 Central America3,804 South Central Asia1,656 Africa1,403 South Eastern Asia1,375 Europe909 Eastern Asia894 Western Asia851 South America667 Eastern Africa584 Western Africa554 Western Europe500 Caribbean419 Northern Europe408 China318 Middle Africa297 Eastern Europe269 Northern America103 Southern Europe43 Oceania43 Australia and New Zealand Subregion35 Southern Africa3 Northern Africa5,892 Mexico2,770 India687 Vietnam553 Nigeria400 Nicaragua392 Nepal338 Iraq324 Pakistan321 Peru317 Philippines302 Korea276 China260 Germany260 Canada245 Cuba233 Guatemala224 Turkey211 Congo209 Thailand198 Japan194 Ethiopia193 France192 Honduras182 El Salvador170 Colombia169 United Arab Emirates159 Venezuela158 Iran155 Scotland148 Dominican Republic146 Brazil122 Taiwan119 Russia106 United Kingdom98 Indonesia94 Kazakhstan90 Cameroon80 Syria80 Ireland79 Israel76 Kenya63 Malaysia63 England55 Ukraine53 Italy50 Poland49 Switzerland43 Portugal41 Jamaica36 Bhutan35 South Africa35 Netherlands34 New Zealand32 Albania27 Barbados27 Zimbabwe27 Afghanistan21 Argentina20 Somalia18 Panama17 Chile16 Burma (Myanmar)16 Democratic Republic of Congo (Zaire)16 Trinidad and Tobago15 Belgium14 Ecuador13 Belize13 Sweden13 Uganda10 Grenada10 Tanzania9 Australia9 Hong Kong7 Singapore6 Spain4 Cambodia
Grandparents responsible for own grandchildren in Round Rock
Grandparents (30 to 59 years) White / Caucasian 105 56.8% Responsible for grandchildren80 43.2% Not responsible for grandchildrenBlack or African American 93 89.9% Responsible for grandchildren10 10.1% Not responsible for grandchildrenAmerican Indian / Alaska Native 37 100.0% Not responsible for grandchildrenAsian 6 57.0% Responsible for grandchildren5 43.0% Not responsible for grandchildrenTwo or more races 28 9.1% Responsible for grandchildren279 90.9% Not responsible for grandchildrenWhite alone, not Hispanic / Latino 64 35.4% Responsible for grandchildren117 64.6% Not responsible for grandchildrenHispanic or Latino 65 25.0% Responsible for grandchildren194 75.0% Not responsible for grandchildrenGrandparents (60 years and over) White / Caucasian 82 10.3% Responsible for grandchildren719 89.7% Not responsible for grandchildrenBlack or African American 95 100.0% Not responsible for grandchildrenAsian 47 25.1% Responsible for grandchildren140 74.9% Not responsible for grandchildrenTwo or more races 28 8.2% Responsible for grandchildren309 91.8% Not responsible for grandchildrenWhite alone, not Hispanic / Latino 40 10.2% Responsible for grandchildren357 89.8% Not responsible for grandchildrenHispanic or Latino 25 3.6% Responsible for grandchildren672 96.4% Not responsible for grandchildren