Races in South Brazos, Texas (TX) Detailed Stats
Ancestries, Foreign-born residents, place of birth
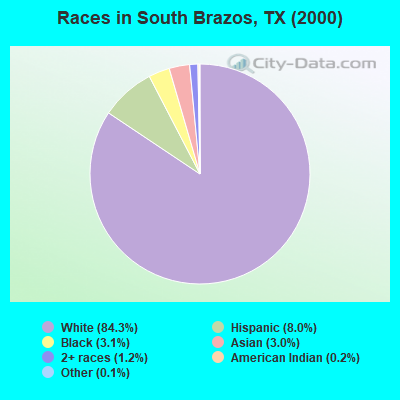
Race distribution in South Brazos

- 19,78284.3%White alone
- 1,8838.0%Hispanic
- 7373.1%Black alone
- 7083.0%Asian alone
- 2771.2%Two or more races
- 540.2%American Indian alone
- 310.1%Other race alone
- 40.02%Native Hawaiian and Other
Pacific Islander alone
2000
2022
-
- 10,933,31352.4%White alone
- 6,669,66632.0%Hispanic
- 2,364,25511.3%Black alone
- 554,4452.7%Asian alone
- 230,5671.1%Two or more races
- 68,8590.3%American Indian alone
- 19,9580.10%Other race alone
- 10,7570.05%Native Hawaiian and Other
Pacific Islander alone

-
- 12,070,64240.2%Hispanic
- 11,683,43038.9%White alone
- 3,508,70611.7%Black alone
- 1,608,1735.4%Asian alone
- 956,5603.2%Two or more races
- 125,7630.4%Other race alone
- 47,0230.2%American Indian alone
- 29,2750.10%Native Hawaiian and Other
Pacific Islander alone

Income and house value in South Brazos
- Median household income in 2022
- $102,521White non-Hispanic householders
- $84,302Black householders
- $43,854American Indian and Alaska Native householders
- $199,994Asian householders
- $49,686Some other race householders
- $98,893Two or more races householders
- $76,705Hispanic or Latino race householders
- Median 2022 house value
- $425,148White Non-Hispanic householders
- $359,672Black or African American householders
- $294,793American Indian or Alaska Native householders
- $457,737Asian householders
- $317,815Some other race householders
- $298,979Two or more races householders
- $365,353Hispanic or Latino householders
Household income for White non-Hispanic householders

Household income for Black householders

Household income for American Indian and Alaska Native householders

Household income for Asian householders

Household income for Two or more races householders

Household income for Hispanic or Latino race householders

Zip code: 77845