Races in Stephenville, Texas (TX) Detailed Stats
Data:
Races - White alone (%)
Races - White alone (% change since 2000)
Races - Black alone (%)
Races - Black alone (% change since 2000)
Races - American Indian alone (%)
Races - American Indian alone (% change since 2000)
Races - Asian alone (%)
Races - Asian alone (% change since 2000)
Races - Hispanic (%)
Races - Hispanic (% change since 2000)
Races - Native Hawaiian and Other Pacific Islander alone (%)
Races - Native Hawaiian and Other Pacific Islander alone (% change since 2000)
Races - Two or more races(%)
Races - Two or more races(% change since 2000)
Races - Other race alone (%)
Races - Other race alone (% change since 2000)
Racial diversity
Place of birth - Born in state of residence (%)
Place of birth - Born in state of residence (%) - White
Place of birth - Born in state of residence (%) - Black or African American
Place of birth - Born in state of residence (%) - Asian
Place of birth - Born in state of residence (%) - Hispanic or Latino
Place of birth - Born in state of residence (%) - American Indian and Alaska Native
Place of birth - Born in state of residence (%) - Multirace
Place of birth - Born in state of residence (%) - Other Race
Place of birth - Born in other state (%)
Place of birth - Born in other state (%) - White
Place of birth - Born in other state (%) - Black or African American
Place of birth - Born in other state (%) - Asian
Place of birth - Born in other state (%) - Hispanic or Latino
Place of birth - Born in other state (%) - American Indian and Alaska Native
Place of birth - Born in other state (%) - Multirace
Place of birth - Born in other state (%) - Other Race
Place of birth - Native, outside of US (%)
Place of birth - Native, outside of US (%) - White
Place of birth - Native, outside of US (%) - Black or African American
Place of birth - Native, outside of US (%) - Asian
Place of birth - Native, outside of US (%) - Hispanic or Latino
Place of birth - Native, outside of US (%) - American Indian and Alaska Native
Place of birth - Native, outside of US (%) - Multirace
Place of birth - Native, outside of US (%) - Other Race
Place of birth - Foreign born (%)
Place of birth - Foreign born (%) - White
Place of birth - Foreign born (%) - Black or African American
Place of birth - Foreign born (%) - Asian
Place of birth - Foreign born (%) - Hispanic or Latino
Place of birth - Foreign born (%) - American Indian and Alaska Native
Place of birth - Foreign born (%) - Multirace
Place of birth - Foreign born (%) - Other Race
Residents speaking English at home (%)
Residents speaking English at home - Born in the United States (%)
Residents speaking English at home - Native, born elsewhere (%)
Residents speaking English at home - Foreign born (%)
Residents speaking Spanish at home (%)
Residents speaking Spanish at home - Born in the United States (%)
Residents speaking Spanish at home - Native, born elsewhere (%)
Residents speaking Spanish at home - Foreign born (%)
Residents speaking other language at home (%)
Residents speaking other language at home - Born in the United States (%)
Residents speaking other language at home - Native, born elsewhere (%)
Residents speaking other language at home - Foreign born (%)
Marital status - Never married (%)
Marital status - Now married (%)
Marital status - Separated (%)
Marital status - Widowed (%)
Marital status - Divorced (%)
Ancestries Reported - Arab (%)
Ancestries Reported - Czech (%)
Ancestries Reported - Danish (%)
Ancestries Reported - Dutch (%)
Ancestries Reported - English (%)
Ancestries Reported - French (%)
Ancestries Reported - French Canadian (%)
Ancestries Reported - German (%)
Ancestries Reported - Greek (%)
Ancestries Reported - Hungarian (%)
Ancestries Reported - Irish (%)
Ancestries Reported - Italian (%)
Ancestries Reported - Lithuanian (%)
Ancestries Reported - Norwegian (%)
Ancestries Reported - Polish (%)
Ancestries Reported - Portuguese (%)
Ancestries Reported - Russian (%)
Ancestries Reported - Scotch-Irish (%)
Ancestries Reported - Scottish (%)
Ancestries Reported - Slovak (%)
Ancestries Reported - Subsaharan African (%)
Ancestries Reported - Swedish (%)
Ancestries Reported - Swiss (%)
Ancestries Reported - Ukrainian (%)
Ancestries Reported - United States (%)
Ancestries Reported - Welsh (%)
Ancestries Reported - West Indian (%)
Ancestries Reported - Other (%)
Geographical mobility - Same house 1 year ago (%)
Geographical mobility - Same house 1 year ago (%) - White
Geographical mobility - Same house 1 year ago (%) - Black or African American
Geographical mobility - Same house 1 year ago (%) - Asian
Geographical mobility - Same house 1 year ago (%) - Hispanic or Latino
Geographical mobility - Same house 1 year ago (%) - American Indian and Alaska Native
Geographical mobility - Same house 1 year ago (%) - Multirace
Geographical mobility - Same house 1 year ago (%) - Other Race
Geographical mobility - Moved within same county (%)
Geographical mobility - Moved within same county (%) - White
Geographical mobility - Moved within same county (%) - Black or African American
Geographical mobility - Moved within same county (%) - Asian
Geographical mobility - Moved within same county (%) - Hispanic or Latino
Geographical mobility - Moved within same county (%) - American Indian and Alaska Native
Geographical mobility - Moved within same county (%) - Multirace
Geographical mobility - Moved within same county (%) - Other Race
Geographical mobility - Moved from different county within same state (%)
Geographical mobility - Moved from different county within same state (%) - White
Geographical mobility - Moved from different county within same state (%) - Black or African American
Geographical mobility - Moved from different county within same state (%) - Asian
Geographical mobility - Moved from different county within same state (%) - Hispanic or Latino
Geographical mobility - Moved from different county within same state (%) - American Indian and Alaska Native
Geographical mobility - Moved from different county within same state (%) - Multirace
Geographical mobility - Moved from different county within same state (%) - Other Race
Geographical mobility - Moved from different state (%)
Geographical mobility - Moved from different state (%) - White
Geographical mobility - Moved from different state (%) - Black or African American
Geographical mobility - Moved from different state (%) - Asian
Geographical mobility - Moved from different state (%) - Hispanic or Latino
Geographical mobility - Moved from different state (%) - American Indian and Alaska Native
Geographical mobility - Moved from different state (%) - Multirace
Geographical mobility - Moved from different state (%) - Other Race
Geographical mobility - Moved from abroad (%)
Geographical mobility - Moved from abroad (%) - White
Geographical mobility - Moved from abroad (%) - Black or African American
Geographical mobility - Moved from abroad (%) - Asian
Geographical mobility - Moved from abroad (%) - Hispanic or Latino
Geographical mobility - Moved from abroad (%) - American Indian and Alaska Native
Geographical mobility - Moved from abroad (%) - Multirace
Geographical mobility - Moved from abroad (%) - Other Race
Place of birth for the foreign-born population - Ireland (%)
Place of birth for the foreign-born population - Denmark (%)
Place of birth for the foreign-born population - Norway (%)
Place of birth for the foreign-born population - Sweden (%)
Place of birth for the foreign-born population - United Kingdom (%)
Place of birth for the foreign-born population - England (%)
Place of birth for the foreign-born population - Scotland (%)
Place of birth for the foreign-born population - Other Northern Europe (%)
Place of birth for the foreign-born population - Austria (%)
Place of birth for the foreign-born population - Belgium (%)
Place of birth for the foreign-born population - France (%)
Place of birth for the foreign-born population - Germany (%)
Place of birth for the foreign-born population - Netherlands (%)
Place of birth for the foreign-born population - Switzerland (%)
Place of birth for the foreign-born population - Other Western Europe (%)
Place of birth for the foreign-born population - Greece (%)
Place of birth for the foreign-born population - Italy (%)
Place of birth for the foreign-born population - Portugal (%)
Place of birth for the foreign-born population - Spain (%)
Place of birth for the foreign-born population - Other Southern Europe (%)
Place of birth for the foreign-born population - Albania (%)
Place of birth for the foreign-born population - Belarus (%)
Place of birth for the foreign-born population - Bosnia and Herzegovina (%)
Place of birth for the foreign-born population - Bulgaria (%)
Place of birth for the foreign-born population - Croatia (%)
Place of birth for the foreign-born population - Czechoslovakia (%)
Place of birth for the foreign-born population - Hungary (%)
Place of birth for the foreign-born population - Latvia (%)
Place of birth for the foreign-born population - Lithuania (%)
Place of birth for the foreign-born population - North Macedonia (Macedonia) (%)
Place of birth for the foreign-born population - Moldova (%)
Place of birth for the foreign-born population - Poland (%)
Place of birth for the foreign-born population - Romania (%)
Place of birth for the foreign-born population - Russia (%)
Place of birth for the foreign-born population - Serbia (%)
Place of birth for the foreign-born population - Ukraine (%)
Place of birth for the foreign-born population - Other Eastern Europe (%)
Place of birth for the foreign-born population - China (%)
Place of birth for the foreign-born population - Hong Kong (%)
Place of birth for the foreign-born population - Taiwan (%)
Place of birth for the foreign-born population - Japan (%)
Place of birth for the foreign-born population - Korea (%)
Place of birth for the foreign-born population - Other Eastern Asia (%)
Place of birth for the foreign-born population - Afghanistan (%)
Place of birth for the foreign-born population - Bangladesh (%)
Place of birth for the foreign-born population - India (%)
Place of birth for the foreign-born population - Iran (%)
Place of birth for the foreign-born population - Kazakhstan (%)
Place of birth for the foreign-born population - Nepal (%)
Place of birth for the foreign-born population - Pakistan (%)
Place of birth for the foreign-born population - Sri Lanka (%)
Place of birth for the foreign-born population - Uzbekistan (%)
Place of birth for the foreign-born population - Other South Central Asia (%)
Place of birth for the foreign-born population - Burma (%)
Place of birth for the foreign-born population - Cambodia (%)
Place of birth for the foreign-born population - Indonesia (%)
Place of birth for the foreign-born population - Laos (%)
Place of birth for the foreign-born population - Malaysia (%)
Place of birth for the foreign-born population - Philippines (%)
Place of birth for the foreign-born population - Singapore (%)
Place of birth for the foreign-born population - Thailand (%)
Place of birth for the foreign-born population - Vietnam (%)
Place of birth for the foreign-born population - Other South Eastern Asia (%)
Place of birth for the foreign-born population - Armenia (%)
Place of birth for the foreign-born population - Iraq (%)
Place of birth for the foreign-born population - Israel (%)
Place of birth for the foreign-born population - Jordan (%)
Place of birth for the foreign-born population - Kuwait (%)
Place of birth for the foreign-born population - Lebanon (%)
Place of birth for the foreign-born population - Saudi Arabia (%)
Place of birth for the foreign-born population - Syria (%)
Place of birth for the foreign-born population - Turkey (%)
Place of birth for the foreign-born population - Yemen (%)
Place of birth for the foreign-born population - Other Western Asia (%)
Place of birth for the foreign-born population - Eritrea (%)
Place of birth for the foreign-born population - Ethiopia (%)
Place of birth for the foreign-born population - Kenya (%)
Place of birth for the foreign-born population - Somalia (%)
Place of birth for the foreign-born population - Uganda (%)
Place of birth for the foreign-born population - Zimbabwe (%)
Place of birth for the foreign-born population - Other Eastern Africa (%)
Place of birth for the foreign-born population - Cameroon (%)
Place of birth for the foreign-born population - Congo (%)
Place of birth for the foreign-born population - Democratic Republic of Congo (Zaire) (%)
Place of birth for the foreign-born population - Other Middle Africa (%)
Place of birth for the foreign-born population - Egypt (%)
Place of birth for the foreign-born population - Morocco (%)
Place of birth for the foreign-born population - Sudan (%)
Place of birth for the foreign-born population - Other Northern Africa (%)
Place of birth for the foreign-born population - South Africa (%)
Place of birth for the foreign-born population - Other Southern Africa (%)
Place of birth for the foreign-born population - Cabo Verde (%)
Place of birth for the foreign-born population - Ghana (%)
Place of birth for the foreign-born population - Liberia (%)
Place of birth for the foreign-born population - Nigeria (%)
Place of birth for the foreign-born population - Senegal (%)
Place of birth for the foreign-born population - Sierra Leone (%)
Place of birth for the foreign-born population - Other Western Africa (%)
Place of birth for the foreign-born population - Australia (%)
Place of birth for the foreign-born population - New Zealand (%)
Place of birth for the foreign-born population - Fiji (%)
Place of birth for the foreign-born population - Micronesia (%)
Place of birth for the foreign-born population - Bahamas (%)
Place of birth for the foreign-born population - Barbados (%)
Place of birth for the foreign-born population - Cuba (%)
Place of birth for the foreign-born population - Dominica (%)
Place of birth for the foreign-born population - Dominican Republic (%)
Place of birth for the foreign-born population - Grenada (%)
Place of birth for the foreign-born population - Haiti (%)
Place of birth for the foreign-born population - Jamaica (%)
Place of birth for the foreign-born population - St. Vincent and the Grenadines (%)
Place of birth for the foreign-born population - Trinidad and Tobago (%)
Place of birth for the foreign-born population - West Indies (%)
Place of birth for the foreign-born population - Other Caribbean (%)
Place of birth for the foreign-born population - Belize (%)
Place of birth for the foreign-born population - Costa Rica (%)
Place of birth for the foreign-born population - El Salvador (%)
Place of birth for the foreign-born population - Guatemala (%)
Place of birth for the foreign-born population - Honduras (%)
Place of birth for the foreign-born population - Mexico (%)
Place of birth for the foreign-born population - Nicaragua (%)
Place of birth for the foreign-born population - Panama (%)
Place of birth for the foreign-born population - Other Central America (%)
Place of birth for the foreign-born population - Argentina (%)
Place of birth for the foreign-born population - Bolivia (%)
Place of birth for the foreign-born population - Brazil (%)
Place of birth for the foreign-born population - Chile (%)
Place of birth for the foreign-born population - Colombia (%)
Place of birth for the foreign-born population - Ecuador (%)
Place of birth for the foreign-born population - Guyana (%)
Place of birth for the foreign-born population - Peru (%)
Place of birth for the foreign-born population - Uruguay (%)
Place of birth for the foreign-born population - Venezuela (%)
Place of birth for the foreign-born population - Other South America (%)
Place of birth for the foreign-born population - Canada (%)
Place of birth for the foreign-born population - Other Northern America (%)
Place of birth for the foreign-born population - Other (%)
Latest news about races in Stephenville, TX collected exclusively by city-data.com from local newspapers, TV, and radio stations
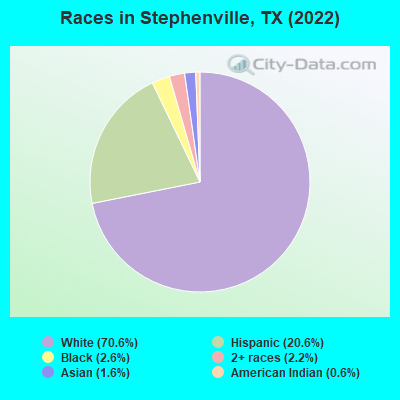
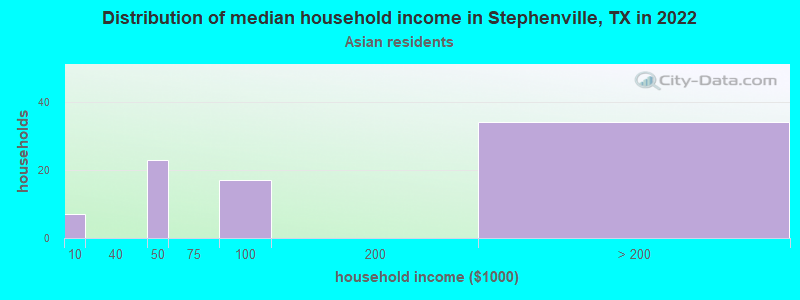
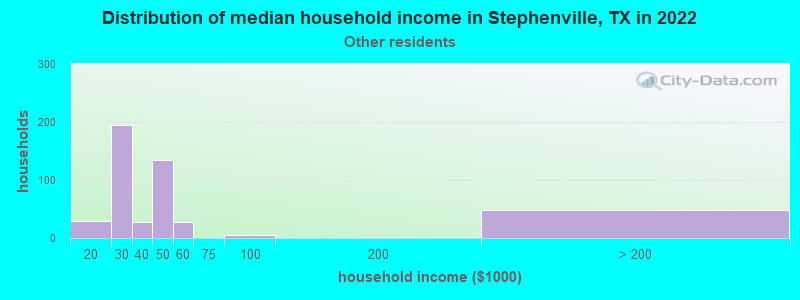
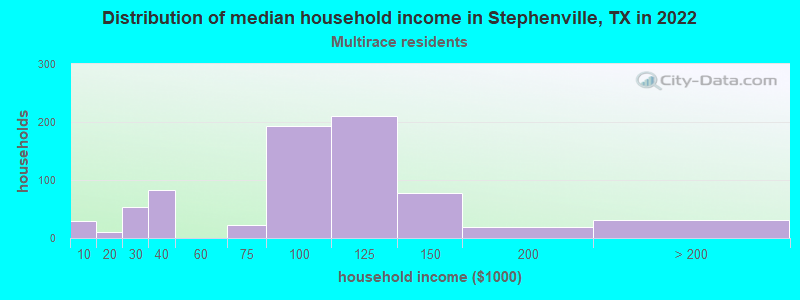
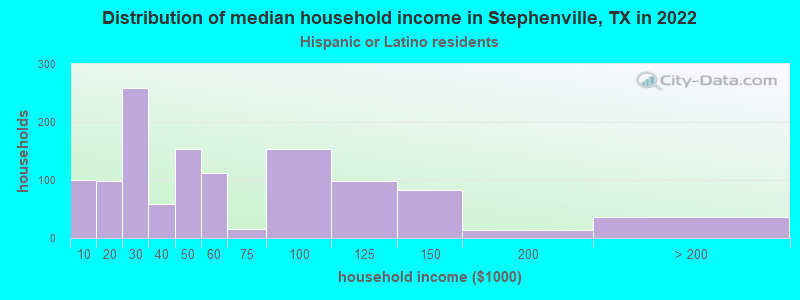
According to 2022 data, the most numerous races in Stephenville, TX are Hispanic (4,452 residents), White alone (15,248 residents), and Black alone (571 residents). 85.8% of Stephenville residents speak English at home. 5.6% of Stephenville, TX residents are foreign-born (3.4% born in Latin America, 1.4% born in Asia), which is 206.3% less than the foreign-born rate of 17.0% across the entire state of Texas.
Race distribution in Stephenville
2000 2022
10,933,313 52.4% White alone 6,669,666 32.0% Hispanic 2,364,255 11.3% Black alone 554,445 2.7% Asian alone 230,567 1.1% Two or more races 68,859 0.3% American Indian alone 19,958 0.10% Other race alone 10,757 0.05% Native Hawaiian and Other
12,070,642 40.2% Hispanic 11,683,430 38.9% White alone 3,508,706 11.7% Black alone 1,608,173 5.4% Asian alone 956,560 3.2% Two or more races 125,763 0.4% Other race alone 47,023 0.2% American Indian alone 29,275 0.10% Native Hawaiian and Other
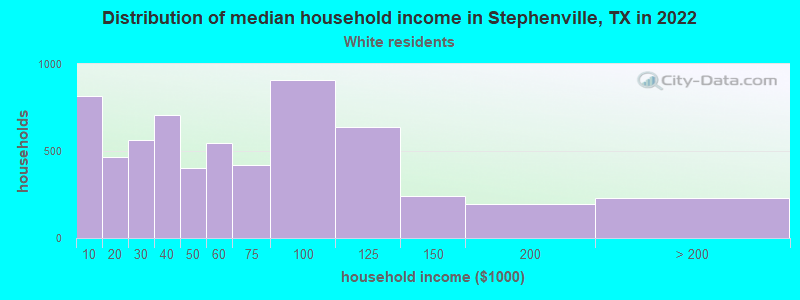
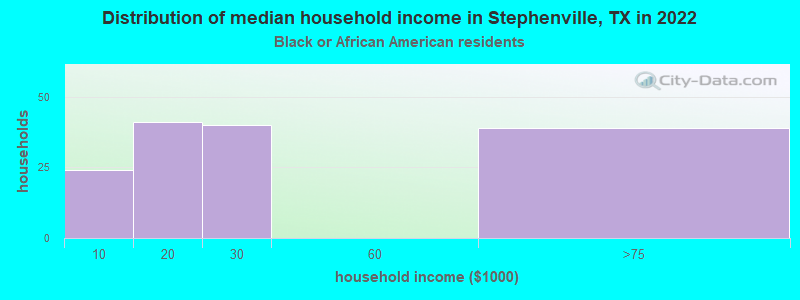
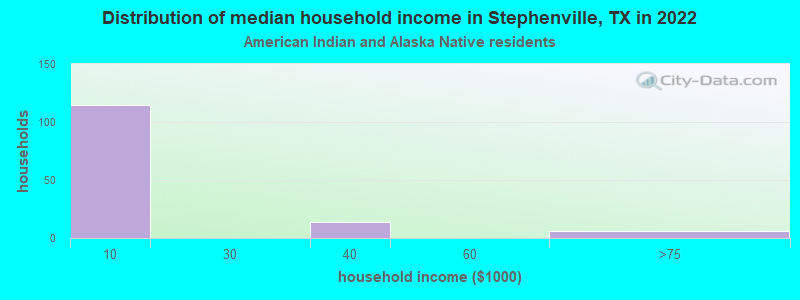
Income and house value in Stephenville Median household income in 2022 $51,304 White non-Hispanic householders$25,678 Black householders$8,330 American Indian and Alaska Native householders$33,096 Some other race householders$97,314 Two or more races householders$43,706 Hispanic or Latino race householdersMedian 2022 house value $248,771 White Non-Hispanic householders$174,527 Black or African American householders$96,764 American Indian or Alaska Native householders $149,544 Asian householders$118,580 Some other race householders$110,487 Two or more races householders$114,357 Hispanic or Latino householders
Median age by race in Stephenville
26.1 Median age for White residents25.3 27.2 25.7 Median age for Black or African American residents20.0 27.6 31.4 Median age for American Indian / Alaska Native residents54.6 31.3 27.5 Median age for Asian residents27.6 29.0 -581,560,283.1 Median age for Native Hawaiian / Pacific Islander residents-612,729,233.5 -577,777,777.2 28.3 Median age for Other race residents28.9 17.2 23.0 Median age for Two or more races residents23.4 22.8 26.1 Median age for White alone residents24.6 26.6 23.6 Median age for Hispanic or Latino residents28.7 20.8
Owner/renter occupied households by race in Stephenville
House owners and renters - White residents 2,963 48.4% Owner occupied3,154 51.6% Renter occupiedHouse owners and renters - Black or African American residents 149 100.0% Renter occupiedHouse owners and renters - American Indian / Alaska Native residents 121 72.9% Owner occupied45 27.1% Renter occupiedHouse owners and renters - Asian residents 44 55.6% Owner occupied35 44.4% Renter occupiedHouse owners and renters - Other race residents 251 53.0% Owner occupied223 47.0% Renter occupiedHouse owners and renters - Two or more races residents 224 30.2% Owner occupied519 69.8% Renter occupiedHouse owners and renters - White alone residents 3,277 49.0% Owner occupied3,409 51.0% Renter occupiedHouse owners and renters - Hispanic or Latino residents 456 38.3% Owner occupied734 61.7% Renter occupied
Language usage in Stephenville
English speakers - Total 85.8% of residents of Stephenville speak English at home.
12.3% of residents speak Spanish at home 1,665 66.0% Speak English very well859 34.0% Speak English less than very well1.8% of residents speak other language at home 234 62.1% Speak English very well143 37.9% Speak English less than very well
English speakers - Born in the United States 92.0% of residents of Stephenville speak English at home.
7.6% of residents speak Spanish at home 244 65.6% Speak English very well128 34.4% Speak English less than very well0.1% of residents speak other language at home 4 100.0% Speak English very well
English speakers - Native, born elsewhere 70.7% of residents of Stephenville speak English at home.
19.7% of residents speak Spanish at home 14 35.9% Speak English very well25 64.1% Speak English less than very well8.6% of residents speak other language at home 12 70.6% Speak English very well5 29.4% Speak English less than very well
English speakers - Foreign-born 19.6% of residents of Stephenville speak English at home.
54.6% of residents speak Spanish at home 259 39.6% Speak English very well395 60.4% Speak English less than very well25.5% of residents speak other language at home 169 55.2% Speak English very well137 44.8% Speak English less than very well
White (Caucasian) - Speak only English Native:
100.0% (13,951)Foreign-born:
66.9% (113)
White (Caucasian) - Speak another language Native:
1.7% (238)Foreign-born:
55.0% (93)
Black or African American - Speak only English Native:
98.7% (472)Foreign-born:
90.7% (7)
Asian - Speak only English Native:
53.2% (23)Foreign-born:
19.5% (63)
Asian - Speak another language Native:
46.8% (20)Foreign-born:
80.8% (261)
Other race - Speak only English Native:
44.3% (496)Foreign-born:
8.8% (31)
Other race - Speak another language Native:
56.3% (630)Foreign-born:
91.4% (322)
Two or more races - Speak another language Native:
76.4% (1,600)Foreign-born:
100.0% (351)
White alone - Speak only English Native:
99.4% (14,469)Foreign-born:
79.6% (134)
White alone - Speak another language Native:
0.8% (110)Foreign-born:
20.5% (35)
Hispanic or Latino - Speak only English Native:
48.3% (1,659)Foreign-born:
3.6% (25)
Hispanic or Latino - Speak another language Native:
51.9% (1,780)Foreign-born:
96.3% (656)
Foreign-born residents in Stephenville 1,198 residents are foreign born (3.4% Latin America , 1.4% Asia ).
This city:
5.6%Texas:
17.1%
Marital status for residents in Stephenville Marital status - White (Caucasian) population 15 years and over
Males 52.6% Never married37.2% Now married1.0% Separated2.8% Widowed6.4% DivorcedFemales 47.1% Never married33.6% Now married1.0% Separated9.3% Widowed9.1% DivorcedWomen who gave birth in the past 12 months Now married:
59.8% (128)Unmarried:
40.2% (86)
Women who did not give birth in the past 12 months Now married:
26.7% (1,124)Unmarried:
73.3% (3,094)
Marital status - Black or African American population 15 years and over
Males 82.6% Never married12.6% Now married0.0% Separated2.1% Widowed2.6% DivorcedFemales 71.7% Never married13.6% Now married0.0% Separated0.3% Widowed14.3% DivorcedWomen who gave birth in the past 12 months Now married:
100.0% (39)Unmarried:
0.0% (0)
Women who did not give birth in the past 12 months Now married:
0.0% (0)Unmarried:
100.0% (193)
Marital status - American Indian / Alaska Native population 15 years and over
Males 0.0% Never married28.1% Now married71.9% Separated0.0% Widowed0.0% DivorcedFemales 52.4% Never married18.7% Now married6.6% Separated0.0% Widowed22.3% DivorcedWomen who did not give birth in the past 12 months Now married:
26.0% (49)Unmarried:
74.0% (139)
Marital status - Asian population 15 years and over
Males 58.6% Never married41.4% Now married0.0% Separated0.0% Widowed0.0% DivorcedFemales 42.6% Never married51.0% Now married0.0% Separated6.5% Widowed0.0% DivorcedWomen who gave birth in the past 12 months Now married:
100.0% (32)Unmarried:
0.0% (0)
Women who did not give birth in the past 12 months Now married:
37.7% (43)Unmarried:
62.3% (71)
Marital status - Other race population 15 years and over
Males 46.1% Never married46.3% Now married0.0% Separated0.0% Widowed7.6% DivorcedFemales 24.7% Never married65.8% Now married0.0% Separated0.0% Widowed9.6% DivorcedWomen who did not give birth in the past 12 months Now married:
72.3% (258)Unmarried:
27.7% (99)
Marital status - Two or more races population 15 years and over
Males 45.7% Never married49.1% Now married2.1% Separated0.0% Widowed3.0% DivorcedFemales 68.9% Never married19.8% Now married1.2% Separated5.2% Widowed4.9% DivorcedWomen who did not give birth in the past 12 months Now married:
15.5% (122)Unmarried:
84.5% (667)
Marital status - White alone, not Hispanic / Latino population 15 years and over
Males 53.6% Never married36.3% Now married0.4% Separated2.7% Widowed6.9% DivorcedFemales 46.0% Never married33.8% Now married1.0% Separated9.6% Widowed9.6% DivorcedWomen who gave birth in the past 12 months Now married:
53.7% (123)Unmarried:
46.3% (106)
Women who did not give birth in the past 12 months Now married:
27.3% (1,291)Unmarried:
72.7% (3,443)
Marital status - Hispanic or Latino population 15 years and over
Males 45.4% Never married47.6% Now married2.9% Separated1.3% Widowed2.9% DivorcedFemales 57.6% Never married34.4% Now married0.0% Separated4.5% Widowed3.5% DivorcedWomen who gave birth in the past 12 months Now married:
100.0% (36)Unmarried:
0.0% (0)
Women who did not give birth in the past 12 months Now married:
30.1% (383)Unmarried:
69.9% (890)
Ancestries in Stephenville
1,654 17.0% English1,103 11.3% American1,074 11.0% German600 6.2% Irish215 2.2% European122 1.3% Scottish71 0.7% Scotch-Irish63 0.6% Italian61 0.6% Czech60 0.6% Norwegian54 0.6% Northern European48 0.5% Dutch40 0.4% British27 0.3% French24 0.2% Danish23 0.2% Swedish22 0.2% South African20 0.2% Jordanian20 0.2% Welsh18 0.2% Russian10 0.1% Nigerian10 0.1% African5 0.05% Lebanese4 0.04% Scandinavian3 0.03% British West Indian
Geographical mobility in Stephenville Same house 1 year ago 10,120 72.7% White (Caucasian)392 73.5% Black or African American326 90.9% American Indian / Alaska Native250 67.7% Asian1,309 80.2% Other race1,986 77.2% Two or more races10,922 72.2% White alone, not Hispanic / Latino3,491 79.5% Hispanic or LatinoMoved within same county 1,039 7.5% White / Caucasian9 1.7% Black or African American7 1.8% Asian270 10.5% Two or more races1,208 8.0% White alone, not Hispanic / Latino228 5.2% Hispanic or LatinoMoved within same state 2,579 18.5% White / Caucasian71 13.3% Black or African American29 8.2% American Indian / Alaska Native318 19.5% Other race174 6.7% Two or more races2,586 17.1% White alone, not Hispanic / Latino583 13.3% Hispanic or LatinoMoved from different state 352 2.5% White / Caucasian20 3.8% Black or African American8 2.2% American Indian / Alaska Native127 34.4% Asian123 4.8% Two or more races355 2.3% White alone, not Hispanic / Latino93 2.1% Hispanic or LatinoMoved from abroad 32 0.2% White46 8.6% Black or African American6 1.7% Asian47 0.3% White alone, not Hispanic / Latino
Children Nativity (place of birth) in Stephenville
Children under 6 years - Living with two parents Both parents native 435 100.0% NativeBoth parents foreign-born 108 100.0% NativeOne native, one foreign-born parent 129 100.0% NativeChildren under 6 years - Living with one parent Native parent 514 100.0% NativeChildren 6 to 17 years - Living with two parents Both parents native 1,471 100.0% Native0 0.0% Foreign-bornBoth parents foreign-born 121 80.1% Native30 19.9% Foreign-bornOne native, one foreign-born parent 8 100.0% NativeChildren 6 to 17 years - Living with one parent Native parent 862 100.0% NativeForeign-born parent 58 50.5% Native57 49.5% Foreign-born
Grandparents responsible for own grandchildren in Stephenville
Grandparents (30 to 59 years) White / Caucasian 67 92.7% Responsible for grandchildren5 7.3% Not responsible for grandchildrenBlack or African American 32 100.0% Responsible for grandchildrenAmerican Indian / Alaska Native 19 100.0% Responsible for grandchildrenTwo or more races 50 100.0% Not responsible for grandchildrenWhite alone, not Hispanic / Latino 87 91.4% Responsible for grandchildren8 8.6% Not responsible for grandchildrenHispanic or Latino 29 100.0% Not responsible for grandchildrenGrandparents (60 years and over) White / Caucasian 40 53.9% Responsible for grandchildren34 46.1% Not responsible for grandchildrenTwo or more races 134 100.0% Not responsible for grandchildrenWhite alone, not Hispanic / Latino 48 64.6% Responsible for grandchildren26 35.4% Not responsible for grandchildrenHispanic or Latino 95 100.0% Not responsible for grandchildren