Races in Takoma Park, Maryland (MD) Detailed Stats
Data:
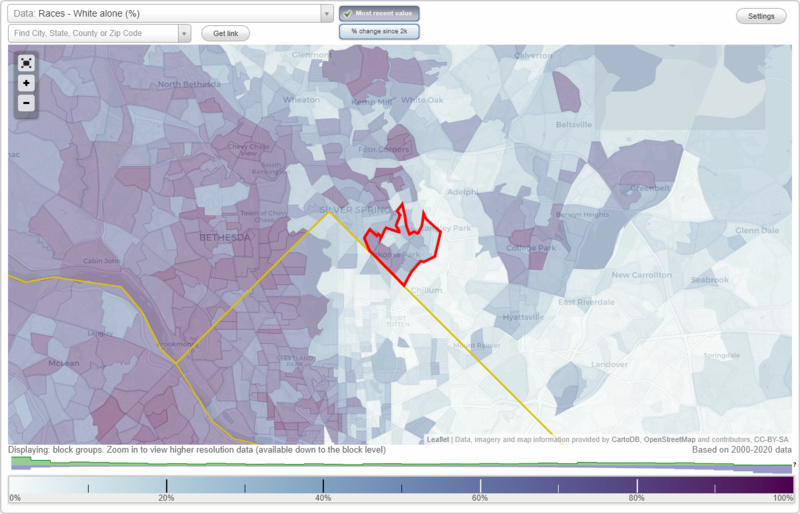
Races - White alone (%)
Races - White alone (% change since 2000)
Races - Black alone (%)
Races - Black alone (% change since 2000)
Races - American Indian alone (%)
Races - American Indian alone (% change since 2000)
Races - Asian alone (%)
Races - Asian alone (% change since 2000)
Races - Hispanic (%)
Races - Hispanic (% change since 2000)
Races - Native Hawaiian and Other Pacific Islander alone (%)
Races - Native Hawaiian and Other Pacific Islander alone (% change since 2000)
Races - Two or more races(%)
Races - Two or more races(% change since 2000)
Races - Other race alone (%)
Races - Other race alone (% change since 2000)
Racial diversity
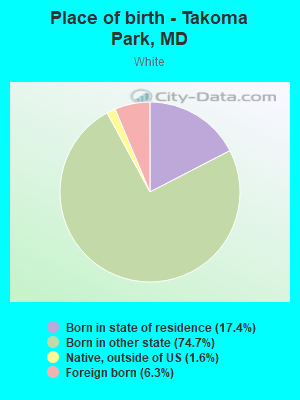
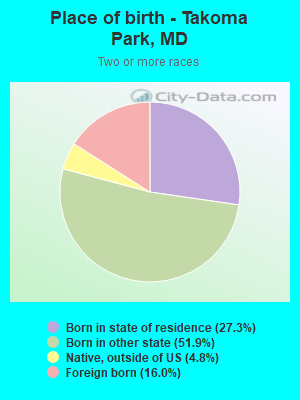
Place of birth - Born in state of residence (%)
Place of birth - Born in state of residence (%) - White
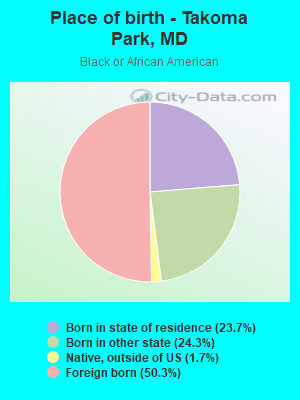
Place of birth - Born in state of residence (%) - Black or African American
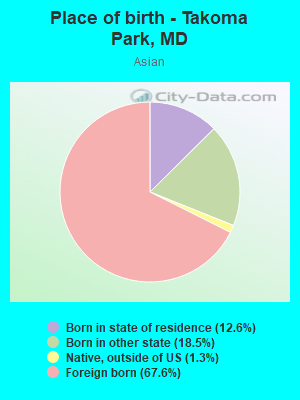
Place of birth - Born in state of residence (%) - Asian
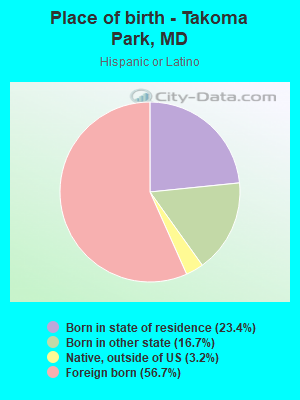
Place of birth - Born in state of residence (%) - Hispanic or Latino
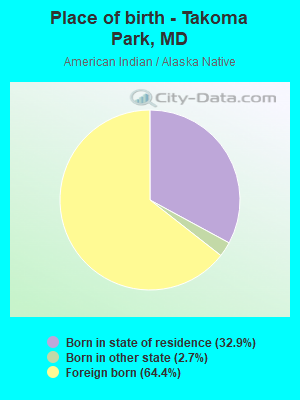
Place of birth - Born in state of residence (%) - American Indian and Alaska Native
Place of birth - Born in state of residence (%) - Multirace
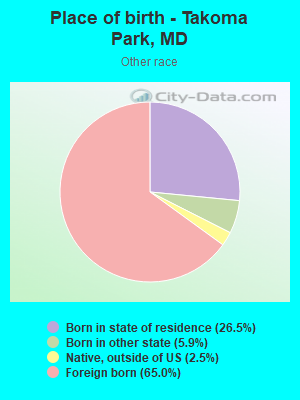
Place of birth - Born in state of residence (%) - Other Race
Place of birth - Born in other state (%)
Place of birth - Born in other state (%) - White
Place of birth - Born in other state (%) - Black or African American
Place of birth - Born in other state (%) - Asian
Place of birth - Born in other state (%) - Hispanic or Latino
Place of birth - Born in other state (%) - American Indian and Alaska Native
Place of birth - Born in other state (%) - Multirace
Place of birth - Born in other state (%) - Other Race
Place of birth - Native, outside of US (%)
Place of birth - Native, outside of US (%) - White
Place of birth - Native, outside of US (%) - Black or African American
Place of birth - Native, outside of US (%) - Asian
Place of birth - Native, outside of US (%) - Hispanic or Latino
Place of birth - Native, outside of US (%) - American Indian and Alaska Native
Place of birth - Native, outside of US (%) - Multirace
Place of birth - Native, outside of US (%) - Other Race
Place of birth - Foreign born (%)
Place of birth - Foreign born (%) - White
Place of birth - Foreign born (%) - Black or African American
Place of birth - Foreign born (%) - Asian
Place of birth - Foreign born (%) - Hispanic or Latino
Place of birth - Foreign born (%) - American Indian and Alaska Native
Place of birth - Foreign born (%) - Multirace
Place of birth - Foreign born (%) - Other Race
Residents speaking English at home (%)
Residents speaking English at home - Born in the United States (%)
Residents speaking English at home - Native, born elsewhere (%)
Residents speaking English at home - Foreign born (%)
Residents speaking Spanish at home (%)
Residents speaking Spanish at home - Born in the United States (%)
Residents speaking Spanish at home - Native, born elsewhere (%)
Residents speaking Spanish at home - Foreign born (%)
Residents speaking other language at home (%)
Residents speaking other language at home - Born in the United States (%)
Residents speaking other language at home - Native, born elsewhere (%)
Residents speaking other language at home - Foreign born (%)
Marital status - Never married (%)
Marital status - Now married (%)
Marital status - Separated (%)
Marital status - Widowed (%)
Marital status - Divorced (%)
Ancestries Reported - Arab (%)
Ancestries Reported - Czech (%)
Ancestries Reported - Danish (%)
Ancestries Reported - Dutch (%)
Ancestries Reported - English (%)
Ancestries Reported - French (%)
Ancestries Reported - French Canadian (%)
Ancestries Reported - German (%)
Ancestries Reported - Greek (%)
Ancestries Reported - Hungarian (%)
Ancestries Reported - Irish (%)
Ancestries Reported - Italian (%)
Ancestries Reported - Lithuanian (%)
Ancestries Reported - Norwegian (%)
Ancestries Reported - Polish (%)
Ancestries Reported - Portuguese (%)
Ancestries Reported - Russian (%)
Ancestries Reported - Scotch-Irish (%)
Ancestries Reported - Scottish (%)
Ancestries Reported - Slovak (%)
Ancestries Reported - Subsaharan African (%)
Ancestries Reported - Swedish (%)
Ancestries Reported - Swiss (%)
Ancestries Reported - Ukrainian (%)
Ancestries Reported - United States (%)
Ancestries Reported - Welsh (%)
Ancestries Reported - West Indian (%)
Ancestries Reported - Other (%)
Geographical mobility - Same house 1 year ago (%)
Geographical mobility - Same house 1 year ago (%) - White
Geographical mobility - Same house 1 year ago (%) - Black or African American
Geographical mobility - Same house 1 year ago (%) - Asian
Geographical mobility - Same house 1 year ago (%) - Hispanic or Latino
Geographical mobility - Same house 1 year ago (%) - American Indian and Alaska Native
Geographical mobility - Same house 1 year ago (%) - Multirace
Geographical mobility - Same house 1 year ago (%) - Other Race
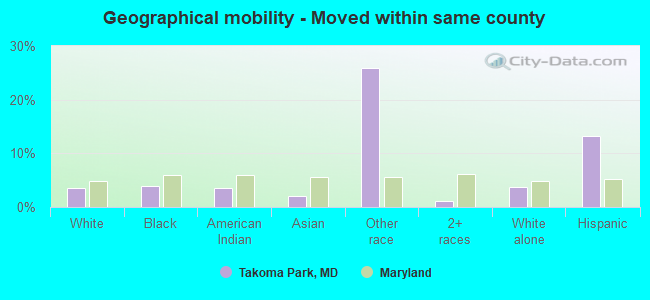
Geographical mobility - Moved within same county (%)
Geographical mobility - Moved within same county (%) - White
Geographical mobility - Moved within same county (%) - Black or African American
Geographical mobility - Moved within same county (%) - Asian
Geographical mobility - Moved within same county (%) - Hispanic or Latino
Geographical mobility - Moved within same county (%) - American Indian and Alaska Native
Geographical mobility - Moved within same county (%) - Multirace
Geographical mobility - Moved within same county (%) - Other Race
Geographical mobility - Moved from different county within same state (%)
Geographical mobility - Moved from different county within same state (%) - White
Geographical mobility - Moved from different county within same state (%) - Black or African American
Geographical mobility - Moved from different county within same state (%) - Asian
Geographical mobility - Moved from different county within same state (%) - Hispanic or Latino
Geographical mobility - Moved from different county within same state (%) - American Indian and Alaska Native
Geographical mobility - Moved from different county within same state (%) - Multirace
Geographical mobility - Moved from different county within same state (%) - Other Race
Geographical mobility - Moved from different state (%)
Geographical mobility - Moved from different state (%) - White
Geographical mobility - Moved from different state (%) - Black or African American
Geographical mobility - Moved from different state (%) - Asian
Geographical mobility - Moved from different state (%) - Hispanic or Latino
Geographical mobility - Moved from different state (%) - American Indian and Alaska Native
Geographical mobility - Moved from different state (%) - Multirace
Geographical mobility - Moved from different state (%) - Other Race
Geographical mobility - Moved from abroad (%)
Geographical mobility - Moved from abroad (%) - White
Geographical mobility - Moved from abroad (%) - Black or African American
Geographical mobility - Moved from abroad (%) - Asian
Geographical mobility - Moved from abroad (%) - Hispanic or Latino
Geographical mobility - Moved from abroad (%) - American Indian and Alaska Native
Geographical mobility - Moved from abroad (%) - Multirace
Geographical mobility - Moved from abroad (%) - Other Race
Place of birth for the foreign-born population - Ireland (%)
Place of birth for the foreign-born population - Denmark (%)
Place of birth for the foreign-born population - Norway (%)
Place of birth for the foreign-born population - Sweden (%)
Place of birth for the foreign-born population - United Kingdom (%)
Place of birth for the foreign-born population - England (%)
Place of birth for the foreign-born population - Scotland (%)
Place of birth for the foreign-born population - Other Northern Europe (%)
Place of birth for the foreign-born population - Austria (%)
Place of birth for the foreign-born population - Belgium (%)
Place of birth for the foreign-born population - France (%)
Place of birth for the foreign-born population - Germany (%)
Place of birth for the foreign-born population - Netherlands (%)
Place of birth for the foreign-born population - Switzerland (%)
Place of birth for the foreign-born population - Other Western Europe (%)
Place of birth for the foreign-born population - Greece (%)
Place of birth for the foreign-born population - Italy (%)
Place of birth for the foreign-born population - Portugal (%)
Place of birth for the foreign-born population - Spain (%)
Place of birth for the foreign-born population - Other Southern Europe (%)
Place of birth for the foreign-born population - Albania (%)
Place of birth for the foreign-born population - Belarus (%)
Place of birth for the foreign-born population - Bosnia and Herzegovina (%)
Place of birth for the foreign-born population - Bulgaria (%)
Place of birth for the foreign-born population - Croatia (%)
Place of birth for the foreign-born population - Czechoslovakia (%)
Place of birth for the foreign-born population - Hungary (%)
Place of birth for the foreign-born population - Latvia (%)
Place of birth for the foreign-born population - Lithuania (%)
Place of birth for the foreign-born population - North Macedonia (Macedonia) (%)
Place of birth for the foreign-born population - Moldova (%)
Place of birth for the foreign-born population - Poland (%)
Place of birth for the foreign-born population - Romania (%)
Place of birth for the foreign-born population - Russia (%)
Place of birth for the foreign-born population - Serbia (%)
Place of birth for the foreign-born population - Ukraine (%)
Place of birth for the foreign-born population - Other Eastern Europe (%)
Place of birth for the foreign-born population - China (%)
Place of birth for the foreign-born population - Hong Kong (%)
Place of birth for the foreign-born population - Taiwan (%)
Place of birth for the foreign-born population - Japan (%)
Place of birth for the foreign-born population - Korea (%)
Place of birth for the foreign-born population - Other Eastern Asia (%)
Place of birth for the foreign-born population - Afghanistan (%)
Place of birth for the foreign-born population - Bangladesh (%)
Place of birth for the foreign-born population - India (%)
Place of birth for the foreign-born population - Iran (%)
Place of birth for the foreign-born population - Kazakhstan (%)
Place of birth for the foreign-born population - Nepal (%)
Place of birth for the foreign-born population - Pakistan (%)
Place of birth for the foreign-born population - Sri Lanka (%)
Place of birth for the foreign-born population - Uzbekistan (%)
Place of birth for the foreign-born population - Other South Central Asia (%)
Place of birth for the foreign-born population - Burma (%)
Place of birth for the foreign-born population - Cambodia (%)
Place of birth for the foreign-born population - Indonesia (%)
Place of birth for the foreign-born population - Laos (%)
Place of birth for the foreign-born population - Malaysia (%)
Place of birth for the foreign-born population - Philippines (%)
Place of birth for the foreign-born population - Singapore (%)
Place of birth for the foreign-born population - Thailand (%)
Place of birth for the foreign-born population - Vietnam (%)
Place of birth for the foreign-born population - Other South Eastern Asia (%)
Place of birth for the foreign-born population - Armenia (%)
Place of birth for the foreign-born population - Iraq (%)
Place of birth for the foreign-born population - Israel (%)
Place of birth for the foreign-born population - Jordan (%)
Place of birth for the foreign-born population - Kuwait (%)
Place of birth for the foreign-born population - Lebanon (%)
Place of birth for the foreign-born population - Saudi Arabia (%)
Place of birth for the foreign-born population - Syria (%)
Place of birth for the foreign-born population - Turkey (%)
Place of birth for the foreign-born population - Yemen (%)
Place of birth for the foreign-born population - Other Western Asia (%)
Place of birth for the foreign-born population - Eritrea (%)
Place of birth for the foreign-born population - Ethiopia (%)
Place of birth for the foreign-born population - Kenya (%)
Place of birth for the foreign-born population - Somalia (%)
Place of birth for the foreign-born population - Uganda (%)
Place of birth for the foreign-born population - Zimbabwe (%)
Place of birth for the foreign-born population - Other Eastern Africa (%)
Place of birth for the foreign-born population - Cameroon (%)
Place of birth for the foreign-born population - Congo (%)
Place of birth for the foreign-born population - Democratic Republic of Congo (Zaire) (%)
Place of birth for the foreign-born population - Other Middle Africa (%)
Place of birth for the foreign-born population - Egypt (%)
Place of birth for the foreign-born population - Morocco (%)
Place of birth for the foreign-born population - Sudan (%)
Place of birth for the foreign-born population - Other Northern Africa (%)
Place of birth for the foreign-born population - South Africa (%)
Place of birth for the foreign-born population - Other Southern Africa (%)
Place of birth for the foreign-born population - Cabo Verde (%)
Place of birth for the foreign-born population - Ghana (%)
Place of birth for the foreign-born population - Liberia (%)
Place of birth for the foreign-born population - Nigeria (%)
Place of birth for the foreign-born population - Senegal (%)
Place of birth for the foreign-born population - Sierra Leone (%)
Place of birth for the foreign-born population - Other Western Africa (%)
Place of birth for the foreign-born population - Australia (%)
Place of birth for the foreign-born population - New Zealand (%)
Place of birth for the foreign-born population - Fiji (%)
Place of birth for the foreign-born population - Micronesia (%)
Place of birth for the foreign-born population - Bahamas (%)
Place of birth for the foreign-born population - Barbados (%)
Place of birth for the foreign-born population - Cuba (%)
Place of birth for the foreign-born population - Dominica (%)
Place of birth for the foreign-born population - Dominican Republic (%)
Place of birth for the foreign-born population - Grenada (%)
Place of birth for the foreign-born population - Haiti (%)
Place of birth for the foreign-born population - Jamaica (%)
Place of birth for the foreign-born population - St. Vincent and the Grenadines (%)
Place of birth for the foreign-born population - Trinidad and Tobago (%)
Place of birth for the foreign-born population - West Indies (%)
Place of birth for the foreign-born population - Other Caribbean (%)
Place of birth for the foreign-born population - Belize (%)
Place of birth for the foreign-born population - Costa Rica (%)
Place of birth for the foreign-born population - El Salvador (%)
Place of birth for the foreign-born population - Guatemala (%)
Place of birth for the foreign-born population - Honduras (%)
Place of birth for the foreign-born population - Mexico (%)
Place of birth for the foreign-born population - Nicaragua (%)
Place of birth for the foreign-born population - Panama (%)
Place of birth for the foreign-born population - Other Central America (%)
Place of birth for the foreign-born population - Argentina (%)
Place of birth for the foreign-born population - Bolivia (%)
Place of birth for the foreign-born population - Brazil (%)
Place of birth for the foreign-born population - Chile (%)
Place of birth for the foreign-born population - Colombia (%)
Place of birth for the foreign-born population - Ecuador (%)
Place of birth for the foreign-born population - Guyana (%)
Place of birth for the foreign-born population - Peru (%)
Place of birth for the foreign-born population - Uruguay (%)
Place of birth for the foreign-born population - Venezuela (%)
Place of birth for the foreign-born population - Other South America (%)
Place of birth for the foreign-born population - Canada (%)
Place of birth for the foreign-born population - Other Northern America (%)
Place of birth for the foreign-born population - Other (%)
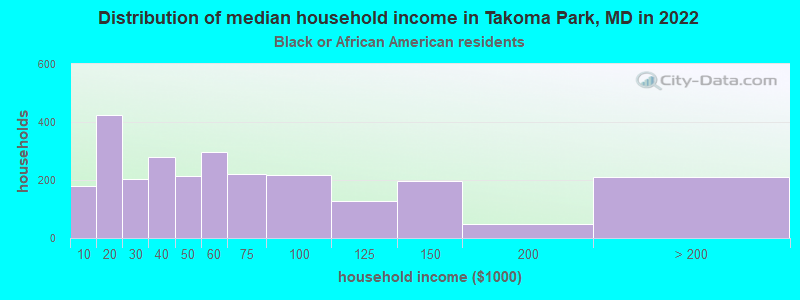
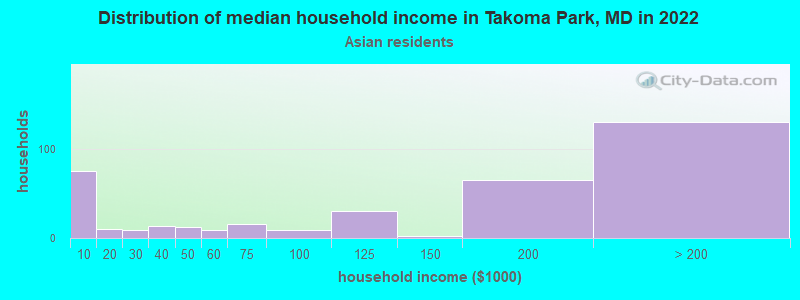
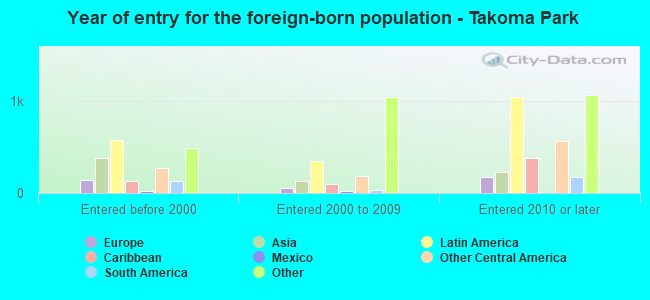
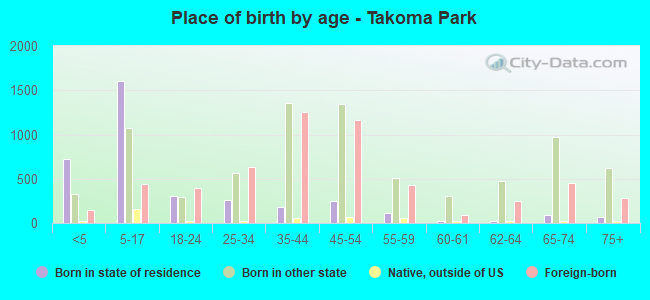
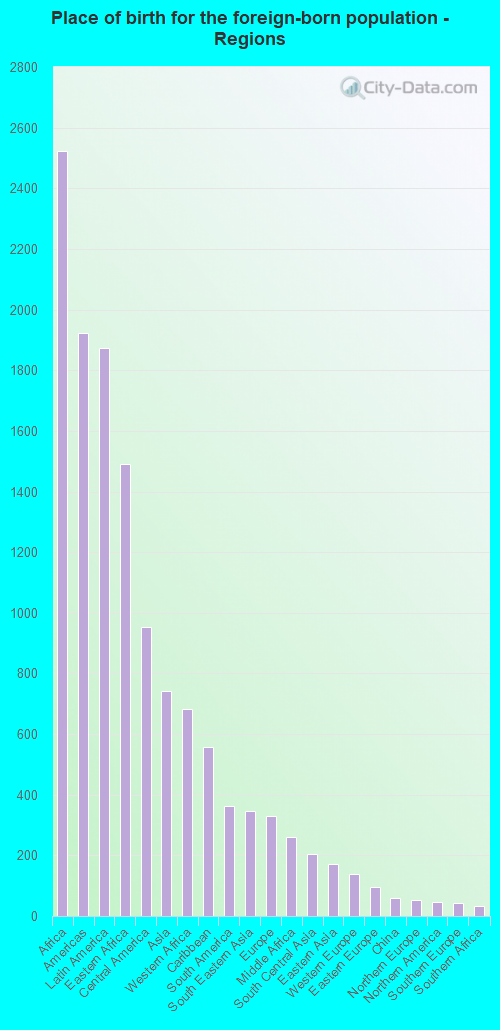
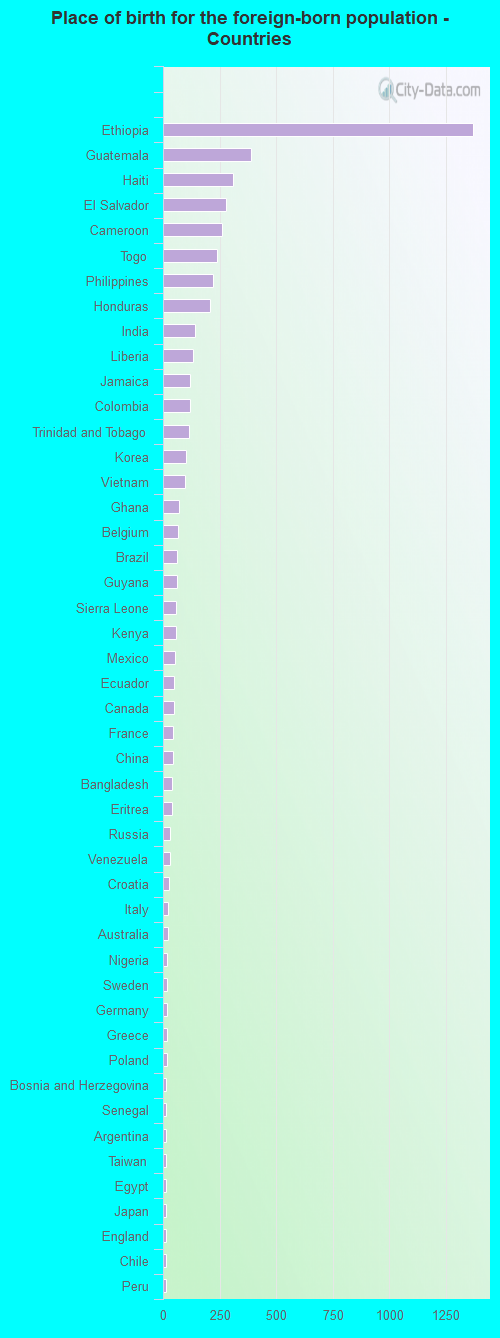
According to 2022 data, the most numerous races in Takoma Park, MD are White alone (7,127 residents), Black alone (5,819 residents), and Hispanic (2,171 residents). 64.5% of Takoma Park residents speak English at home. 31.7% of Takoma Park, MD residents are foreign-born (13.8% born in Africa, 10.3% born in Latin America, 4.1% born in Asia), which is 49.6% greater than the foreign-born rate of 16.0% across the entire state of Maryland.
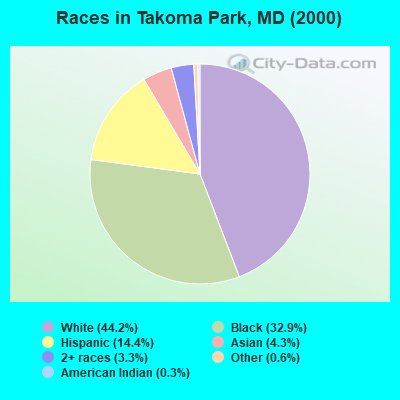
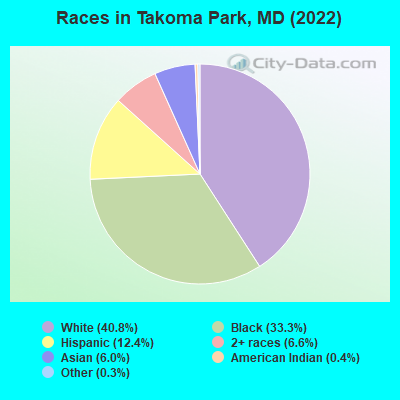
Race distribution in Takoma Park
2000 2022
3,286,547 62.1% White alone 1,464,735 27.7% Black alone 227,916 4.3% Hispanic 209,738 4.0% Asian alone 82,946 1.6% Two or more races 13,312 0.3% American Indian alone 9,379 0.2% Other race alone 1,913 0.04% Native Hawaiian and Other
2,906,492 47.1% White alone 1,800,914 29.2% Black alone 705,842 11.4% Hispanic 401,818 6.5% Asian alone 291,317 4.7% Two or more races 46,930 0.8% Other race alone 8,930 0.1% American Indian alone 2,417 0.04% Native Hawaiian and Other
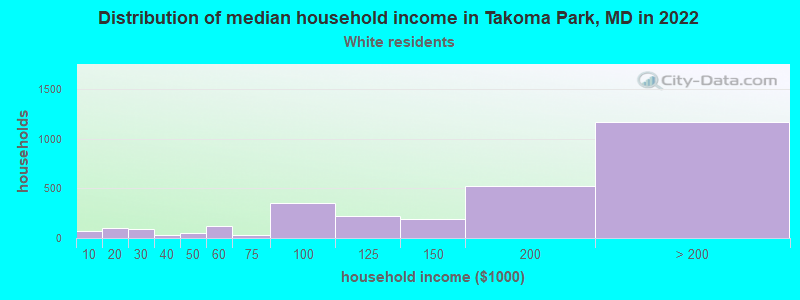
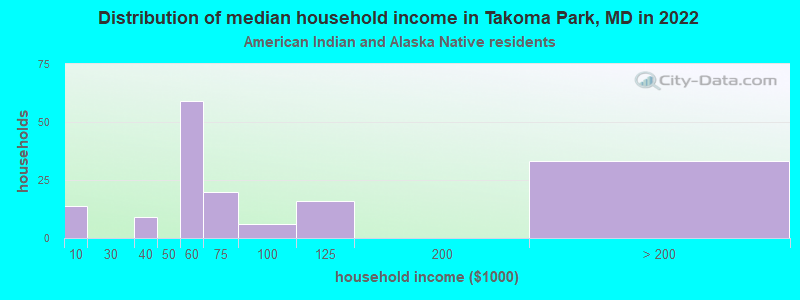
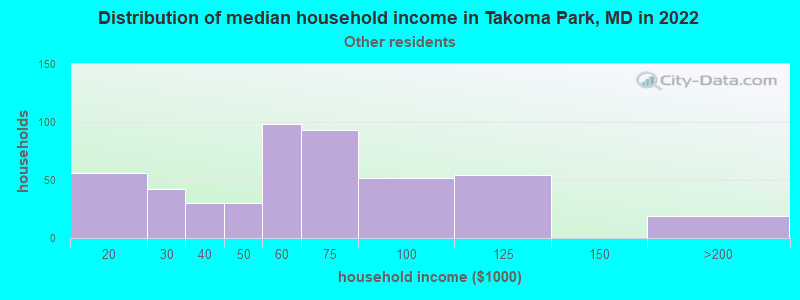
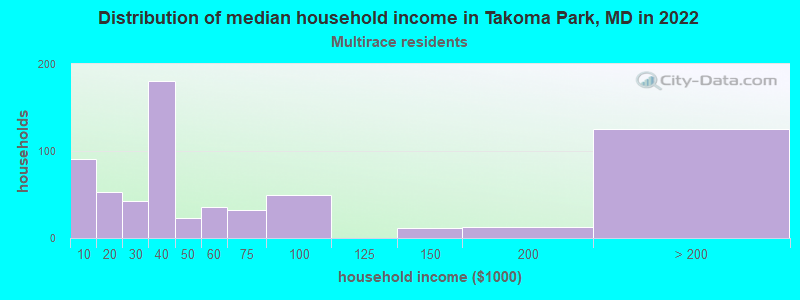
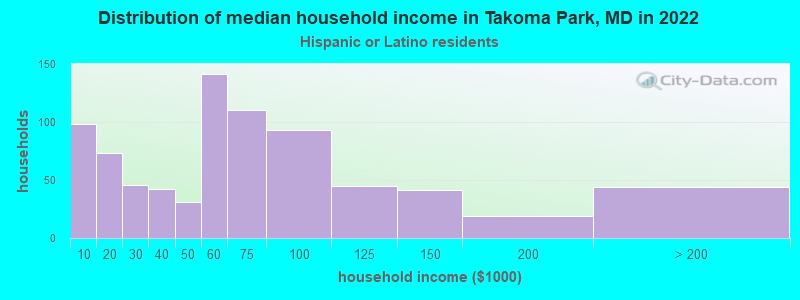
Income and house value in Takoma Park Median household income in 2022 $169,722 White non-Hispanic householders$50,540 Black householders$71,140 American Indian and Alaska Native householders$162,095 Asian householders$52,449 Some other race householders$42,375 Two or more races householders$51,128 Hispanic or Latino race householdersMedian 2022 house value $776,463 White Non-Hispanic householders$622,670 Black or African American householders$515,766 American Indian or Alaska Native householders $573,907 Asian householders$594,538 Some other race householders$603,540 Two or more races householders$590,411 Hispanic or Latino householders
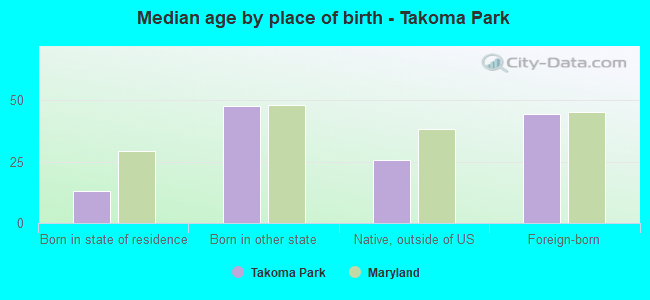
Median age by race in Takoma Park
47.6 Median age for White residents47.4 47.6 39.6 Median age for Black or African American residents37.6 42.0 57.9 Median age for American Indian / Alaska Native residents28.8 64.0 45.6 Median age for Asian residents46.6 45.0 -763,333,332.6 Median age for Native Hawaiian / Pacific Islander residents-720,061,021.4 -760,942,760.2 31.5 Median age for Other race residents24.4 32.3 22.9 Median age for Two or more races residents33.2 20.9 46.5 Median age for White alone residents47.2 46.2 35.6 Median age for Hispanic or Latino residents35.7 37.3
Owner/renter occupied households by race in Takoma Park
House owners and renters - White residents 2,431 81.0% Owner occupied569 19.0% Renter occupiedHouse owners and renters - Black or African American residents 485 19.5% Owner occupied2,005 80.5% Renter occupiedHouse owners and renters - American Indian / Alaska Native residents 123 85.7% Owner occupied20 14.3% Renter occupiedHouse owners and renters - Asian residents 268 71.5% Owner occupied107 28.5% Renter occupiedHouse owners and renters - Other race residents 61 13.5% Owner occupied393 86.5% Renter occupiedHouse owners and renters - Two or more races residents 198 34.3% Owner occupied379 65.7% Renter occupiedHouse owners and renters - White alone residents 2,485 80.8% Owner occupied589 19.2% Renter occupiedHouse owners and renters - Hispanic or Latino residents 220 29.3% Owner occupied532 70.7% Renter occupied
Language usage in Takoma Park
English speakers - Total 64.5% of residents of Takoma Park speak English at home.
10.7% of residents speak Spanish at home 837 48.2% Speak English very well900 51.8% Speak English less than very well24.6% of residents speak other language at home 2,434 60.8% Speak English very well1,567 39.2% Speak English less than very well
English speakers - Born in the United States 93.4% of residents of Takoma Park speak English at home.
2.6% of residents speak Spanish at home 176 88.9% Speak English very well22 11.1% Speak English less than very well4.1% of residents speak other language at home 297 96.1% Speak English very well12 3.9% Speak English less than very well
English speakers - Native, born elsewhere 75.3% of residents of Takoma Park speak English at home.
6.1% of residents speak Spanish at home 21 100.0% Speak English very well17.4% of residents speak other language at home 23 38.3% Speak English very well37 61.7% Speak English less than very well
English speakers - Foreign-born 16.0% of residents of Takoma Park speak English at home.
21.5% of residents speak Spanish at home 336 28.9% Speak English very well827 71.1% Speak English less than very well62.3% of residents speak other language at home 1,875 55.6% Speak English very well1,496 44.4% Speak English less than very well
White (Caucasian) - Speak only English Native:
96.9% (6,101)Foreign-born:
32.8% (136)
White (Caucasian) - Speak another language Native:
4.2% (267)Foreign-born:
69.8% (288)
Black or African American - Speak only English Native:
90.1% (2,154)Foreign-born:
12.9% (382)
Black or African American - Speak another language Native:
9.5% (227)Foreign-born:
89.1% (2,642)
American Indian / Alaska Native - Speak only English Native:
54.8% (33)Foreign-born:
20.0% (33)
American Indian / Alaska Native - Speak another language Native:
17.8% (11)Foreign-born:
82.1% (135)
Asian - Speak only English Native:
61.9% (200)Foreign-born:
33.3% (236)
Asian - Speak another language Native:
35.2% (114)Foreign-born:
67.9% (480)
Other race - Speak only English Native:
24.6% (112)Foreign-born:
1.2% (12)
Other race - Speak another language Native:
75.5% (342)Foreign-born:
99.3% (978)
Two or more races - Speak only English Native:
79.5% (1,041)Foreign-born:
12.8% (33)
Two or more races - Speak another language Native:
17.0% (223)Foreign-born:
87.3% (226)
White alone - Speak only English Native:
95.6% (6,096)Foreign-born:
31.1% (125)
White alone - Speak another language Native:
4.5% (287)Foreign-born:
68.2% (274)
Hispanic or Latino - Speak only English Native:
48.0% (423)Foreign-born:
2.5% (29)
Hispanic or Latino - Speak another language Native:
53.6% (472)Foreign-born:
97.7% (1,137)
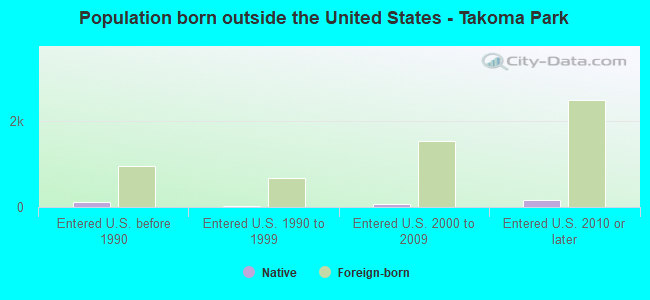
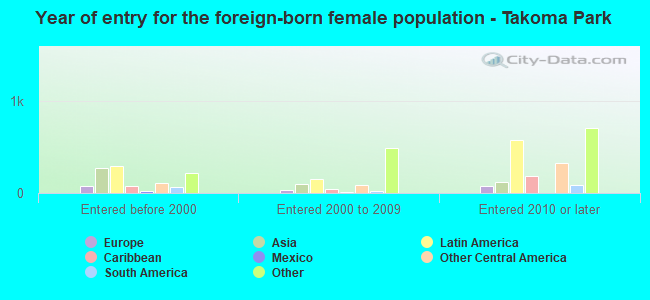
Foreign-born residents in Takoma Park 5,542 residents are foreign born (13.8% Africa , 10.3% Latin America , 4.1% Asia ).
This city:
31.7%Maryland:
15.7%
Marital status for residents in Takoma Park Marital status - White (Caucasian) population 15 years and over
Males 24.1% Never married68.5% Now married0.5% Separated0.4% Widowed6.5% DivorcedFemales 22.5% Never married62.1% Now married0.7% Separated4.3% Widowed10.4% DivorcedWomen who gave birth in the past 12 months Now married:
73.2% (26)Unmarried:
26.8% (10)
Women who did not give birth in the past 12 months Now married:
56.0% (821)Unmarried:
44.0% (645)
Marital status - Black or African American population 15 years and over
Males 38.3% Never married50.2% Now married1.4% Separated0.5% Widowed9.7% DivorcedFemales 42.5% Never married33.6% Now married5.0% Separated5.8% Widowed13.0% DivorcedWomen who gave birth in the past 12 months Now married:
97.9% (282)Unmarried:
2.1% (6)
Women who did not give birth in the past 12 months Now married:
38.7% (484)Unmarried:
61.3% (765)
Marital status - American Indian / Alaska Native population 15 years and over
Males 43.5% Never married45.7% Now married0.0% Separated0.0% Widowed10.9% DivorcedFemales 7.8% Never married49.4% Now married0.0% Separated0.0% Widowed42.9% DivorcedWomen who did not give birth in the past 12 months Now married:
73.9% (25)Unmarried:
26.1% (9)
Marital status - Asian population 15 years and over
Males 36.9% Never married63.1% Now married0.0% Separated0.0% Widowed0.0% DivorcedFemales 36.6% Never married52.7% Now married0.0% Separated5.7% Widowed5.0% DivorcedWomen who gave birth in the past 12 months Now married:
0.0% (0)Unmarried:
100.0% (6)
Women who did not give birth in the past 12 months Now married:
53.8% (193)Unmarried:
46.2% (166)
Marital status - Other race population 15 years and over
Males 54.8% Never married34.8% Now married0.0% Separated3.3% Widowed7.1% DivorcedFemales 54.8% Never married23.9% Now married7.8% Separated2.9% Widowed10.5% DivorcedWomen who gave birth in the past 12 months Now married:
0.0% (0)Unmarried:
100.0% (20)
Women who did not give birth in the past 12 months Now married:
26.6% (105)Unmarried:
73.4% (290)
Marital status - Two or more races population 15 years and over
Males 52.3% Never married35.3% Now married6.2% Separated2.1% Widowed4.1% DivorcedFemales 35.5% Never married50.1% Now married0.0% Separated14.3% Widowed0.0% DivorcedWomen who gave birth in the past 12 months Now married:
100.0% (10)Unmarried:
0.0% (0)
Women who did not give birth in the past 12 months Now married:
50.4% (153)Unmarried:
49.6% (150)
Marital status - White alone, not Hispanic / Latino population 15 years and over
Males 23.1% Never married69.4% Now married0.4% Separated0.4% Widowed6.7% DivorcedFemales 22.1% Never married62.7% Now married0.7% Separated3.7% Widowed10.8% DivorcedWomen who gave birth in the past 12 months Now married:
73.2% (28)Unmarried:
26.8% (10)
Women who did not give birth in the past 12 months Now married:
56.7% (887)Unmarried:
43.3% (677)
Marital status - Hispanic or Latino population 15 years and over
Males 47.8% Never married37.0% Now married0.5% Separated3.1% Widowed11.5% DivorcedFemales 51.0% Never married29.8% Now married4.6% Separated8.5% Widowed6.1% DivorcedWomen who gave birth in the past 12 months Now married:
0.0% (0)Unmarried:
100.0% (16)
Women who did not give birth in the past 12 months Now married:
24.2% (117)Unmarried:
75.8% (366)
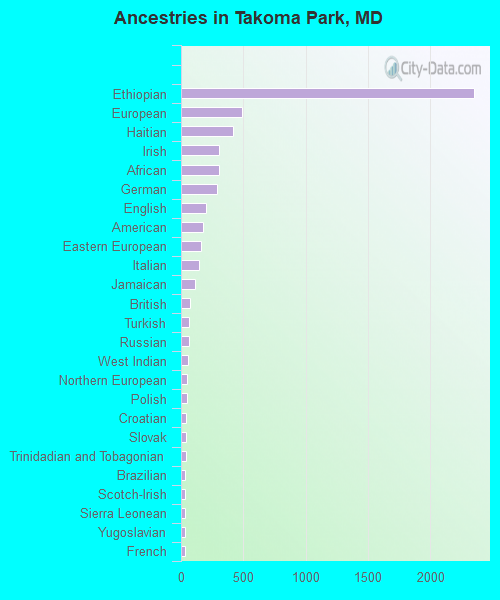
Ancestries in Takoma Park
2,355 22.7% Ethiopian487 4.7% European416 4.0% Haitian305 2.9% Irish304 2.9% African286 2.8% German201 1.9% English177 1.7% American163 1.6% Eastern European142 1.4% Italian110 1.1% Jamaican71 0.7% British65 0.6% Turkish64 0.6% Russian54 0.5% West Indian47 0.5% Northern European45 0.4% Polish42 0.4% Croatian41 0.4% Slovak38 0.4% Trinidadian and Tobagonian36 0.3% Brazilian35 0.3% Scotch-Irish34 0.3% Sierra Leonean31 0.3% Yugoslavian31 0.3% French28 0.3% Nigerian26 0.3% Ghanaian24 0.2% Scottish23 0.2% Welsh21 0.2% Portuguese17 0.2% Scandinavian17 0.2% Greek16 0.2% Liberian16 0.2% Swedish14 0.1% Egyptian13 0.1% Iranian12 0.1% Senegalese12 0.1% Ukrainian9 0.09% Palestinian9 0.09% Dutch8 0.08% Czech7 0.07% Guyanese6 0.06% Hungarian6 0.06% British West Indian5 0.05% Norwegian4 0.04% Swiss3 0.03% French Canadian
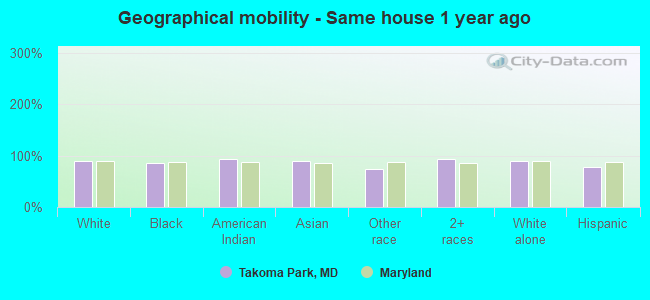
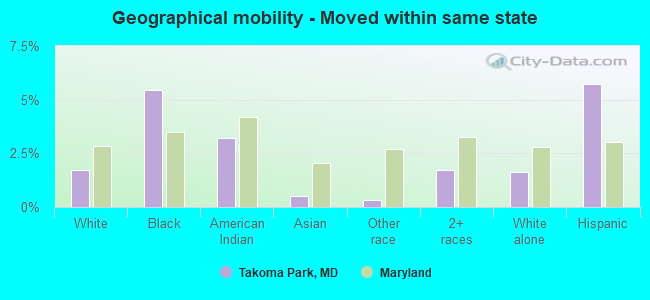
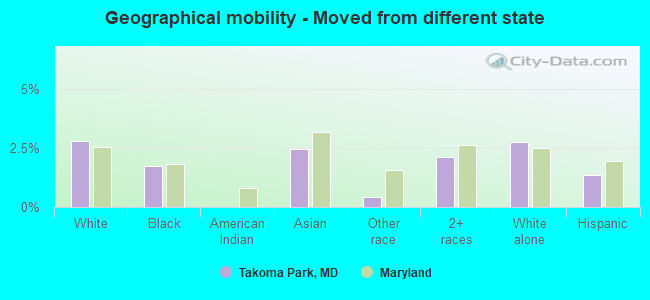
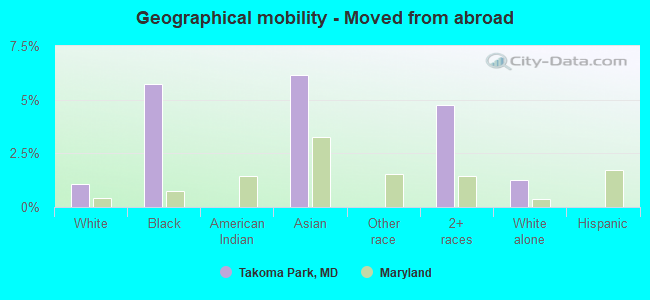
Geographical mobility in Takoma Park Same house 1 year ago 6,248 90.6% White (Caucasian)4,931 86.0% Black or African American228 93.0% American Indian / Alaska Native950 90.2% Asian1,124 74.5% Other race1,547 93.3% Two or more races6,421 90.4% White alone, not Hispanic / Latino1,685 78.3% Hispanic or LatinoMoved within same county 247 3.6% White / Caucasian229 4.0% Black or African American9 3.5% American Indian / Alaska Native21 2.0% Asian390 25.8% Other race18 1.1% Two or more races270 3.8% White alone, not Hispanic / Latino285 13.2% Hispanic or LatinoMoved within same state 118 1.7% White / Caucasian312 5.4% Black or African American8 3.2% American Indian / Alaska Native5 0.5% Asian5 0.3% Other race28 1.7% Two or more races114 1.6% White alone, not Hispanic / Latino123 5.7% Hispanic or LatinoMoved from different state 191 2.8% White / Caucasian99 1.7% Black or African American26 2.4% Asian6 0.4% Other race35 2.1% Two or more races193 2.7% White alone, not Hispanic / Latino29 1.4% Hispanic or LatinoMoved from abroad 75 1.1% White328 5.7% Black or African American65 6.1% Asian79 4.7% Two or more races88 1.2% White alone, not Hispanic / Latino
Children Nativity (place of birth) in Takoma Park
Children under 6 years - Living with two parents Both parents native 488 98.5% Native8 1.5% Foreign-bornBoth parents foreign-born 577 82.4% Native123 17.6% Foreign-bornOne native, one foreign-born parent 46 100.0% NativeChildren under 6 years - Living with one parent Native parent 39 100.0% NativeForeign-born parent 166 75.6% Native54 24.4% Foreign-bornChildren 6 to 17 years - Living with two parents Both parents native 1,041 98.0% Native21 2.0% Foreign-bornBoth parents foreign-born 612 82.6% Native129 17.4% Foreign-bornOne native, one foreign-born parent 297 97.7% Native7 2.3% Foreign-bornChildren 6 to 17 years - Living with one parent Native parent 137 100.0% NativeForeign-born parent 425 66.6% Native213 33.4% Foreign-born
Grandparents responsible for own grandchildren in Takoma Park
Grandparents (30 to 59 years) White / Caucasian 7 100.0% Not responsible for grandchildrenBlack or African American 21 100.0% Not responsible for grandchildrenOther race 60 100.0% Not responsible for grandchildrenWhite alone, not Hispanic / Latino 13 100.0% Not responsible for grandchildrenHispanic or Latino 53 100.0% Not responsible for grandchildrenGrandparents (60 years and over) White / Caucasian 44 100.0% Not responsible for grandchildrenBlack or African American 16 55.5% Responsible for grandchildren13 44.5% Not responsible for grandchildrenOther race 14 100.0% Not responsible for grandchildrenWhite alone, not Hispanic / Latino 40 100.0% Not responsible for grandchildrenHispanic or Latino 27 100.0% Not responsible for grandchildren