Races in Tyler, Texas (TX) Detailed Stats
Data:
Races - White alone (%)
Races - White alone (% change since 2000)
Races - Black alone (%)
Races - Black alone (% change since 2000)
Races - American Indian alone (%)
Races - American Indian alone (% change since 2000)
Races - Asian alone (%)
Races - Asian alone (% change since 2000)
Races - Hispanic (%)
Races - Hispanic (% change since 2000)
Races - Native Hawaiian and Other Pacific Islander alone (%)
Races - Native Hawaiian and Other Pacific Islander alone (% change since 2000)
Races - Two or more races(%)
Races - Two or more races(% change since 2000)
Races - Other race alone (%)
Races - Other race alone (% change since 2000)
Racial diversity
Place of birth - Born in state of residence (%)
Place of birth - Born in state of residence (%) - White
Place of birth - Born in state of residence (%) - Black or African American
Place of birth - Born in state of residence (%) - Asian
Place of birth - Born in state of residence (%) - Hispanic or Latino
Place of birth - Born in state of residence (%) - American Indian and Alaska Native
Place of birth - Born in state of residence (%) - Multirace
Place of birth - Born in state of residence (%) - Other Race
Place of birth - Born in other state (%)
Place of birth - Born in other state (%) - White
Place of birth - Born in other state (%) - Black or African American
Place of birth - Born in other state (%) - Asian
Place of birth - Born in other state (%) - Hispanic or Latino
Place of birth - Born in other state (%) - American Indian and Alaska Native
Place of birth - Born in other state (%) - Multirace
Place of birth - Born in other state (%) - Other Race
Place of birth - Native, outside of US (%)
Place of birth - Native, outside of US (%) - White
Place of birth - Native, outside of US (%) - Black or African American
Place of birth - Native, outside of US (%) - Asian
Place of birth - Native, outside of US (%) - Hispanic or Latino
Place of birth - Native, outside of US (%) - American Indian and Alaska Native
Place of birth - Native, outside of US (%) - Multirace
Place of birth - Native, outside of US (%) - Other Race
Place of birth - Foreign born (%)
Place of birth - Foreign born (%) - White
Place of birth - Foreign born (%) - Black or African American
Place of birth - Foreign born (%) - Asian
Place of birth - Foreign born (%) - Hispanic or Latino
Place of birth - Foreign born (%) - American Indian and Alaska Native
Place of birth - Foreign born (%) - Multirace
Place of birth - Foreign born (%) - Other Race
Residents speaking English at home (%)
Residents speaking English at home - Born in the United States (%)
Residents speaking English at home - Native, born elsewhere (%)
Residents speaking English at home - Foreign born (%)
Residents speaking Spanish at home (%)
Residents speaking Spanish at home - Born in the United States (%)
Residents speaking Spanish at home - Native, born elsewhere (%)
Residents speaking Spanish at home - Foreign born (%)
Residents speaking other language at home (%)
Residents speaking other language at home - Born in the United States (%)
Residents speaking other language at home - Native, born elsewhere (%)
Residents speaking other language at home - Foreign born (%)
Marital status - Never married (%)
Marital status - Now married (%)
Marital status - Separated (%)
Marital status - Widowed (%)
Marital status - Divorced (%)
Ancestries Reported - Arab (%)
Ancestries Reported - Czech (%)
Ancestries Reported - Danish (%)
Ancestries Reported - Dutch (%)
Ancestries Reported - English (%)
Ancestries Reported - French (%)
Ancestries Reported - French Canadian (%)
Ancestries Reported - German (%)
Ancestries Reported - Greek (%)
Ancestries Reported - Hungarian (%)
Ancestries Reported - Irish (%)
Ancestries Reported - Italian (%)
Ancestries Reported - Lithuanian (%)
Ancestries Reported - Norwegian (%)
Ancestries Reported - Polish (%)
Ancestries Reported - Portuguese (%)
Ancestries Reported - Russian (%)
Ancestries Reported - Scotch-Irish (%)
Ancestries Reported - Scottish (%)
Ancestries Reported - Slovak (%)
Ancestries Reported - Subsaharan African (%)
Ancestries Reported - Swedish (%)
Ancestries Reported - Swiss (%)
Ancestries Reported - Ukrainian (%)
Ancestries Reported - United States (%)
Ancestries Reported - Welsh (%)
Ancestries Reported - West Indian (%)
Ancestries Reported - Other (%)
Geographical mobility - Same house 1 year ago (%)
Geographical mobility - Same house 1 year ago (%) - White
Geographical mobility - Same house 1 year ago (%) - Black or African American
Geographical mobility - Same house 1 year ago (%) - Asian
Geographical mobility - Same house 1 year ago (%) - Hispanic or Latino
Geographical mobility - Same house 1 year ago (%) - American Indian and Alaska Native
Geographical mobility - Same house 1 year ago (%) - Multirace
Geographical mobility - Same house 1 year ago (%) - Other Race
Geographical mobility - Moved within same county (%)
Geographical mobility - Moved within same county (%) - White
Geographical mobility - Moved within same county (%) - Black or African American
Geographical mobility - Moved within same county (%) - Asian
Geographical mobility - Moved within same county (%) - Hispanic or Latino
Geographical mobility - Moved within same county (%) - American Indian and Alaska Native
Geographical mobility - Moved within same county (%) - Multirace
Geographical mobility - Moved within same county (%) - Other Race
Geographical mobility - Moved from different county within same state (%)
Geographical mobility - Moved from different county within same state (%) - White
Geographical mobility - Moved from different county within same state (%) - Black or African American
Geographical mobility - Moved from different county within same state (%) - Asian
Geographical mobility - Moved from different county within same state (%) - Hispanic or Latino
Geographical mobility - Moved from different county within same state (%) - American Indian and Alaska Native
Geographical mobility - Moved from different county within same state (%) - Multirace
Geographical mobility - Moved from different county within same state (%) - Other Race
Geographical mobility - Moved from different state (%)
Geographical mobility - Moved from different state (%) - White
Geographical mobility - Moved from different state (%) - Black or African American
Geographical mobility - Moved from different state (%) - Asian
Geographical mobility - Moved from different state (%) - Hispanic or Latino
Geographical mobility - Moved from different state (%) - American Indian and Alaska Native
Geographical mobility - Moved from different state (%) - Multirace
Geographical mobility - Moved from different state (%) - Other Race
Geographical mobility - Moved from abroad (%)
Geographical mobility - Moved from abroad (%) - White
Geographical mobility - Moved from abroad (%) - Black or African American
Geographical mobility - Moved from abroad (%) - Asian
Geographical mobility - Moved from abroad (%) - Hispanic or Latino
Geographical mobility - Moved from abroad (%) - American Indian and Alaska Native
Geographical mobility - Moved from abroad (%) - Multirace
Geographical mobility - Moved from abroad (%) - Other Race
Place of birth for the foreign-born population - Ireland (%)
Place of birth for the foreign-born population - Denmark (%)
Place of birth for the foreign-born population - Norway (%)
Place of birth for the foreign-born population - Sweden (%)
Place of birth for the foreign-born population - United Kingdom (%)
Place of birth for the foreign-born population - England (%)
Place of birth for the foreign-born population - Scotland (%)
Place of birth for the foreign-born population - Other Northern Europe (%)
Place of birth for the foreign-born population - Austria (%)
Place of birth for the foreign-born population - Belgium (%)
Place of birth for the foreign-born population - France (%)
Place of birth for the foreign-born population - Germany (%)
Place of birth for the foreign-born population - Netherlands (%)
Place of birth for the foreign-born population - Switzerland (%)
Place of birth for the foreign-born population - Other Western Europe (%)
Place of birth for the foreign-born population - Greece (%)
Place of birth for the foreign-born population - Italy (%)
Place of birth for the foreign-born population - Portugal (%)
Place of birth for the foreign-born population - Spain (%)
Place of birth for the foreign-born population - Other Southern Europe (%)
Place of birth for the foreign-born population - Albania (%)
Place of birth for the foreign-born population - Belarus (%)
Place of birth for the foreign-born population - Bosnia and Herzegovina (%)
Place of birth for the foreign-born population - Bulgaria (%)
Place of birth for the foreign-born population - Croatia (%)
Place of birth for the foreign-born population - Czechoslovakia (%)
Place of birth for the foreign-born population - Hungary (%)
Place of birth for the foreign-born population - Latvia (%)
Place of birth for the foreign-born population - Lithuania (%)
Place of birth for the foreign-born population - North Macedonia (Macedonia) (%)
Place of birth for the foreign-born population - Moldova (%)
Place of birth for the foreign-born population - Poland (%)
Place of birth for the foreign-born population - Romania (%)
Place of birth for the foreign-born population - Russia (%)
Place of birth for the foreign-born population - Serbia (%)
Place of birth for the foreign-born population - Ukraine (%)
Place of birth for the foreign-born population - Other Eastern Europe (%)
Place of birth for the foreign-born population - China (%)
Place of birth for the foreign-born population - Hong Kong (%)
Place of birth for the foreign-born population - Taiwan (%)
Place of birth for the foreign-born population - Japan (%)
Place of birth for the foreign-born population - Korea (%)
Place of birth for the foreign-born population - Other Eastern Asia (%)
Place of birth for the foreign-born population - Afghanistan (%)
Place of birth for the foreign-born population - Bangladesh (%)
Place of birth for the foreign-born population - India (%)
Place of birth for the foreign-born population - Iran (%)
Place of birth for the foreign-born population - Kazakhstan (%)
Place of birth for the foreign-born population - Nepal (%)
Place of birth for the foreign-born population - Pakistan (%)
Place of birth for the foreign-born population - Sri Lanka (%)
Place of birth for the foreign-born population - Uzbekistan (%)
Place of birth for the foreign-born population - Other South Central Asia (%)
Place of birth for the foreign-born population - Burma (%)
Place of birth for the foreign-born population - Cambodia (%)
Place of birth for the foreign-born population - Indonesia (%)
Place of birth for the foreign-born population - Laos (%)
Place of birth for the foreign-born population - Malaysia (%)
Place of birth for the foreign-born population - Philippines (%)
Place of birth for the foreign-born population - Singapore (%)
Place of birth for the foreign-born population - Thailand (%)
Place of birth for the foreign-born population - Vietnam (%)
Place of birth for the foreign-born population - Other South Eastern Asia (%)
Place of birth for the foreign-born population - Armenia (%)
Place of birth for the foreign-born population - Iraq (%)
Place of birth for the foreign-born population - Israel (%)
Place of birth for the foreign-born population - Jordan (%)
Place of birth for the foreign-born population - Kuwait (%)
Place of birth for the foreign-born population - Lebanon (%)
Place of birth for the foreign-born population - Saudi Arabia (%)
Place of birth for the foreign-born population - Syria (%)
Place of birth for the foreign-born population - Turkey (%)
Place of birth for the foreign-born population - Yemen (%)
Place of birth for the foreign-born population - Other Western Asia (%)
Place of birth for the foreign-born population - Eritrea (%)
Place of birth for the foreign-born population - Ethiopia (%)
Place of birth for the foreign-born population - Kenya (%)
Place of birth for the foreign-born population - Somalia (%)
Place of birth for the foreign-born population - Uganda (%)
Place of birth for the foreign-born population - Zimbabwe (%)
Place of birth for the foreign-born population - Other Eastern Africa (%)
Place of birth for the foreign-born population - Cameroon (%)
Place of birth for the foreign-born population - Congo (%)
Place of birth for the foreign-born population - Democratic Republic of Congo (Zaire) (%)
Place of birth for the foreign-born population - Other Middle Africa (%)
Place of birth for the foreign-born population - Egypt (%)
Place of birth for the foreign-born population - Morocco (%)
Place of birth for the foreign-born population - Sudan (%)
Place of birth for the foreign-born population - Other Northern Africa (%)
Place of birth for the foreign-born population - South Africa (%)
Place of birth for the foreign-born population - Other Southern Africa (%)
Place of birth for the foreign-born population - Cabo Verde (%)
Place of birth for the foreign-born population - Ghana (%)
Place of birth for the foreign-born population - Liberia (%)
Place of birth for the foreign-born population - Nigeria (%)
Place of birth for the foreign-born population - Senegal (%)
Place of birth for the foreign-born population - Sierra Leone (%)
Place of birth for the foreign-born population - Other Western Africa (%)
Place of birth for the foreign-born population - Australia (%)
Place of birth for the foreign-born population - New Zealand (%)
Place of birth for the foreign-born population - Fiji (%)
Place of birth for the foreign-born population - Micronesia (%)
Place of birth for the foreign-born population - Bahamas (%)
Place of birth for the foreign-born population - Barbados (%)
Place of birth for the foreign-born population - Cuba (%)
Place of birth for the foreign-born population - Dominica (%)
Place of birth for the foreign-born population - Dominican Republic (%)
Place of birth for the foreign-born population - Grenada (%)
Place of birth for the foreign-born population - Haiti (%)
Place of birth for the foreign-born population - Jamaica (%)
Place of birth for the foreign-born population - St. Vincent and the Grenadines (%)
Place of birth for the foreign-born population - Trinidad and Tobago (%)
Place of birth for the foreign-born population - West Indies (%)
Place of birth for the foreign-born population - Other Caribbean (%)
Place of birth for the foreign-born population - Belize (%)
Place of birth for the foreign-born population - Costa Rica (%)
Place of birth for the foreign-born population - El Salvador (%)
Place of birth for the foreign-born population - Guatemala (%)
Place of birth for the foreign-born population - Honduras (%)
Place of birth for the foreign-born population - Mexico (%)
Place of birth for the foreign-born population - Nicaragua (%)
Place of birth for the foreign-born population - Panama (%)
Place of birth for the foreign-born population - Other Central America (%)
Place of birth for the foreign-born population - Argentina (%)
Place of birth for the foreign-born population - Bolivia (%)
Place of birth for the foreign-born population - Brazil (%)
Place of birth for the foreign-born population - Chile (%)
Place of birth for the foreign-born population - Colombia (%)
Place of birth for the foreign-born population - Ecuador (%)
Place of birth for the foreign-born population - Guyana (%)
Place of birth for the foreign-born population - Peru (%)
Place of birth for the foreign-born population - Uruguay (%)
Place of birth for the foreign-born population - Venezuela (%)
Place of birth for the foreign-born population - Other South America (%)
Place of birth for the foreign-born population - Canada (%)
Place of birth for the foreign-born population - Other Northern America (%)
Place of birth for the foreign-born population - Other (%)
Latest news about races in Tyler, TX collected exclusively by city-data.com from local newspapers, TV, and radio stations
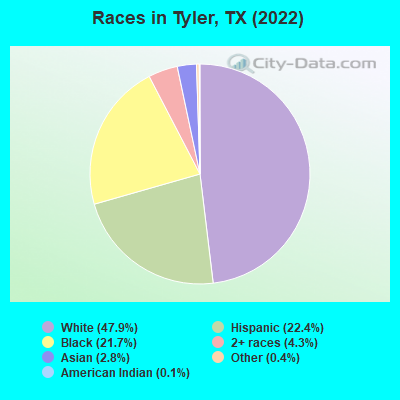
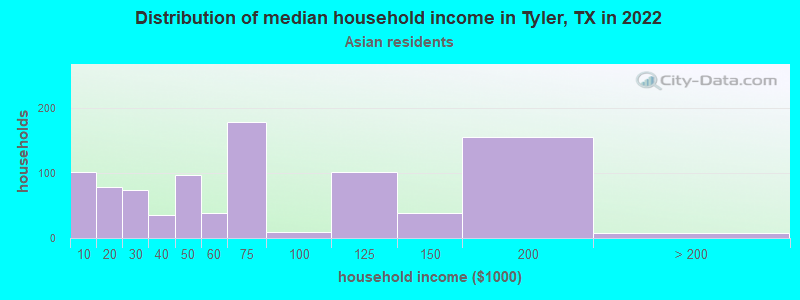
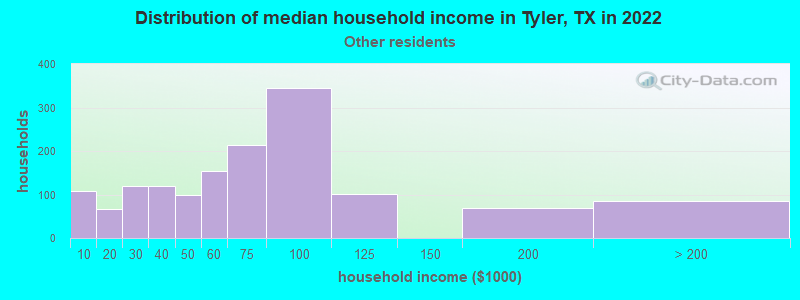
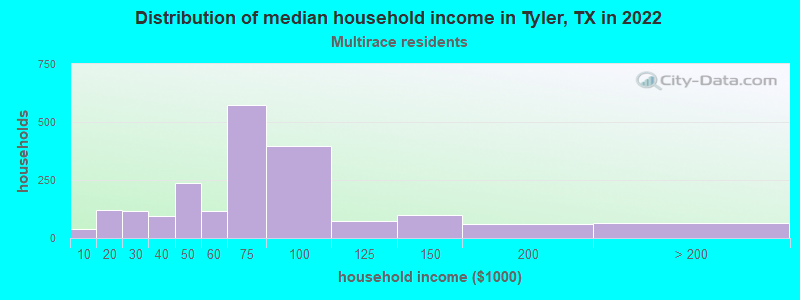
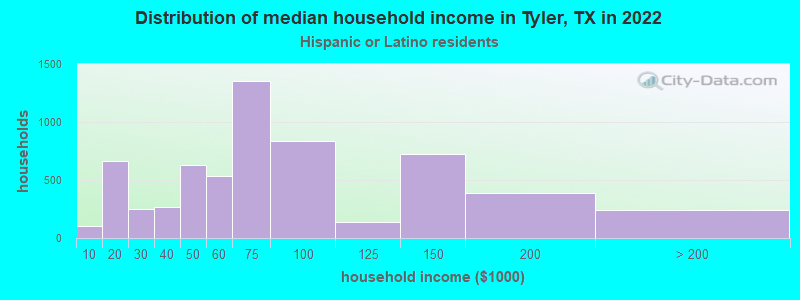
According to 2022 data, the most numerous races in Tyler, TX are Hispanic (24,533 residents), White alone (52,576 residents), and Black alone (23,796 residents). 82.4% of Tyler residents speak English at home. 10.8% of Tyler, TX residents are foreign-born (7.5% born in Latin America, 1.8% born in Asia), which is 57.8% less than the foreign-born rate of 17.0% across the entire state of Texas.
Race distribution in Tyler
2000 2022
10,933,313 52.4% White alone 6,669,666 32.0% Hispanic 2,364,255 11.3% Black alone 554,445 2.7% Asian alone 230,567 1.1% Two or more races 68,859 0.3% American Indian alone 19,958 0.10% Other race alone 10,757 0.05% Native Hawaiian and Other
12,070,642 40.2% Hispanic 11,683,430 38.9% White alone 3,508,706 11.7% Black alone 1,608,173 5.4% Asian alone 956,560 3.2% Two or more races 125,763 0.4% Other race alone 47,023 0.2% American Indian alone 29,275 0.10% Native Hawaiian and Other
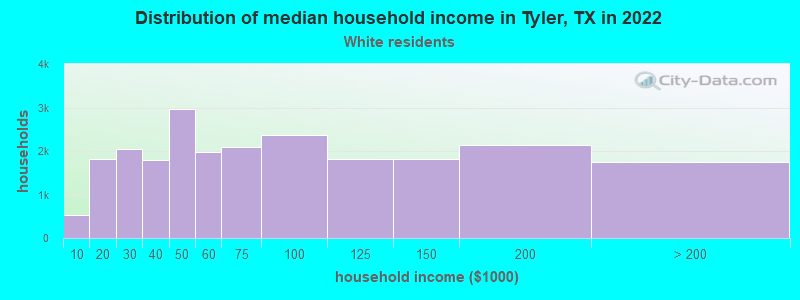
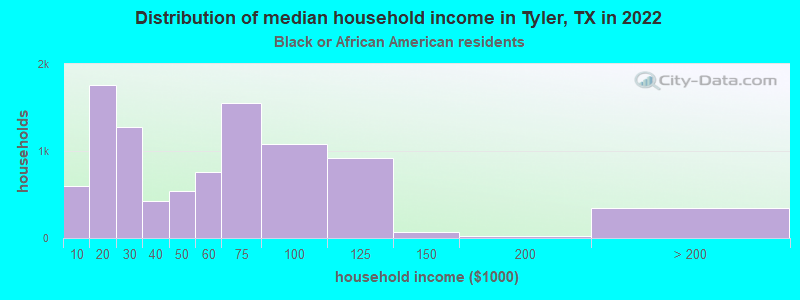
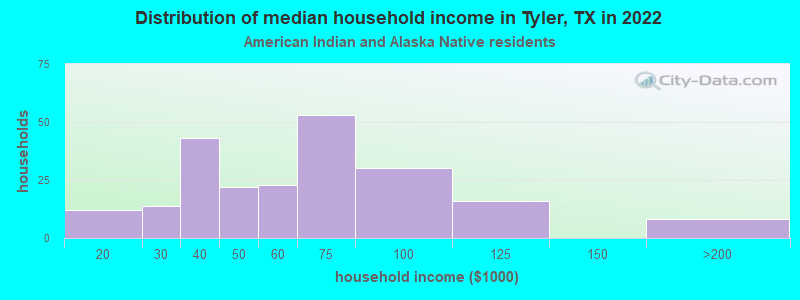
Income and house value in Tyler Median household income in 2022 $64,270 White non-Hispanic householders$52,938 Black householders$44,346 American Indian and Alaska Native householders$127,177 Asian householders$65,600 Some other race householders$63,308 Two or more races householders$63,361 Hispanic or Latino race householdersMedian 2022 house value $281,221 White Non-Hispanic householders$146,317 Black or African American householders$206,599 American Indian or Alaska Native householders $518,255 Asian householders$117,053 Some other race householders$193,431 Two or more races householders$129,051 Hispanic or Latino householders
Median age by race in Tyler
39.7 Median age for White residents38.5 40.8 31.0 Median age for Black or African American residents23.7 37.2 22.7 Median age for American Indian / Alaska Native residents20.7 27.2 35.1 Median age for Asian residents33.6 42.4 -666,666,666.0 Median age for Native Hawaiian / Pacific Islander residents-666,666,666.0 -666,666,666.0 43.3 Median age for Other race residents43.7 43.1 22.2 Median age for Two or more races residents20.2 24.9 40.8 Median age for White alone residents39.8 44.9 27.1 Median age for Hispanic or Latino residents25.9 27.3
Owner/renter occupied households by race in Tyler
House owners and renters - White residents 15,293 66.2% Owner occupied7,810 33.8% Renter occupiedHouse owners and renters - Black or African American residents 3,767 40.4% Owner occupied5,564 59.6% Renter occupiedHouse owners and renters - American Indian / Alaska Native residents 176 79.1% Owner occupied46 20.9% Renter occupiedHouse owners and renters - Asian residents 429 74.1% Owner occupied150 25.9% Renter occupiedHouse owners and renters - Other race residents 646 67.4% Owner occupied312 32.6% Renter occupiedHouse owners and renters - Two or more races residents 2,068 60.5% Owner occupied1,351 39.5% Renter occupiedHouse owners and renters - White alone residents 13,726 67.0% Owner occupied6,751 33.0% Renter occupiedHouse owners and renters - Hispanic or Latino residents 3,907 63.8% Owner occupied2,216 36.2% Renter occupied
Language usage in Tyler
English speakers - Total 82.4% of residents of Tyler speak English at home.
15.3% of residents speak Spanish at home 7,205 46.5% Speak English very well8,304 53.5% Speak English less than very well2.3% of residents speak other language at home 1,739 73.3% Speak English very well634 26.7% Speak English less than very well
English speakers - Born in the United States 94.2% of residents of Tyler speak English at home.
5.0% of residents speak Spanish at home 814 76.4% Speak English very well251 23.6% Speak English less than very well0.8% of residents speak other language at home 100 61.3% Speak English very well63 38.7% Speak English less than very well
English speakers - Native, born elsewhere 37.8% of residents of Tyler speak English at home.
57.9% of residents speak Spanish at home 65 9.4% Speak English very well627 90.6% Speak English less than very well4.3% of residents speak other language at home 51 100.0% Speak English very well
English speakers - Foreign-born 13.5% of residents of Tyler speak English at home.
66.1% of residents speak Spanish at home 1,408 22.2% Speak English very well4,936 77.8% Speak English less than very well20.4% of residents speak other language at home 1,390 70.9% Speak English very well571 29.1% Speak English less than very well
White (Caucasian) - Speak only English Native:
93.9% (50,091)Foreign-born:
18.2% (671)
White (Caucasian) - Speak another language Native:
6.1% (3,272)Foreign-born:
81.8% (3,012)
Black or African American - Speak only English Native:
99.6% (23,824)Foreign-born:
37.7% (349)
Black or African American - Speak another language Native:
0.4% (107)Foreign-born:
61.4% (568)
American Indian / Alaska Native - Speak only English Native:
48.2% (261)Foreign-born:
5.7% (19)
American Indian / Alaska Native - Speak another language Native:
52.6% (285)Foreign-born:
94.1% (316)
Asian - Speak only English Native:
87.5% (1,079)Foreign-born:
14.7% (269)
Asian - Speak another language Native:
52.8% (651)Foreign-born:
85.3% (1,560)
Native Hawaiian / Pacific Islander - Speak only English Native:
98.9% (33)Foreign-born:
51.5% (15)
Other race - Speak only English Native:
48.7% (1,045)Foreign-born:
17.6% (188)
Other race - Speak another language Native:
51.3% (1,099)Foreign-born:
82.4% (880)
Two or more races - Speak only English Native:
54.0% (5,843)Foreign-born:
2.3% (66)
Two or more races - Speak another language Native:
46.0% (4,985)Foreign-born:
97.7% (2,825)
White alone - Speak only English Native:
98.5% (48,835)Foreign-born:
60.0% (349)
White alone - Speak another language Native:
1.6% (787)Foreign-born:
40.6% (236)
Hispanic or Latino - Speak only English Native:
36.4% (5,199)Foreign-born:
11.2% (797)
Hispanic or Latino - Speak another language Native:
63.6% (9,100)Foreign-born:
88.8% (6,344)
Foreign-born residents in Tyler 11,820 residents are foreign born (7.5% Latin America , 1.8% Asia ).
This city:
10.8%Texas:
17.1%
Marital status for residents in Tyler Marital status - White (Caucasian) population 15 years and over
Males 34.7% Never married50.2% Now married0.2% Separated2.7% Widowed12.2% DivorcedFemales 32.6% Never married40.9% Now married1.8% Separated10.9% Widowed13.8% DivorcedWomen who gave birth in the past 12 months Now married:
74.5% (810)Unmarried:
25.5% (277)
Women who did not give birth in the past 12 months Now married:
37.8% (5,302)Unmarried:
62.2% (8,706)
Marital status - Black or African American population 15 years and over
Males 53.9% Never married27.2% Now married0.0% Separated3.8% Widowed15.1% DivorcedFemales 44.7% Never married24.8% Now married3.5% Separated8.5% Widowed18.4% DivorcedWomen who gave birth in the past 12 months Now married:
9.0% (17)Unmarried:
91.0% (173)
Women who did not give birth in the past 12 months Now married:
26.0% (1,757)Unmarried:
74.0% (5,014)
Marital status - American Indian / Alaska Native population 15 years and over
Males 53.0% Never married44.7% Now married0.0% Separated0.0% Widowed2.3% DivorcedFemales 31.4% Never married65.5% Now married0.0% Separated3.1% Widowed0.0% DivorcedWomen who gave birth in the past 12 months Now married:
100.0% (6)Unmarried:
0.0% (0)
Women who did not give birth in the past 12 months Now married:
64.0% (181)Unmarried:
36.0% (102)
Marital status - Asian population 15 years and over
Males 24.4% Never married64.1% Now married1.6% Separated6.4% Widowed3.4% DivorcedFemales 31.6% Never married48.4% Now married3.6% Separated6.8% Widowed9.7% DivorcedWomen who gave birth in the past 12 months Now married:
100.0% (41)Unmarried:
0.0% (0)
Women who did not give birth in the past 12 months Now married:
46.7% (460)Unmarried:
53.3% (525)
Marital status - Native Hawaiian / Pacific Islander population 15 years and over
Males 100.0% Never married0.0% Now married0.0% Separated0.0% Widowed0.0% DivorcedFemales 0.0% Never married100.0% Now married0.0% Separated0.0% Widowed0.0% DivorcedWomen who did not give birth in the past 12 months Now married:
100.0% (32)Unmarried:
0.0% (0)
Marital status - Other race population 15 years and over
Males 31.2% Never married56.6% Now married0.5% Separated2.8% Widowed8.9% DivorcedFemales 31.4% Never married53.9% Now married1.1% Separated4.3% Widowed9.4% DivorcedWomen who gave birth in the past 12 months Now married:
100.0% (44)Unmarried:
0.0% (0)
Women who did not give birth in the past 12 months Now married:
45.2% (512)Unmarried:
54.8% (622)
Marital status - Two or more races population 15 years and over
Males 34.2% Never married59.3% Now married2.4% Separated0.9% Widowed3.3% DivorcedFemales 43.0% Never married41.0% Now married0.0% Separated3.9% Widowed12.0% DivorcedWomen who gave birth in the past 12 months Now married:
60.7% (195)Unmarried:
39.3% (126)
Women who did not give birth in the past 12 months Now married:
36.8% (1,407)Unmarried:
63.2% (2,417)
Marital status - White alone, not Hispanic / Latino population 15 years and over
Males 33.5% Never married50.8% Now married0.3% Separated2.0% Widowed13.4% DivorcedFemales 30.4% Never married42.6% Now married1.0% Separated10.8% Widowed15.2% DivorcedWomen who gave birth in the past 12 months Now married:
79.2% (732)Unmarried:
20.8% (192)
Women who did not give birth in the past 12 months Now married:
39.7% (4,652)Unmarried:
60.3% (7,052)
Marital status - Hispanic or Latino population 15 years and over
Males 36.3% Never married52.7% Now married1.3% Separated3.0% Widowed6.8% DivorcedFemales 43.4% Never married41.6% Now married3.1% Separated5.6% Widowed6.3% DivorcedWomen who gave birth in the past 12 months Now married:
70.4% (273)Unmarried:
29.6% (115)
Women who did not give birth in the past 12 months Now married:
36.5% (2,183)Unmarried:
63.5% (3,805)
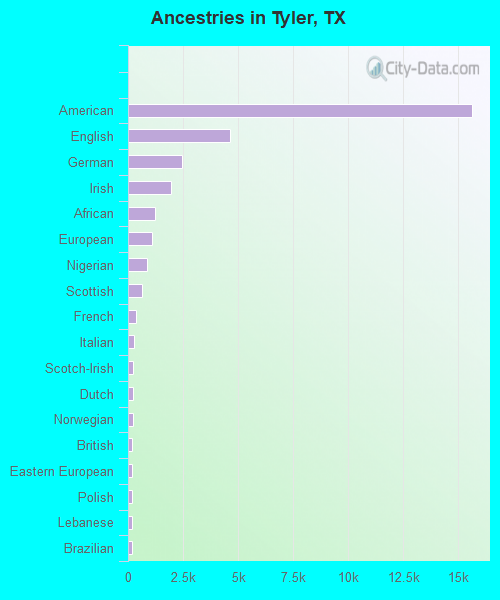
Ancestries in Tyler
15,626 22.1% American4,648 6.6% English2,440 3.5% German1,933 2.7% Irish1,224 1.7% African1,082 1.5% European881 1.2% Nigerian647 0.9% Scottish383 0.5% French291 0.4% Italian244 0.3% Scotch-Irish234 0.3% Dutch219 0.3% Norwegian200 0.3% British184 0.3% Eastern European182 0.3% Polish165 0.2% Lebanese162 0.2% Brazilian86 0.1% Russian84 0.1% Turkish78 0.1% Hungarian72 0.1% Swedish70 0.10% Scandinavian70 0.10% Kenyan69 0.10% Iranian65 0.09% Northern European60 0.08% Czech58 0.08% Welsh57 0.08% Ghanaian44 0.06% Greek37 0.05% Jordanian33 0.05% Cajun33 0.05% Romanian31 0.04% Palestinian25 0.04% French Canadian25 0.04% Serbian25 0.04% Portuguese24 0.03% Cypriot20 0.03% Danish19 0.03% Finnish15 0.02% Canadian12 0.02% Australian11 0.02% Slavic11 0.02% Ethiopian10 0.01% Trinidadian and Tobagonian9 0.01% Celtic7 0.01% Swiss4 0.01% Syrian
Geographical mobility in Tyler Same house 1 year ago 49,525 83.5% White (Caucasian)21,311 90.5% Black or African American974 100.0% American Indian / Alaska Native2,535 81.5% Asian30 47.1% Native Hawaiian / Pacific Islander3,904 88.9% Other race13,659 83.4% Two or more races41,483 81.5% White alone, not Hispanic / Latino21,943 91.7% Hispanic or LatinoMoved within same county 5,043 8.5% White / Caucasian1,528 6.5% Black or African American1 0.1% American Indian / Alaska Native406 13.1% Asian302 6.9% Other race1,610 9.8% Two or more races4,965 9.8% White alone, not Hispanic / Latino893 3.7% Hispanic or LatinoMoved within same state 3,711 6.3% White / Caucasian1,123 4.8% Black or African American4 0.4% American Indian / Alaska Native42 1.4% Asian118 2.7% Other race847 5.2% Two or more races3,419 6.7% White alone, not Hispanic / Latino851 3.6% Hispanic or LatinoMoved from different state 852 1.4% White / Caucasian216 0.9% Black or African American69 2.2% Asian61 95.3% Native Hawaiian / Pacific Islander14 0.3% Other race53 0.3% Two or more races852 1.7% White alone, not Hispanic / Latino25 0.1% Hispanic or LatinoMoved from abroad 162 0.3% White60 0.3% Black or African American45 1.0% Other race205 1.3% Two or more races162 0.3% White alone, not Hispanic / Latino205 0.9% Hispanic or Latino
Children Nativity (place of birth) in Tyler
Children under 6 years - Living with two parents Both parents native 3,331 100.0% NativeBoth parents foreign-born 428 83.1% Native87 16.9% Foreign-bornOne native, one foreign-born parent 1,453 100.0% NativeChildren under 6 years - Living with one parent Native parent 3,303 100.0% NativeChildren 6 to 17 years - Living with two parents Both parents native 8,763 100.0% NativeBoth parents foreign-born 1,353 89.1% Native165 10.9% Foreign-bornOne native, one foreign-born parent 348 100.0% NativeChildren 6 to 17 years - Living with one parent Native parent 4,971 100.0% NativeForeign-born parent 832 50.0% Native832 50.0% Foreign-born
Grandparents responsible for own grandchildren in Tyler
Grandparents (30 to 59 years) White / Caucasian 253 52.5% Responsible for grandchildren229 47.5% Not responsible for grandchildrenBlack or African American 173 44.5% Responsible for grandchildren216 55.5% Not responsible for grandchildrenAsian 22 100.0% Not responsible for grandchildrenOther race 53 100.0% Not responsible for grandchildrenTwo or more races 54 41.0% Responsible for grandchildren78 59.0% Not responsible for grandchildrenWhite alone, not Hispanic / Latino 150 52.3% Responsible for grandchildren137 47.7% Not responsible for grandchildrenHispanic or Latino 229 62.4% Responsible for grandchildren138 37.6% Not responsible for grandchildrenGrandparents (60 years and over) White / Caucasian 62 13.9% Responsible for grandchildren385 86.1% Not responsible for grandchildrenBlack or African American 142 33.5% Responsible for grandchildren282 66.5% Not responsible for grandchildrenAsian 139 100.0% Not responsible for grandchildrenOther race 10 72.8% Responsible for grandchildren4 27.2% Not responsible for grandchildrenWhite alone, not Hispanic / Latino 68 19.1% Responsible for grandchildren289 80.9% Not responsible for grandchildrenHispanic or Latino 7 3.6% Responsible for grandchildren192 96.4% Not responsible for grandchildren