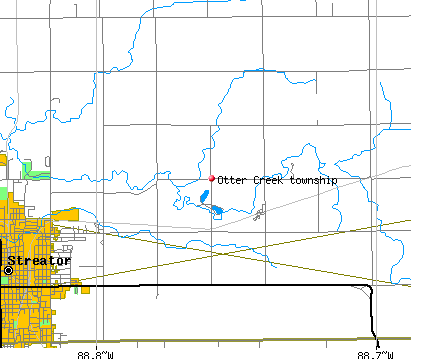
Otter Creek township, La Salle County, Illinois (IL) detailed profile
Number of foreign born residents: 1 (39% naturalized citizens)
| Otter Creek township: | 1.1% |
| Whole state: | 12.3% |
66% of Otter Creek township residents lived in the same house 5 years ago.
Out of people who lived in different houses, 72% lived in this county.
Out of people who lived in different counties, 71% lived in Illinois.
Place of birth for U.S.-born residents:
- This state: 2581
- Northeast: 16
- Midwest: 114
- South: 83
- West: 21
Median price asked for vacant for-sale houses in 2000: $157,100
Percentage of households with unmarried partners: 3.8%
Likely homosexual households (counted as self-reported same-sex unmarried-partner households)
- Lesbian couples: 0.2% of all households
- Gay men: 0.0% of all households
108 people in nursing homes
Housing units in structures:
- One, detached: 964
- One, attached: 2
- Two: 12
- 3 or 4: 36
- 5 to 9: 52
- 10 to 19: 8
- 50 or more: 4
- Mobile homes: 54
Median worth of mobile homes: $82,700
Housing units in Otter Creek township with a mortgage: 415 (11 second mortgage, 46 home equity loan, 0 both second mortgage and home equity loan)
Houses without a mortgage: 386
- Construction (11%)
- Machinery (8%)
- Utilities (7%)
- Educational services (5%)
- Metal and metal products (5%)
- Groceries and related products merchant wholesalers (5%)
- Accommodation and food services (5%)
- Health care (21%)
- Educational services (14%)
- Food (6%)
- Finance and insurance (5%)
- Construction (4%)
- Accommodation and food services (4%)
- Machinery (3%)
- Laborers and material movers, hand (7%)
- Other production occupations including supervisors (7%)
- Driver/sales workers and truck drivers (6%)
- Electrical equipment mechanics and other installation, maintenance, and repair occupations including supervisors (6%)
- Metal workers and plastic workers (5%)
- Construction trades workers except carpenters, electricians, painters, plumbers, and construction laborers (5%)
- Building and grounds cleaning and maintenance occupations (4%)
- Other production occupations including supervisors (9%)
- Preschool, kindergarten, elementary and middle school teachers (7%)
- Other sales and related workers including supervisors (7%)
- Secretaries and administrative assistants (6%)
- Registered nurses (6%)
- Information and record clerks except customer service representatives (6%)
- Retail sales workers except cashiers (5%)
Most common first ancestries reported in Otter Creek township:
- German (23.1%)
- Slovak (17.4%)
- United States or American (12.8%)
- Irish (10.5%)
- English (6.4%)
- Italian (5.8%)
- Swedish (2.2%)
Most common places of birth for the foreign-born residents:
- Pakistan (42%)
- Germany (29%)
- Mexico (13%)
- United Kingdom (10%)
- Thailand (6%)
Means of transportation to work:
- Drove a car alone: 1,094 (90%)
- Carpooled: 80 (7%)
- Bicycle: 1 (0%)
- Walked: 12 (1%)
- Worked at home: 34 (3%)
Most commonly used house heating fuel:
- Utility gas (86%)
- Electricity (6%)
- Bottled, tank, or LP gas (6%)
- Wood (1%)
108 people in nursing homes
96.5% of residents of Otter Creek township speak English at home.
1.1% of residents speak Spanish at home (62% speak English very well, 21% speak English well, 17% speak English not well).
2.2% of residents speak other Indo-European language at home (88% speak English very well, 12% speak English well).
0.2% of residents speak Asian or Pacific Island language at home (40% speak English very well, 60% speak English not well).
Household type by relationship:
Households: 2,735- In family households: 2,460 (666 male householders, 153 female householders)
670 spouses, 825 children (787 natural, 5 adopted, 33 stepchildren), 37 grandchildren, 14 brothers or sisters, 19 parents, 40 other relatives, 36 non-relatives
- In nonfamily households: 275 (127 male householders (115 living alone)), 118 female householders (107 living alone)), 30 nonrelatives
- In group quarters: 112 (all institutionalized)
Size of family households: 374 2-persons, 197 3-persons, 165 4-persons, 59 5-persons, 16 6-persons, 8 7-or-more-persons,
Size of nonfamily households: 222 1-person, 17 2-persons, 6 3-persons,
467 married couples with children.
141 single-parent households (30 men, 111 women).
Private vs. public school enrollment:
Students in private schools in grades 1 to 8 (elementary and middle school): 62
| Here: | 18.8% |
| Illinois: | 13.4% |
Students in private schools in grades 9 to 12 (high school): 3
| Here: | 1.7% |
| Illinois: | 11.1% |
Students in private undergraduate colleges: 2
| Here: | 2.9% |
| Illinois: | 25.8% |