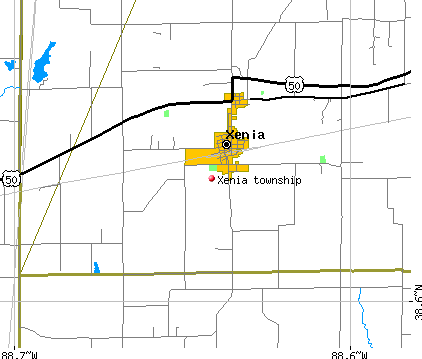
Xenia township, Clay County, Illinois (IL) detailed profile
Number of foreign born residents: 2 (36% naturalized citizens)
| Xenia township: | 1.6% |
| Whole state: | 12.3% |
72% of Xenia township residents lived in the same house 5 years ago.
Out of people who lived in different houses, 81% lived in this county.
Out of people who lived in different counties, 76% lived in Illinois.
Place of birth for U.S.-born residents:
- This state: 556
- Northeast: 4
- Midwest: 50
- South: 33
- West: 13
Median price asked for vacant for-sale houses in 2000: $65,000
Percentage of households with unmarried partners: 6.6%
Likely homosexual households (counted as self-reported same-sex unmarried-partner households)
- Lesbian couples: 0.0% of all households
- Gay men: 0.3% of all households
Housing units in structures:
- One, detached: 223
- Two: 4
- 3 or 4: 9
- 5 to 9: 5
- 10 to 19: 2
- Mobile homes: 69
- Boats, RVs, vans, etc.: 2
Median worth of mobile homes: $27,100
Housing units in Xenia township with a mortgage: 71 (7 second mortgage, 5 home equity loan, 0 both second mortgage and home equity loan)
Houses without a mortgage: 67
- Transportation equipment (10%)
- Repair and maintenance (8%)
- Educational services (7%)
- Construction (5%)
- Health care (5%)
- Mining, quarrying, and oil and gas extraction (4%)
- Chemicals (4%)
- Transportation equipment (14%)
- Public administration (9%)
- Educational services (9%)
- Accommodation and food services (7%)
- Health care (7%)
- Social assistance (5%)
- Apparel (5%)
- Building and grounds cleaning and maintenance occupations (11%)
- Other production occupations including supervisors (11%)
- Driver/sales workers and truck drivers (9%)
- Electrical equipment mechanics and other installation, maintenance, and repair occupations including supervisors (7%)
- Laborers and material movers, hand (7%)
- Assemblers and fabricators (7%)
- Top executives (5%)
- Other sales and related workers including supervisors (5%)
- Other management occupations except farmers and farm managers (5%)
- Assemblers and fabricators (5%)
- Cooks and food preparation workers (5%)
- Other production occupations including supervisors (5%)
- Metal workers and plastic workers (4%)
- Other financial specialists (4%)
Most common first ancestries reported in Xenia township:
- United States or American (33.2%)
- German (25.9%)
- English (9.4%)
- Irish (8.8%)
- Dutch (3.9%)
- French (except Basque) (0.9%)
- Hungarian (0.9%)
Most common places of birth for the foreign-born residents:
- Mexico (73%)
- Germany (27%)
Means of transportation to work:
- Drove a car alone: 262 (82%)
- Carpooled: 28 (9%)
- Bus or trolley bus: 6 (2%)
- Walked: 13 (4%)
- Other means: 3 (1%)
- Worked at home: 9 (3%)
Most commonly used house heating fuel:
- Utility gas (60%)
- Bottled, tank, or LP gas (21%)
- Electricity (11%)
- Wood (6%)
- Other fuel (1%)
- Fuel oil, kerosene, etc. (1%)
96.5% of residents of Xenia township speak English at home.
2.4% of residents speak Spanish at home (93% speak English very well, 7% speak English well).
1.1% of residents speak other Indo-European language at home (100% speak English very well).
Household type by relationship:
Households: 671- In family households: 568 (162 male householders, 34 female householders)
163 spouses, 186 children (165 natural, 1 adopted, 20 stepchildren), 7 grandchildren, 0 brothers or sisters, 0 parents, 2 other relatives, 14 non-relatives
- In nonfamily households: 103 (41 male householders (36 living alone)), 58 female householders (58 living alone)), 4 nonrelatives
Size of family households: 87 2-persons, 51 3-persons, 30 4-persons, 23 5-persons, 5 6-persons,
Size of nonfamily households: 94 1-person, 5 2-persons,
131 married couples with children.
32 single-parent households (6 men, 26 women).
Private vs. public school enrollment:
Students in private schools in grades 1 to 8 (elementary and middle school): 1
| Here: | 1.3% |
| Illinois: | 13.4% |
Students in private schools in grades 9 to 12 (high school): 0
| Here: | 0.0% |
| Illinois: | 11.1% |
Students in private undergraduate colleges: 0
| Here: | 0.0% |
| Illinois: | 25.8% |