Airmont: Fire Incidents, New York (NY)
Where are fire incidents reported in Airmont, NY
Something went wrong! Please refresh the page.
|
| |||||||||||||||||||||||||||||||||||||||||||||||||||||||||||||||||||||||||||||||||||||||||||||||||||||||||||||
2003 - 2018 National Fire Incident Reporting System (NFIRS) incidents
- Incident types reported to NFIRS in Airmont, NY
- 62334.4%Fire
- 62334.4%Hazardous Condition
- 33118.3%False Alarm
- 1377.6%Good Intent Call
- 482.7%Service Call
- 412.3%Rescue & EMS
- 60.3%Severe Weather
- Fire incident types reported to NFIRS in Airmont, NY
- 52784.6%Structure Fires
- 589.3%Outside Fires
- 223.5%Other
- 162.6%Mobile Property/Vehicle Fires
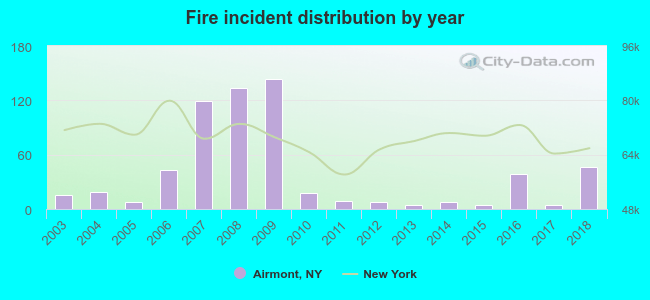 Based on the data from the years 2003 - 2018 the average number of fire incidents per year is 39. The highest number of fire incidents - 144 took place in 2009, and the least - 4 in 2013. The data has a growing trend.
The average number of yearly fire incidents per 10k residents in Airmont, NY compared to nearest cities:
(Note: Based on data for the last 3 years, including only cities with population 5,000 and above)
| Airmont: | 33.4 |
| Viola: | 23.8 |
| Monsey: | 31.5 |
| Kaser: | 16.0 |
| Suffern: | 30.6 |
| Chestnut Ridge: | 18.8 |
| Spring Valley: | 13.7 |
| Hillcrest: | 7.5 |
| Wesley Hills: | 31.0 |
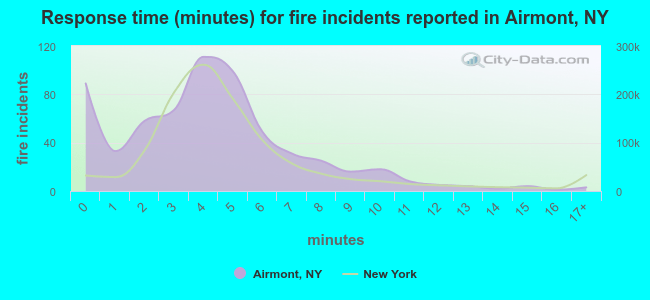 The median response time based on all reported fire incidents is 4 minutes. This is about the same as the New York median value.
The median response time in Airmont, NY compared to nearest cities:
(Note: Based on data for all years, including only cities with at least 500 fire incidents)
| Airmont: | 4 minutes |
| Monsey: | 0 minutes |
| Suffern: | 3 minutes |
| Spring Valley: | 5 minutes |
| Ramsey: | 7 minutes |
| Nanuet: | 5 minutes |
| Pearl River: | 4 minutes |
| New City: | 4 minutes |
| Pomona: | 5 minutes |
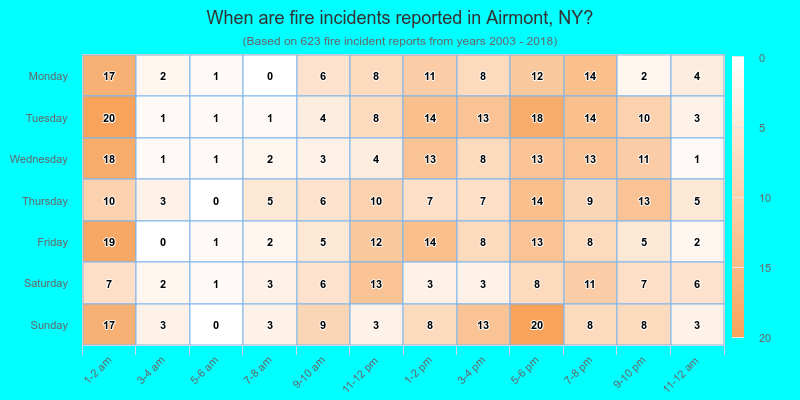
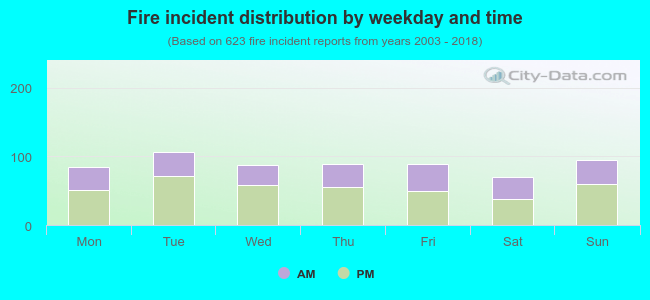 38.2% incidents where reported in the morning and 61.8% in the evening. The most fires (17.2%) took place on Tuesday, and the least (11.2%) on Saturday.
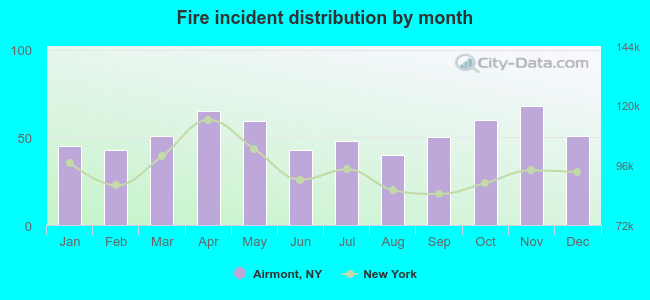 According to the 623 fires from years 2003 - 2018 most fires (10.9%) took place during November, and the least (6.4%) in August.
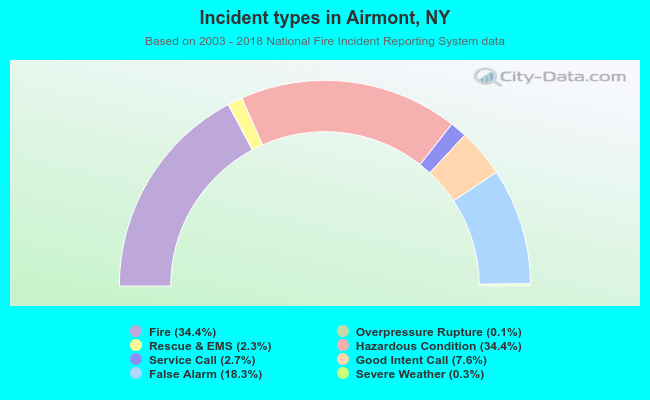 Out of all 1,810 cases reported during the years 2003 - 2018, the most belonged to the categories: Fire (34.4%), Hazardous Condition (34.4%), and False Alarm (18.3%).
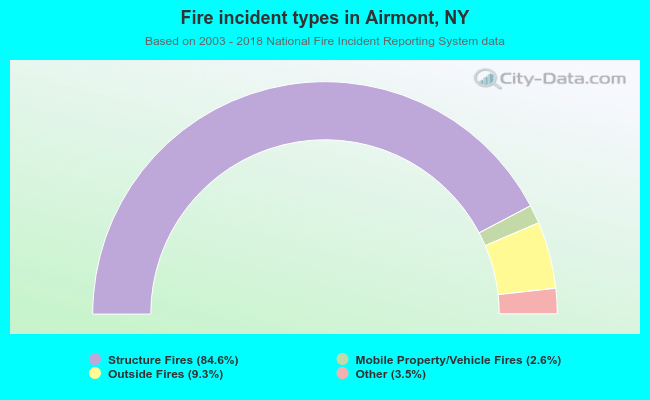 When looking into fire subcategories, the most incidents belonged to: Structure Fires (84.6%), and Outside Fires (9.3%).